0
2022
Dementia Drugs Market

Dementia Drugs Market

by Indication (Lewy Body Dementia, Parkinsons Disease Dementia, Alzheimers Disease, Vascular Dementia, Other Indications), by Drug Class (Cholinesterase Inhibitors, NMDA Antagonists and its Combination Drugs), by Distribution Channel (Retail Pharmacies, Hospital Pharmacies, Online Pharmacies): Global Opportunity Analysis and Industry Forecast, 2021-2031

Report Code: A12014
Oct 2022 | Pages: 265
Tables: 147
Charts: 60
  • Formats*:

  • pdf

    Single User License, Five User
    License & Enterprise User License

  • xls

    Data Pack Excel License

  • ppt

    It comes with the additional cost
    of $2500.00 contact sales.


Dementia Drugs Market Research, 2031

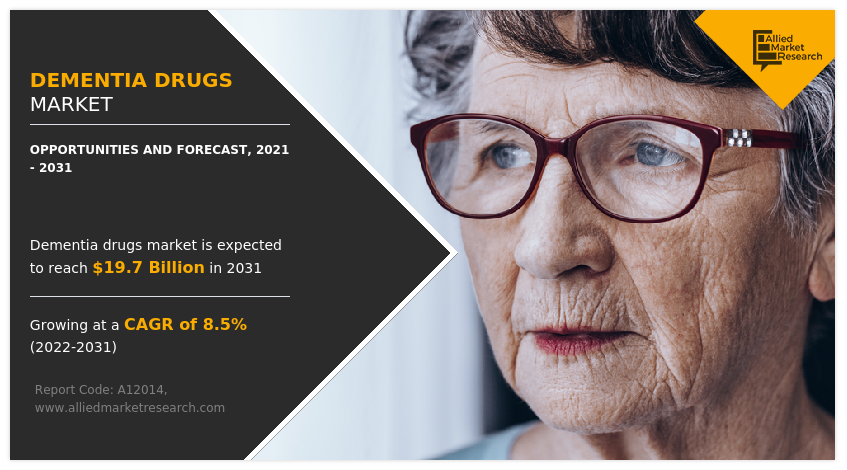
The global dementia drugs market size was valued at $8.7 billion in 2021, and is projected to reach $19.7 billion by 2031, growing at a CAGR of 8.5% from 2022 to 2031.

Dementia entails a decline in mental function from a previously higher level that is severe enough to interfere with daily living. A person with dementia has two or more of these specific difficulties, including decline in memory, reasoning, language, coordination, mood, and behavior. Furthermore, dementia develops when parts of the brain involved with learning, memory, decision-making or language are affected by infections or diseases. The most common cause of dementia is Alzheimer’s disease. Dementia is caused by damage to brain. Dementia affects brain’s nerve cells, which destroys brain’s ability to communicate with its various areas. Dementia can also result from blocked blood flow to brain, depriving it of needed oxygen and nutrients. Without oxygen and nutrients, brain tissue dies. Damage to brain results in different symptoms, depending on the area of brain that is affected. Some dementias are not reversible and worsen over time.

Increase in demand for dementia drugs market size is anticipated to increase globally during the forecast period, owing to increase in the prevalence of Alzheimer’s disease, advancement in R&D activities for drug development, and rise in adoption of early diagnosis. In addition, the growing geriatric population, increase in investment by players in R&D, and presence of robust pipeline candidates, rise in expenditure on the development of healthcare infrastructure, increase in public awareness about the disease prevention in developing regions, and surge in demand for personalized medicine further drive the growth of the market globally. However, strict government regulations related to product approval and high cost linked to R& D activity restrain the growth of dementia drugs industry. Conversely, accelerated technological advancement in drug discovery technique and high investment by the government for drug development are expected to offer lucrative dementia drugs market opportunity for the key player in the market.
The outbreak of COVID-19 has a positive impact on the dementia drugs market. According to Alzheimer’s Disease International, in September 2021, it was reported that the pandemic caused a significant rise in the number of dementia patients in the long term, as some research has shown that COVID-19 infection can increase a person’s likelihood of developing dementia and cause dementia symptoms to show up earlier. Moreover, COVID-19 shows adverse impact on brain function by reducing the level of consciousness. Thus, increase in infection of COVID-19 in patients with Alzheimer’s disease increased the demand for dementia drugs during the pandemic.

Dementia Drugs Market

The dementia drugs market is segmented into Indication, Drug Class and Distribution Channel.On the basis of indications, the market is divided into Lewy body dementia, Parkinson’s disease dementia, Alzheimer’s disease, vascular dementia, and other indications. On the basis of drug class, the market is classified into cholinesterase inhibitors and NMDA antagonist and its combination drugs. On the basis of distribution channel, the market is classified into hospital pharmacies, retail pharmacies, and online pharmacies. Furthermore, on the basis of region, the market is analyzed across North America, Europe, Asia-Pacific, and LAMEA.

Global dementia drugs market by Indications

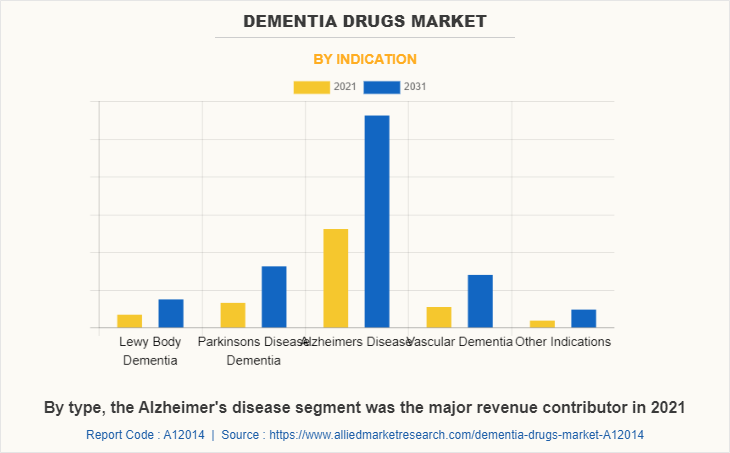
By Indications, the Alzheimer's disease segment was the major revenue contributor of dementia drugs market share in 2021 and is anticipated to continue this trend during the forecast period, owing to increase in life expectancy, rise in ageing population, and changes in lifestyle. In addition, the growth is associated with rapid improvement in medical infrastructure, increase in scientific studies associated with the treatment, and monitoring of Alzheimer's disease, as well as significant government and private sector funding in the Alzheimer's research, which further boosts the dementia drugs market growth. On the other side, the vascular dementia segment is projected to exhibit the fastest market growth during the forecast period, owing to increasing number of populations at high risk of vascular dementia such as geriatrics and smokers, as well as increasing understanding of diagnosis modalities. In addition, increasing focus to develop vascular dementia treatment for the underlying disease and the absence of any FDA-approved drug further boost dementia drugs industry growth.
Dementia Drugs Market

Global dementia drugs market by drug class

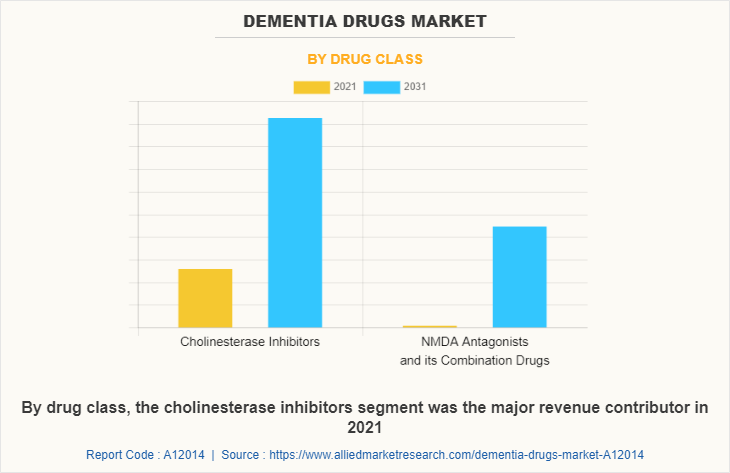
By drug class, the cholinesterase inhibitors segment was the major revenue contributor in 2021 and is anticipated to continue this trend during the forecast period, owing to increase in geriatric population, increase in prevalence of dementia, and growth in drug discovery. In addition, certain factors such as emerging technologies, developing markets, and government initiatives toward R&D of Alzheimer’s therapeutics are expected to fuel the cholinesterase inhibitors segment growth during the forecast period.
Dementia Drugs Market

Global dementia drugs market by distribution channel

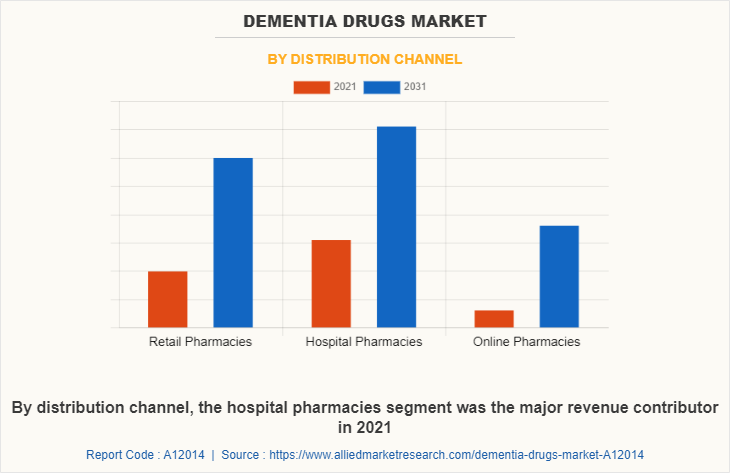
By distribution channel, the hospital pharmacies segment was the major revenue contributor of dementia drugs market share in 2021 and is anticipated to continue this trend during dementia drugs market forecast, owing to increase in geriatric population and Alzheimer’s patients.
Dementia Drugs Market

Global dementia drugs market by region

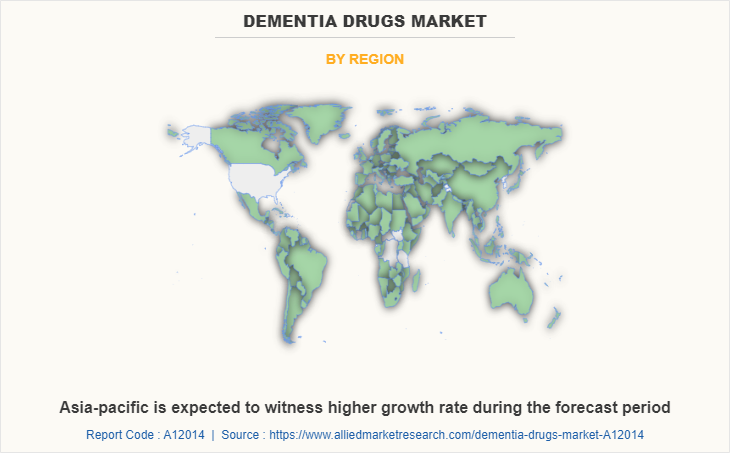
By region, North America dominated the market in 2021, accounting for the highest share, and is anticipated to maintain this trend during the forecast period, owing to investments made by key players for various R&D activities as well as launch of new products in the U.S. In addition, increase awareness among consumers for the adoption of dementia drugs further boosts the dementid drugs industry growth.
Dementia Drugs Market

The major companies profiled in the report include, Abbvie Inc., Appotex Inc., Aurobindo Pharma Limited, Biogen Idec Inc., Eisai Global, Eli Lilly and Company, F. Hoffmann-La Roche Ltd., Johnson & Johnson, Novartis Ag and Teva Pharmaceuticals.

Key Benefits For Stakeholders

  • This report provides a quantitative analysis of the market segments, current trends, estimations, and dynamics of the dementia drugs market analysis from 2021 to 2031 to identify the prevailing dementia drugs market opportunities.
  • The market research is offered along with information related to key drivers, restraints, and opportunities.
  • Porter's five forces analysis highlights the potency of buyers and suppliers to enable stakeholders make profit-oriented business decisions and strengthen their supplier-buyer network.
  • In-depth analysis of the dementia drugs market segmentation assists to determine the prevailing market opportunities.
  • Major countries in each region are mapped according to their revenue contribution to the global market.
  • Market player positioning facilitates benchmarking and provides a clear understanding of the present position of the market players.
  • The report includes the analysis of the regional as well as global dementia drugs market trends, key players, market segments, application areas, and market growth strategies.

Dementia Drugs Market Report Highlights

Aspects Details
Market Size By 2031 USD 19.7 billion
Growth Rate CAGR of 8.5%
Forecast period 2021 - 2031
Report Pages 265
By Indication
  • Lewy Body Dementia
  • Parkinsons Disease Dementia
  • Alzheimers Disease
  • Vascular Dementia
  • Other Indications
By Drug Class
  • Cholinesterase Inhibitors
  • NMDA Antagonists and its Combination Drugs
By Distribution Channel
  • Retail Pharmacies
  • Hospital Pharmacies
  • Online Pharmacies
By Region
  • North America  (U.S., Canada, Mexico)
  • Europe  (Germany, France, UK, Italy, Spain, Rest of Europe)
  • Asia-Pacific  (China, Japan, India, South Korea, Australia, Rest of Asia-Pacific)
  • LAMEA  (Brazil, Saudi Arabia, South Africa, Rest of LAMEA)
Key Market Players apotex inc., Eisai, Biogen Idec, , F. Hoffmann-La Roche AG, Teva Pharmaceutical Industries, Novartis AG, Johnson & Johnson, Abbvie Inc, Aurobindo Pharma Ltd, Eli Lilly and Company
 
  • CHAPTER 1:INTRODUCTION

    • 1.1.Report description

    • 1.2.Key market segments

    • 1.3.Key benefits to the stakeholders

    • 1.4.Research Methodology

      • 1.4.1.Secondary research

      • 1.4.2.Primary research

      • 1.4.3.Analyst tools and models

  • CHAPTER 2:EXECUTIVE SUMMARY

    • 2.1.Key findings of the study

    • 2.2.CXO Perspective

  • CHAPTER 3:MARKET OVERVIEW

    • 3.1.Market definition and scope

    • 3.2.Key findings

      • 3.2.1.Top investment pockets

    • 3.3.Porter’s five forces analysis

    • 3.4.Top player positioning

    • 3.5.Market dynamics

      • 3.5.1.Drivers

      • 3.5.2.Restraints

      • 3.5.3.Opportunities

    • 3.6.COVID-19 Impact Analysis on the market

  • CHAPTER 4: DEMENTIA DRUGS MARKET, BY INDICATION

    • 4.1 Overview

      • 4.1.1 Market size and forecast

    • 4.2 Lewy Body Dementia

      • 4.2.1 Key market trends, growth factors and opportunities

      • 4.2.2 Market size and forecast, by region

      • 4.2.3 Market share analysis by country

    • 4.3 Parkinsons Disease Dementia

      • 4.3.1 Key market trends, growth factors and opportunities

      • 4.3.2 Market size and forecast, by region

      • 4.3.3 Market share analysis by country

    • 4.4 Alzheimers Disease

      • 4.4.1 Key market trends, growth factors and opportunities

      • 4.4.2 Market size and forecast, by region

      • 4.4.3 Market share analysis by country

    • 4.5 Vascular Dementia

      • 4.5.1 Key market trends, growth factors and opportunities

      • 4.5.2 Market size and forecast, by region

      • 4.5.3 Market share analysis by country

    • 4.6 Other Indications

      • 4.6.1 Key market trends, growth factors and opportunities

      • 4.6.2 Market size and forecast, by region

      • 4.6.3 Market share analysis by country

  • CHAPTER 5: DEMENTIA DRUGS MARKET, BY DRUG CLASS

    • 5.1 Overview

      • 5.1.1 Market size and forecast

    • 5.2 Cholinesterase Inhibitors

      • 5.2.1 Key market trends, growth factors and opportunities

      • 5.2.2 Market size and forecast, by region

      • 5.2.3 Market share analysis by country

    • 5.3 NMDA Antagonists and its Combination Drugs

      • 5.3.1 Key market trends, growth factors and opportunities

      • 5.3.2 Market size and forecast, by region

      • 5.3.3 Market share analysis by country

  • CHAPTER 6: DEMENTIA DRUGS MARKET, BY DISTRIBUTION CHANNEL

    • 6.1 Overview

      • 6.1.1 Market size and forecast

    • 6.2 Retail Pharmacies

      • 6.2.1 Key market trends, growth factors and opportunities

      • 6.2.2 Market size and forecast, by region

      • 6.2.3 Market share analysis by country

    • 6.3 Hospital Pharmacies

      • 6.3.1 Key market trends, growth factors and opportunities

      • 6.3.2 Market size and forecast, by region

      • 6.3.3 Market share analysis by country

    • 6.4 Online Pharmacies

      • 6.4.1 Key market trends, growth factors and opportunities

      • 6.4.2 Market size and forecast, by region

      • 6.4.3 Market share analysis by country

  • CHAPTER 7: DEMENTIA DRUGS MARKET, BY REGION

    • 7.1 Overview

      • 7.1.1 Market size and forecast

    • 7.2 North America

      • 7.2.1 Key trends and opportunities

      • 7.2.2 North America Market size and forecast, by Indication

      • 7.2.3 North America Market size and forecast, by Drug Class

      • 7.2.4 North America Market size and forecast, by Distribution Channel

      • 7.2.5 North America Market size and forecast, by country

        • 7.2.5.1 U.S.
          • 7.2.5.1.1 Key market trends, growth factors and opportunities
          • 7.2.5.1.2 Market size and forecast, by Indication
          • 7.2.5.1.3 Market size and forecast, by Drug Class
          • 7.2.5.1.4 Market size and forecast, by Distribution Channel
        • 7.2.5.2 Canada
          • 7.2.5.2.1 Key market trends, growth factors and opportunities
          • 7.2.5.2.2 Market size and forecast, by Indication
          • 7.2.5.2.3 Market size and forecast, by Drug Class
          • 7.2.5.2.4 Market size and forecast, by Distribution Channel
        • 7.2.5.3 Mexico
          • 7.2.5.3.1 Key market trends, growth factors and opportunities
          • 7.2.5.3.2 Market size and forecast, by Indication
          • 7.2.5.3.3 Market size and forecast, by Drug Class
          • 7.2.5.3.4 Market size and forecast, by Distribution Channel
    • 7.3 Europe

      • 7.3.1 Key trends and opportunities

      • 7.3.2 Europe Market size and forecast, by Indication

      • 7.3.3 Europe Market size and forecast, by Drug Class

      • 7.3.4 Europe Market size and forecast, by Distribution Channel

      • 7.3.5 Europe Market size and forecast, by country

        • 7.3.5.1 Germany
          • 7.3.5.1.1 Key market trends, growth factors and opportunities
          • 7.3.5.1.2 Market size and forecast, by Indication
          • 7.3.5.1.3 Market size and forecast, by Drug Class
          • 7.3.5.1.4 Market size and forecast, by Distribution Channel
        • 7.3.5.2 France
          • 7.3.5.2.1 Key market trends, growth factors and opportunities
          • 7.3.5.2.2 Market size and forecast, by Indication
          • 7.3.5.2.3 Market size and forecast, by Drug Class
          • 7.3.5.2.4 Market size and forecast, by Distribution Channel
        • 7.3.5.3 UK
          • 7.3.5.3.1 Key market trends, growth factors and opportunities
          • 7.3.5.3.2 Market size and forecast, by Indication
          • 7.3.5.3.3 Market size and forecast, by Drug Class
          • 7.3.5.3.4 Market size and forecast, by Distribution Channel
        • 7.3.5.4 Italy
          • 7.3.5.4.1 Key market trends, growth factors and opportunities
          • 7.3.5.4.2 Market size and forecast, by Indication
          • 7.3.5.4.3 Market size and forecast, by Drug Class
          • 7.3.5.4.4 Market size and forecast, by Distribution Channel
        • 7.3.5.5 Spain
          • 7.3.5.5.1 Key market trends, growth factors and opportunities
          • 7.3.5.5.2 Market size and forecast, by Indication
          • 7.3.5.5.3 Market size and forecast, by Drug Class
          • 7.3.5.5.4 Market size and forecast, by Distribution Channel
        • 7.3.5.6 Rest of Europe
          • 7.3.5.6.1 Key market trends, growth factors and opportunities
          • 7.3.5.6.2 Market size and forecast, by Indication
          • 7.3.5.6.3 Market size and forecast, by Drug Class
          • 7.3.5.6.4 Market size and forecast, by Distribution Channel
    • 7.4 Asia-Pacific

      • 7.4.1 Key trends and opportunities

      • 7.4.2 Asia-Pacific Market size and forecast, by Indication

      • 7.4.3 Asia-Pacific Market size and forecast, by Drug Class

      • 7.4.4 Asia-Pacific Market size and forecast, by Distribution Channel

      • 7.4.5 Asia-Pacific Market size and forecast, by country

        • 7.4.5.1 China
          • 7.4.5.1.1 Key market trends, growth factors and opportunities
          • 7.4.5.1.2 Market size and forecast, by Indication
          • 7.4.5.1.3 Market size and forecast, by Drug Class
          • 7.4.5.1.4 Market size and forecast, by Distribution Channel
        • 7.4.5.2 Japan
          • 7.4.5.2.1 Key market trends, growth factors and opportunities
          • 7.4.5.2.2 Market size and forecast, by Indication
          • 7.4.5.2.3 Market size and forecast, by Drug Class
          • 7.4.5.2.4 Market size and forecast, by Distribution Channel
        • 7.4.5.3 India
          • 7.4.5.3.1 Key market trends, growth factors and opportunities
          • 7.4.5.3.2 Market size and forecast, by Indication
          • 7.4.5.3.3 Market size and forecast, by Drug Class
          • 7.4.5.3.4 Market size and forecast, by Distribution Channel
        • 7.4.5.4 South Korea
          • 7.4.5.4.1 Key market trends, growth factors and opportunities
          • 7.4.5.4.2 Market size and forecast, by Indication
          • 7.4.5.4.3 Market size and forecast, by Drug Class
          • 7.4.5.4.4 Market size and forecast, by Distribution Channel
        • 7.4.5.5 Australia
          • 7.4.5.5.1 Key market trends, growth factors and opportunities
          • 7.4.5.5.2 Market size and forecast, by Indication
          • 7.4.5.5.3 Market size and forecast, by Drug Class
          • 7.4.5.5.4 Market size and forecast, by Distribution Channel
        • 7.4.5.6 Rest of Asia-Pacific
          • 7.4.5.6.1 Key market trends, growth factors and opportunities
          • 7.4.5.6.2 Market size and forecast, by Indication
          • 7.4.5.6.3 Market size and forecast, by Drug Class
          • 7.4.5.6.4 Market size and forecast, by Distribution Channel
    • 7.5 LAMEA

      • 7.5.1 Key trends and opportunities

      • 7.5.2 LAMEA Market size and forecast, by Indication

      • 7.5.3 LAMEA Market size and forecast, by Drug Class

      • 7.5.4 LAMEA Market size and forecast, by Distribution Channel

      • 7.5.5 LAMEA Market size and forecast, by country

        • 7.5.5.1 Brazil
          • 7.5.5.1.1 Key market trends, growth factors and opportunities
          • 7.5.5.1.2 Market size and forecast, by Indication
          • 7.5.5.1.3 Market size and forecast, by Drug Class
          • 7.5.5.1.4 Market size and forecast, by Distribution Channel
        • 7.5.5.2 Saudi Arabia
          • 7.5.5.2.1 Key market trends, growth factors and opportunities
          • 7.5.5.2.2 Market size and forecast, by Indication
          • 7.5.5.2.3 Market size and forecast, by Drug Class
          • 7.5.5.2.4 Market size and forecast, by Distribution Channel
        • 7.5.5.3 South Africa
          • 7.5.5.3.1 Key market trends, growth factors and opportunities
          • 7.5.5.3.2 Market size and forecast, by Indication
          • 7.5.5.3.3 Market size and forecast, by Drug Class
          • 7.5.5.3.4 Market size and forecast, by Distribution Channel
        • 7.5.5.4 Rest of LAMEA
          • 7.5.5.4.1 Key market trends, growth factors and opportunities
          • 7.5.5.4.2 Market size and forecast, by Indication
          • 7.5.5.4.3 Market size and forecast, by Drug Class
          • 7.5.5.4.4 Market size and forecast, by Distribution Channel
  • CHAPTER 8: COMPANY LANDSCAPE

    • 8.1. Introduction

    • 8.2. Top winning strategies

    • 8.3. Product Mapping of Top 10 Player

    • 8.4. Competitive Dashboard

    • 8.5. Competitive Heatmap

    • 8.6. Key developments

  • CHAPTER 9: COMPANY PROFILES

    • 9.1 apotex inc.

      • 9.1.1 Company overview

      • 9.1.2 Company snapshot

      • 9.1.3 Operating business segments

      • 9.1.4 Product portfolio

      • 9.1.5 Business performance

      • 9.1.6 Key strategic moves and developments

    • 9.2 Aurobindo Pharma Ltd

      • 9.2.1 Company overview

      • 9.2.2 Company snapshot

      • 9.2.3 Operating business segments

      • 9.2.4 Product portfolio

      • 9.2.5 Business performance

      • 9.2.6 Key strategic moves and developments

    • 9.3 Biogen Idec

      • 9.3.1 Company overview

      • 9.3.2 Company snapshot

      • 9.3.3 Operating business segments

      • 9.3.4 Product portfolio

      • 9.3.5 Business performance

      • 9.3.6 Key strategic moves and developments

    • 9.4 Eisai

      • 9.4.1 Company overview

      • 9.4.2 Company snapshot

      • 9.4.3 Operating business segments

      • 9.4.4 Product portfolio

      • 9.4.5 Business performance

      • 9.4.6 Key strategic moves and developments

    • 9.5 Eli Lilly and Company

      • 9.5.1 Company overview

      • 9.5.2 Company snapshot

      • 9.5.3 Operating business segments

      • 9.5.4 Product portfolio

      • 9.5.5 Business performance

      • 9.5.6 Key strategic moves and developments

    • 9.6 Johnson & Johnson

      • 9.6.1 Company overview

      • 9.6.2 Company snapshot

      • 9.6.3 Operating business segments

      • 9.6.4 Product portfolio

      • 9.6.5 Business performance

      • 9.6.6 Key strategic moves and developments

    • 9.7 Abbvie Inc

      • 9.7.1 Company overview

      • 9.7.2 Company snapshot

      • 9.7.3 Operating business segments

      • 9.7.4 Product portfolio

      • 9.7.5 Business performance

      • 9.7.6 Key strategic moves and developments

    • 9.8 , F. Hoffmann-La Roche AG

      • 9.8.1 Company overview

      • 9.8.2 Company snapshot

      • 9.8.3 Operating business segments

      • 9.8.4 Product portfolio

      • 9.8.5 Business performance

      • 9.8.6 Key strategic moves and developments

    • 9.9 Teva Pharmaceutical Industries

      • 9.9.1 Company overview

      • 9.9.2 Company snapshot

      • 9.9.3 Operating business segments

      • 9.9.4 Product portfolio

      • 9.9.5 Business performance

      • 9.9.6 Key strategic moves and developments

    • 9.10 Novartis AG

      • 9.10.1 Company overview

      • 9.10.2 Company snapshot

      • 9.10.3 Operating business segments

      • 9.10.4 Product portfolio

      • 9.10.5 Business performance

      • 9.10.6 Key strategic moves and developments

  • LIST OF TABLES

  • TABLE 1. GLOBAL DEMENTIA DRUGS MARKET, BY INDICATION, 2021-2031 (REVENUE, $MILLION)
    TABLE 2. DEMENTIA DRUGS MARKET FOR LEWY BODY DEMENTIA, BY REGION, 2021-2031 (REVENUE, $MILLION)
    TABLE 3. DEMENTIA DRUGS MARKET FOR LEWY BODY DEMENTIA, BY COUNTRY, 2021-2031 (REVENUE, $MILLION)
    TABLE 4. DEMENTIA DRUGS MARKET FOR PARKINSONS DISEASE DEMENTIA, BY REGION, 2021-2031 (REVENUE, $MILLION)
    TABLE 5. DEMENTIA DRUGS MARKET FOR PARKINSONS DISEASE DEMENTIA, BY COUNTRY, 2021-2031 (REVENUE, $MILLION)
    TABLE 6. DEMENTIA DRUGS MARKET FOR ALZHEIMERS DISEASE, BY REGION, 2021-2031 (REVENUE, $MILLION)
    TABLE 7. DEMENTIA DRUGS MARKET FOR ALZHEIMERS DISEASE, BY COUNTRY, 2021-2031 (REVENUE, $MILLION)
    TABLE 8. DEMENTIA DRUGS MARKET FOR VASCULAR DEMENTIA, BY REGION, 2021-2031 (REVENUE, $MILLION)
    TABLE 9. DEMENTIA DRUGS MARKET FOR VASCULAR DEMENTIA, BY COUNTRY, 2021-2031 (REVENUE, $MILLION)
    TABLE 10. DEMENTIA DRUGS MARKET FOR OTHER INDICATIONS, BY REGION, 2021-2031 (REVENUE, $MILLION)
    TABLE 11. DEMENTIA DRUGS MARKET FOR OTHER INDICATIONS, BY COUNTRY, 2021-2031 (REVENUE, $MILLION)
    TABLE 12. GLOBAL DEMENTIA DRUGS MARKET, BY DRUG CLASS, 2021-2031 (REVENUE, $MILLION)
    TABLE 13. DEMENTIA DRUGS MARKET FOR CHOLINESTERASE INHIBITORS, BY REGION, 2021-2031 (REVENUE, $MILLION)
    TABLE 14. DEMENTIA DRUGS MARKET FOR CHOLINESTERASE INHIBITORS, BY COUNTRY, 2021-2031 (REVENUE, $MILLION)
    TABLE 15. DEMENTIA DRUGS MARKET FOR NMDA ANTAGONISTS AND ITS COMBINATION DRUGS, BY REGION, 2021-2031 (REVENUE, $MILLION)
    TABLE 16. DEMENTIA DRUGS MARKET FOR NMDA ANTAGONISTS AND ITS COMBINATION DRUGS, BY COUNTRY, 2021-2031 (REVENUE, $MILLION)
    TABLE 17. GLOBAL DEMENTIA DRUGS MARKET, BY DISTRIBUTION CHANNEL, 2021-2031 (REVENUE, $MILLION)
    TABLE 18. DEMENTIA DRUGS MARKET FOR RETAIL PHARMACIES, BY REGION, 2021-2031 (REVENUE, $MILLION)
    TABLE 19. DEMENTIA DRUGS MARKET FOR RETAIL PHARMACIES, BY COUNTRY, 2021-2031 (REVENUE, $MILLION)
    TABLE 20. DEMENTIA DRUGS MARKET FOR HOSPITAL PHARMACIES, BY REGION, 2021-2031 (REVENUE, $MILLION)
    TABLE 21. DEMENTIA DRUGS MARKET FOR HOSPITAL PHARMACIES, BY COUNTRY, 2021-2031 (REVENUE, $MILLION)
    TABLE 22. DEMENTIA DRUGS MARKET FOR ONLINE PHARMACIES, BY REGION, 2021-2031 (REVENUE, $MILLION)
    TABLE 23. DEMENTIA DRUGS MARKET FOR ONLINE PHARMACIES, BY COUNTRY, 2021-2031 (REVENUE, $MILLION)
    TABLE 24. DEMENTIA DRUGS MARKET, BY REGION, 2021-2031 (REVENUE, $MILLION)
    TABLE 25. NORTH AMERICA DEMENTIA DRUGS MARKET, BY INDICATION, 2021-2031 (REVENUE, $MILLION)
    TABLE 26. NORTH AMERICA DEMENTIA DRUGS MARKET, BY DRUG CLASS, 2021-2031 (REVENUE, $MILLION)
    TABLE 27. NORTH AMERICA DEMENTIA DRUGS MARKET, BY DISTRIBUTION CHANNEL, 2021-2031 (REVENUE, $MILLION)
    TABLE 28. NORTH AMERICA DEMENTIA DRUGS MARKET, BY COUNTRY, 2021-2031 (REVENUE, $MILLION)
    TABLE 29. U.S. DEMENTIA DRUGS MARKET, BY INDICATION, 2021-2031 (REVENUE, $MILLION)
    TABLE 30. U.S. DEMENTIA DRUGS MARKET, BY DRUG CLASS, 2021-2031 (REVENUE, $MILLION)
    TABLE 31. U.S. DEMENTIA DRUGS MARKET, BY DISTRIBUTION CHANNEL, 2021-2031 (REVENUE, $MILLION)
    TABLE 32. CANADA DEMENTIA DRUGS MARKET, BY INDICATION, 2021-2031 (REVENUE, $MILLION)
    TABLE 33. CANADA DEMENTIA DRUGS MARKET, BY DRUG CLASS, 2021-2031 (REVENUE, $MILLION)
    TABLE 34. CANADA DEMENTIA DRUGS MARKET, BY DISTRIBUTION CHANNEL, 2021-2031 (REVENUE, $MILLION)
    TABLE 35. MEXICO DEMENTIA DRUGS MARKET, BY INDICATION, 2021-2031 (REVENUE, $MILLION)
    TABLE 36. MEXICO DEMENTIA DRUGS MARKET, BY DRUG CLASS, 2021-2031 (REVENUE, $MILLION)
    TABLE 37. MEXICO DEMENTIA DRUGS MARKET, BY DISTRIBUTION CHANNEL, 2021-2031 (REVENUE, $MILLION)
    TABLE 38. EUROPE DEMENTIA DRUGS MARKET, BY INDICATION, 2021-2031 (REVENUE, $MILLION)
    TABLE 39. EUROPE DEMENTIA DRUGS MARKET, BY DRUG CLASS, 2021-2031 (REVENUE, $MILLION)
    TABLE 40. EUROPE DEMENTIA DRUGS MARKET, BY DISTRIBUTION CHANNEL, 2021-2031 (REVENUE, $MILLION)
    TABLE 41. EUROPE DEMENTIA DRUGS MARKET, BY COUNTRY, 2021-2031 (REVENUE, $MILLION)
    TABLE 42. GERMANY DEMENTIA DRUGS MARKET, BY INDICATION, 2021-2031 (REVENUE, $MILLION)
    TABLE 43. GERMANY DEMENTIA DRUGS MARKET, BY DRUG CLASS, 2021-2031 (REVENUE, $MILLION)
    TABLE 44. GERMANY DEMENTIA DRUGS MARKET, BY DISTRIBUTION CHANNEL, 2021-2031 (REVENUE, $MILLION)
    TABLE 45. FRANCE DEMENTIA DRUGS MARKET, BY INDICATION, 2021-2031 (REVENUE, $MILLION)
    TABLE 46. FRANCE DEMENTIA DRUGS MARKET, BY DRUG CLASS, 2021-2031 (REVENUE, $MILLION)
    TABLE 47. FRANCE DEMENTIA DRUGS MARKET, BY DISTRIBUTION CHANNEL, 2021-2031 (REVENUE, $MILLION)
    TABLE 48. UK DEMENTIA DRUGS MARKET, BY INDICATION, 2021-2031 (REVENUE, $MILLION)
    TABLE 49. UK DEMENTIA DRUGS MARKET, BY DRUG CLASS, 2021-2031 (REVENUE, $MILLION)
    TABLE 50. UK DEMENTIA DRUGS MARKET, BY DISTRIBUTION CHANNEL, 2021-2031 (REVENUE, $MILLION)
    TABLE 51. ITALY DEMENTIA DRUGS MARKET, BY INDICATION, 2021-2031 (REVENUE, $MILLION)
    TABLE 52. ITALY DEMENTIA DRUGS MARKET, BY DRUG CLASS, 2021-2031 (REVENUE, $MILLION)
    TABLE 53. ITALY DEMENTIA DRUGS MARKET, BY DISTRIBUTION CHANNEL, 2021-2031 (REVENUE, $MILLION)
    TABLE 54. SPAIN DEMENTIA DRUGS MARKET, BY INDICATION, 2021-2031 (REVENUE, $MILLION)
    TABLE 55. SPAIN DEMENTIA DRUGS MARKET, BY DRUG CLASS, 2021-2031 (REVENUE, $MILLION)
    TABLE 56. SPAIN DEMENTIA DRUGS MARKET, BY DISTRIBUTION CHANNEL, 2021-2031 (REVENUE, $MILLION)
    TABLE 57. REST OF EUROPE DEMENTIA DRUGS MARKET, BY INDICATION, 2021-2031 (REVENUE, $MILLION)
    TABLE 58. REST OF EUROPE DEMENTIA DRUGS MARKET, BY DRUG CLASS, 2021-2031 (REVENUE, $MILLION)
    TABLE 59. REST OF EUROPE DEMENTIA DRUGS MARKET, BY DISTRIBUTION CHANNEL, 2021-2031 (REVENUE, $MILLION)
    TABLE 60. ASIA-PACIFIC DEMENTIA DRUGS MARKET, BY INDICATION, 2021-2031 (REVENUE, $MILLION)
    TABLE 61. ASIA-PACIFIC DEMENTIA DRUGS MARKET, BY DRUG CLASS, 2021-2031 (REVENUE, $MILLION)
    TABLE 62. ASIA-PACIFIC DEMENTIA DRUGS MARKET, BY DISTRIBUTION CHANNEL, 2021-2031 (REVENUE, $MILLION)
    TABLE 63. ASIA-PACIFIC DEMENTIA DRUGS MARKET, BY COUNTRY, 2021-2031 (REVENUE, $MILLION)
    TABLE 64. CHINA DEMENTIA DRUGS MARKET, BY INDICATION, 2021-2031 (REVENUE, $MILLION)
    TABLE 65. CHINA DEMENTIA DRUGS MARKET, BY DRUG CLASS, 2021-2031 (REVENUE, $MILLION)
    TABLE 66. CHINA DEMENTIA DRUGS MARKET, BY DISTRIBUTION CHANNEL, 2021-2031 (REVENUE, $MILLION)
    TABLE 67. JAPAN DEMENTIA DRUGS MARKET, BY INDICATION, 2021-2031 (REVENUE, $MILLION)
    TABLE 68. JAPAN DEMENTIA DRUGS MARKET, BY DRUG CLASS, 2021-2031 (REVENUE, $MILLION)
    TABLE 69. JAPAN DEMENTIA DRUGS MARKET, BY DISTRIBUTION CHANNEL, 2021-2031 (REVENUE, $MILLION)
    TABLE 70. INDIA DEMENTIA DRUGS MARKET, BY INDICATION, 2021-2031 (REVENUE, $MILLION)
    TABLE 71. INDIA DEMENTIA DRUGS MARKET, BY DRUG CLASS, 2021-2031 (REVENUE, $MILLION)
    TABLE 72. INDIA DEMENTIA DRUGS MARKET, BY DISTRIBUTION CHANNEL, 2021-2031 (REVENUE, $MILLION)
    TABLE 73. SOUTH KOREA DEMENTIA DRUGS MARKET, BY INDICATION, 2021-2031 (REVENUE, $MILLION)
    TABLE 74. SOUTH KOREA DEMENTIA DRUGS MARKET, BY DRUG CLASS, 2021-2031 (REVENUE, $MILLION)
    TABLE 75. SOUTH KOREA DEMENTIA DRUGS MARKET, BY DISTRIBUTION CHANNEL, 2021-2031 (REVENUE, $MILLION)
    TABLE 76. AUSTRALIA DEMENTIA DRUGS MARKET, BY INDICATION, 2021-2031 (REVENUE, $MILLION)
    TABLE 77. AUSTRALIA DEMENTIA DRUGS MARKET, BY DRUG CLASS, 2021-2031 (REVENUE, $MILLION)
    TABLE 78. AUSTRALIA DEMENTIA DRUGS MARKET, BY DISTRIBUTION CHANNEL, 2021-2031 (REVENUE, $MILLION)
    TABLE 79. REST OF ASIA-PACIFIC DEMENTIA DRUGS MARKET, BY INDICATION, 2021-2031 (REVENUE, $MILLION)
    TABLE 80. REST OF ASIA-PACIFIC DEMENTIA DRUGS MARKET, BY DRUG CLASS, 2021-2031 (REVENUE, $MILLION)
    TABLE 81. REST OF ASIA-PACIFIC DEMENTIA DRUGS MARKET, BY DISTRIBUTION CHANNEL, 2021-2031 (REVENUE, $MILLION)
    TABLE 82. LAMEA DEMENTIA DRUGS MARKET, BY INDICATION, 2021-2031 (REVENUE, $MILLION)
    TABLE 83. LAMEA DEMENTIA DRUGS MARKET, BY DRUG CLASS, 2021-2031 (REVENUE, $MILLION)
    TABLE 84. LAMEA DEMENTIA DRUGS MARKET, BY DISTRIBUTION CHANNEL, 2021-2031 (REVENUE, $MILLION)
    TABLE 85. LAMEA DEMENTIA DRUGS MARKET, BY COUNTRY, 2021-2031 (REVENUE, $MILLION)
    TABLE 86. BRAZIL DEMENTIA DRUGS MARKET, BY INDICATION, 2021-2031 (REVENUE, $MILLION)
    TABLE 87. BRAZIL DEMENTIA DRUGS MARKET, BY DRUG CLASS, 2021-2031 (REVENUE, $MILLION)
    TABLE 88. BRAZIL DEMENTIA DRUGS MARKET, BY DISTRIBUTION CHANNEL, 2021-2031 (REVENUE, $MILLION)
    TABLE 89. SAUDI ARABIA DEMENTIA DRUGS MARKET, BY INDICATION, 2021-2031 (REVENUE, $MILLION)
    TABLE 90. SAUDI ARABIA DEMENTIA DRUGS MARKET, BY DRUG CLASS, 2021-2031 (REVENUE, $MILLION)
    TABLE 91. SAUDI ARABIA DEMENTIA DRUGS MARKET, BY DISTRIBUTION CHANNEL, 2021-2031 (REVENUE, $MILLION)
    TABLE 92. SOUTH AFRICA DEMENTIA DRUGS MARKET, BY INDICATION, 2021-2031 (REVENUE, $MILLION)
    TABLE 93. SOUTH AFRICA DEMENTIA DRUGS MARKET, BY DRUG CLASS, 2021-2031 (REVENUE, $MILLION)
    TABLE 94. SOUTH AFRICA DEMENTIA DRUGS MARKET, BY DISTRIBUTION CHANNEL, 2021-2031 (REVENUE, $MILLION)
    TABLE 95. REST OF LAMEA DEMENTIA DRUGS MARKET, BY INDICATION, 2021-2031 (REVENUE, $MILLION)
    TABLE 96. REST OF LAMEA DEMENTIA DRUGS MARKET, BY DRUG CLASS, 2021-2031 (REVENUE, $MILLION)
    TABLE 97. REST OF LAMEA DEMENTIA DRUGS MARKET, BY DISTRIBUTION CHANNEL, 2021-2031 (REVENUE, $MILLION)
    TABLE 98.APOTEX INC.: COMPANY SNAPSHOT
    TABLE 99.APOTEX INC.: OPERATING SEGMENTS
    TABLE 100.APOTEX INC.: PRODUCT PORTFOLIO
    TABLE 101.APOTEX INC.: NET SALES
    TABLE 102.APOTEX INC.: KEY STRATERGIES
    TABLE 103.AUROBINDO PHARMA LTD: COMPANY SNAPSHOT
    TABLE 104.AUROBINDO PHARMA LTD: OPERATING SEGMENTS
    TABLE 105.AUROBINDO PHARMA LTD: PRODUCT PORTFOLIO
    TABLE 106.AUROBINDO PHARMA LTD: NET SALES
    TABLE 107.AUROBINDO PHARMA LTD: KEY STRATERGIES
    TABLE 108.BIOGEN IDEC: COMPANY SNAPSHOT
    TABLE 109.BIOGEN IDEC: OPERATING SEGMENTS
    TABLE 110.BIOGEN IDEC: PRODUCT PORTFOLIO
    TABLE 111.BIOGEN IDEC: NET SALES
    TABLE 112.BIOGEN IDEC: KEY STRATERGIES
    TABLE 113.EISAI: COMPANY SNAPSHOT
    TABLE 114.EISAI: OPERATING SEGMENTS
    TABLE 115.EISAI: PRODUCT PORTFOLIO
    TABLE 116.EISAI: NET SALES
    TABLE 117.EISAI: KEY STRATERGIES
    TABLE 118.ELI LILLY AND COMPANY: COMPANY SNAPSHOT
    TABLE 119.ELI LILLY AND COMPANY: OPERATING SEGMENTS
    TABLE 120.ELI LILLY AND COMPANY: PRODUCT PORTFOLIO
    TABLE 121.ELI LILLY AND COMPANY: NET SALES
    TABLE 122.ELI LILLY AND COMPANY: KEY STRATERGIES
    TABLE 123.JOHNSON & JOHNSON: COMPANY SNAPSHOT
    TABLE 124.JOHNSON & JOHNSON: OPERATING SEGMENTS
    TABLE 125.JOHNSON & JOHNSON: PRODUCT PORTFOLIO
    TABLE 126.JOHNSON & JOHNSON: NET SALES
    TABLE 127.JOHNSON & JOHNSON: KEY STRATERGIES
    TABLE 128.ABBVIE INC: COMPANY SNAPSHOT
    TABLE 129.ABBVIE INC: OPERATING SEGMENTS
    TABLE 130.ABBVIE INC: PRODUCT PORTFOLIO
    TABLE 131.ABBVIE INC: NET SALES
    TABLE 132.ABBVIE INC: KEY STRATERGIES
    TABLE 133., F. HOFFMANN-LA ROCHE AG: COMPANY SNAPSHOT
    TABLE 134., F. HOFFMANN-LA ROCHE AG: OPERATING SEGMENTS
    TABLE 135., F. HOFFMANN-LA ROCHE AG: PRODUCT PORTFOLIO
    TABLE 136., F. HOFFMANN-LA ROCHE AG: NET SALES
    TABLE 137., F. HOFFMANN-LA ROCHE AG: KEY STRATERGIES
    TABLE 138.TEVA PHARMACEUTICAL INDUSTRIES: COMPANY SNAPSHOT
    TABLE 139.TEVA PHARMACEUTICAL INDUSTRIES: OPERATING SEGMENTS
    TABLE 140.TEVA PHARMACEUTICAL INDUSTRIES: PRODUCT PORTFOLIO
    TABLE 141.TEVA PHARMACEUTICAL INDUSTRIES: NET SALES
    TABLE 142.TEVA PHARMACEUTICAL INDUSTRIES: KEY STRATERGIES
    TABLE 143.NOVARTIS AG: COMPANY SNAPSHOT
    TABLE 144.NOVARTIS AG: OPERATING SEGMENTS
    TABLE 145.NOVARTIS AG: PRODUCT PORTFOLIO
    TABLE 146.NOVARTIS AG: NET SALES
    TABLE 147.NOVARTIS AG: KEY STRATERGIES
  • LIST OF FIGURES

  • FIGURE 1.DEMENTIA DRUGS MARKET SEGMENTATION
    FIGURE 2.DEMENTIA DRUGS MARKET,2021-2031
    FIGURE 3.DEMENTIA DRUGS MARKET,2021-2031
    FIGURE 4. TOP INVESTMENT POCKETS, BY REGION
    FIGURE 5.PORTER FIVE-1
    FIGURE 6.PORTER FIVE-2
    FIGURE 7.PORTER FIVE-3
    FIGURE 8.PORTER FIVE-4
    FIGURE 9.PORTER FIVE-5
    FIGURE 10.TOP PLAYER POSITIONING
    FIGURE 11.DEMENTIA DRUGS MARKET:DRIVERS, RESTRAINTS AND OPPORTUNITIES
    FIGURE 12.DEMENTIA DRUGS MARKET,BY INDICATION,2021(%)
    FIGURE 13.COMPARATIVE SHARE ANALYSIS OF LEWY BODY DEMENTIA DEMENTIA DRUGS MARKET,2021-2031(%)
    FIGURE 14.COMPARATIVE SHARE ANALYSIS OF PARKINSONS DISEASE DEMENTIA DEMENTIA DRUGS MARKET,2021-2031(%)
    FIGURE 15.COMPARATIVE SHARE ANALYSIS OF ALZHEIMERS DISEASE DEMENTIA DRUGS MARKET,2021-2031(%)
    FIGURE 16.COMPARATIVE SHARE ANALYSIS OF VASCULAR DEMENTIA DEMENTIA DRUGS MARKET,2021-2031(%)
    FIGURE 17.COMPARATIVE SHARE ANALYSIS OF OTHER INDICATIONS DEMENTIA DRUGS MARKET,2021-2031(%)
    FIGURE 18.DEMENTIA DRUGS MARKET,BY DRUG CLASS,2021(%)
    FIGURE 19.COMPARATIVE SHARE ANALYSIS OF CHOLINESTERASE INHIBITORS DEMENTIA DRUGS MARKET,2021-2031(%)
    FIGURE 20.COMPARATIVE SHARE ANALYSIS OF NMDA ANTAGONISTS AND ITS COMBINATION DRUGS DEMENTIA DRUGS MARKET,2021-2031(%)
    FIGURE 21.DEMENTIA DRUGS MARKET,BY DISTRIBUTION CHANNEL,2021(%)
    FIGURE 22.COMPARATIVE SHARE ANALYSIS OF RETAIL PHARMACIES DEMENTIA DRUGS MARKET,2021-2031(%)
    FIGURE 23.COMPARATIVE SHARE ANALYSIS OF HOSPITAL PHARMACIES DEMENTIA DRUGS MARKET,2021-2031(%)
    FIGURE 24.COMPARATIVE SHARE ANALYSIS OF ONLINE PHARMACIES DEMENTIA DRUGS MARKET,2021-2031(%)
    FIGURE 25.DEMENTIA DRUGS MARKET BY REGION,2021
    FIGURE 26.U.S. DEMENTIA DRUGS MARKET,2021-2031($MILLION)
    FIGURE 27.CANADA DEMENTIA DRUGS MARKET,2021-2031($MILLION)
    FIGURE 28.MEXICO DEMENTIA DRUGS MARKET,2021-2031($MILLION)
    FIGURE 29.GERMANY DEMENTIA DRUGS MARKET,2021-2031($MILLION)
    FIGURE 30.FRANCE DEMENTIA DRUGS MARKET,2021-2031($MILLION)
    FIGURE 31.UK DEMENTIA DRUGS MARKET,2021-2031($MILLION)
    FIGURE 32.ITALY DEMENTIA DRUGS MARKET,2021-2031($MILLION)
    FIGURE 33.SPAIN DEMENTIA DRUGS MARKET,2021-2031($MILLION)
    FIGURE 34.REST OF EUROPE DEMENTIA DRUGS MARKET,2021-2031($MILLION)
    FIGURE 35.CHINA DEMENTIA DRUGS MARKET,2021-2031($MILLION)
    FIGURE 36.JAPAN DEMENTIA DRUGS MARKET,2021-2031($MILLION)
    FIGURE 37.INDIA DEMENTIA DRUGS MARKET,2021-2031($MILLION)
    FIGURE 38.SOUTH KOREA DEMENTIA DRUGS MARKET,2021-2031($MILLION)
    FIGURE 39.AUSTRALIA DEMENTIA DRUGS MARKET,2021-2031($MILLION)
    FIGURE 40.REST OF ASIA-PACIFIC DEMENTIA DRUGS MARKET,2021-2031($MILLION)
    FIGURE 41.BRAZIL DEMENTIA DRUGS MARKET,2021-2031($MILLION)
    FIGURE 42.SAUDI ARABIA DEMENTIA DRUGS MARKET,2021-2031($MILLION)
    FIGURE 43.SOUTH AFRICA DEMENTIA DRUGS MARKET,2021-2031($MILLION)
    FIGURE 44.REST OF LAMEA DEMENTIA DRUGS MARKET,2021-2031($MILLION)
    FIGURE 45. TOP WINNING STRATEGIES, BY YEAR
    FIGURE 46. TOP WINNING STRATEGIES, BY DEVELOPMENT
    FIGURE 47. TOP WINNING STRATEGIES, BY COMPANY
    FIGURE 48.PRODUCT MAPPING OF TOP 10 PLAYERS
    FIGURE 49.COMPETITIVE DASHBOARD
    FIGURE 50.COMPETITIVE HEATMAP OF TOP 10 KEY PLAYERS
    FIGURE 51.APOTEX INC..: NET SALES ($MILLION)
    FIGURE 52.AUROBINDO PHARMA LTD.: NET SALES ($MILLION)
    FIGURE 53.BIOGEN IDEC.: NET SALES ($MILLION)
    FIGURE 54.EISAI.: NET SALES ($MILLION)
    FIGURE 55.ELI LILLY AND COMPANY.: NET SALES ($MILLION)
    FIGURE 56.JOHNSON & JOHNSON.: NET SALES ($MILLION)
    FIGURE 57.ABBVIE INC.: NET SALES ($MILLION)
    FIGURE 58., F. HOFFMANN-LA ROCHE AG.: NET SALES ($MILLION)
    FIGURE 59.TEVA PHARMACEUTICAL INDUSTRIES.: NET SALES ($MILLION)
    FIGURE 60.NOVARTIS AG.: NET SALES ($MILLION)


This section provides the opinions of the top level CXOs in the dementia drugs market. According to the CXOs, dementia is a neurologic disorder that causes infection to the brain.

As per the CXOs, the pharmaceutical industry is undertaking rapid and exceptional measures to bring more innovative products for patients and has opened new approaches in the pharmaceutical industry. According to National Plan of Alzheimer’s Disease, in 2021, it has launched National Alzheimer’s Project Act. This act has an aim to prevent and treat the Alzheimer’s Disease and related Dementias by 2025, enhance public awareness and engagement, and accelerate action to promote healthy aging and reduce risk factors for Alzheimer’s disease. Thus, rise in number of initiatives taken by private organization for the management of dementia significantly drives the growth of the market.

The CXOs further added that the Alzheimer’s disease segment holds the largest share in the market owing to increase in life expectancy, rise in ageing population, and changes in lifestyle. In addition, the cholinesterase inhibitors segment holds the largest share in the market, owing to strong availability of the dementia drugs among large number of key players in the market. Moreover, North America is expected to offer lucrative opportunities to the market during the forecast period, owing to rise in geriatric population in the region, which led to increase in the demand for dementia drugs across the region. However, Asia-Pacific registered the fastest growth rate during the forecast period, owing to developments in healthcare infrastructure, rise in disposable incomes, and well-established presence of domestic companies in the region.

PURCHASE OPTIONS

Call or Email us

U.S.-Canada Toll-free: +1-800-792-5285
Int'l : +1-503-894-6022
Europe : +44-845-528-1300
Email : help@alliedmarketresearch.com
 
FREQUENTLY ASKED QUESTIONS?

A. The forecast period for dementia drugs market is 2022 to 2031

A. The total market value of dementia drugs market is $8662.17 million in 2021.

A. increase in the prevalence of Alzheimer’s disease, advancement in R&D activities for drug development, and rise in adoption of early diagnosis propel the growth of the market

A. North America is the largest regional market for Global Dementia Drugs.

A. Top companies such as Abbvie Inc., Eli Lilly and Company, F. Hoffmann-La Roche Ltd., Johnson & Johnson, Novartis Ag and Teva Pharmaceuticals. held a high market position in 2021.

Looking for Customization?

 Customization Request

Have a Question?

 Speak with Analyst

Any Confusion?

 Inquire Before Buying

Have a glance of the Report

  Request Sample
RELATED TAGS

Purchase Full Report of
Dementia Drugs Market

Start reading instantly.
This Report and over 67,404+ more Reports, Available with Avenue Library. T&C*.

  • Online Only
  • $3,570
  • Online cloud access only
  • Restricted print, copy, paste & download
  • Read only
  • Free industry update
    (Within 180 days)
  • Free report update in next update cycle
    (Oct 2023 - Oct 2024)
  • Data Pack
  • $3,840
  • Restricted to one authorized user
  • One print only
  • Available in
    Excel
  • Free industry update
    (Within 180 days)
  •   Free report update in next update cycle
    (Oct 2023 - Oct 2024)
  • Single User
  • $5,730
  • Restricted to one authorized user
  • One print only
  • Available in
    PDF
  • Free industry update
    (Within 180 days)
  •   Free report update in next update cycle
    (Oct 2023 - Oct 2024)
  • Five Users
  • $6,450
  • Limited to five authorized users
  • Print upto five copies
  • Available in
    PDF
  • Free industry update
    (Within 180 days)
  •   Free report update in next update cycle
    (Oct 2023 - Oct 2024)
  • Enterprise
    License/PDF

  • $9,600
  • Unlimited
    within
    company/enterprise
  • Available in Excel & PDF
  • Free industry update
    (Within 180 days)
  •   Free report update in next update cycle
    (Oct 2023 - Oct 2024)
  • Library
    Membership

  • $999 $ 1,175
    Per User/ Per month/ Billed annually
  • Published Content
    E-access
  • Company Profiles
    E-access
  • Newly Added Content Access
  • 10 PDF
    Downloads
  • 5 Excel Data
    Pack Downloads
  • 250 Company Profiles PDF Downloads
  • Buy Now

*Taxes/Fees, if applicable will be added during checkout. All prices in USD

RELATED REPORTS
 

Why Allied Market Research?


Infallible Methodology

To ensure high-level data integrity, accurate analysis, and impeccable forecasts

Analyst Support

For complete satisfaction

Customization

On-demand customization of scope of the report to exactly meet your needs

TARGETED MARKET VIEW

Targeted market view to provide pertinent information and save time of readers

Get fresh content delivered

Get insights on topics that are crucial for your business. Stay abreast of your interest areas.

Get Industry Data Alerts

Why Allied Market Research?

Infallible Methodology

To ensure high-level data integrity, accurate analysis, and impeccable forecasts

Analyst Support

For complete satisfaction

Customization

On-demand customization of scope of the report to exactly meet your needs

TARGETED MARKET VIEW

Targeted market view to provide pertinent information and save time of readers