0
New
New
2023
Desiccant Market

Desiccant Market

by Type (Silica Gel, Activated Alumina, Activated Charcoal, Zeolite, Calcium Chloride, Clay, Others), by End-use industries (Packaging, Food, Pharmaceutical, Electronics, Others): Global Opportunity Analysis and Industry Forecast, 2023-2032

Report Code: A11600
Aug 2023 | Pages: 327
Tables: 170
Charts: 65
  • Formats*:

  • pdf

    Single User License, Five User
    License & Enterprise User License

  • xls

    Data Pack Excel License

  • ppt

    It comes with the additional cost
    of $2500.00 contact sales.


Desiccant Market Research, 2032

The global desiccant market was valued at $1.1 billion in 2022 and is projected to reach $1.8 billion by 2032, growing at a CAGR of 5.1% from 2023 to 2032.

Report Key Highlighters:

  • The desiccant market study covers 20 countries. The research includes a segment analysis of each country in terms of both value ($million) and volume (kilotons) for the projected period 2023-2032.
  • The study integrated high-quality data, professional opinions and analysis, and critical independent perspectives. The research approach is intended to provide a balanced view of global markets and to assist stakeholders in making educated decisions in order to achieve their most ambitious growth objectives.
  • Over 3,700 product literature, annual reports, industry statements, and other comparable materials from major industry participants were reviewed to gain a better understanding of the market.
  • The desiccant market is highly fragmented, with several players including Fuji Silysia Chemical Ltd., Hengye, Inc., TROPACK Packmitel GmbH, CLARIANT, Capitol Scientific, Inc. Multisorb, OKER-CHEMIE, Evonik Industries AG, Desicca Chemical Pvt. Ltd., and W. R. Grace & Co.-Conn.
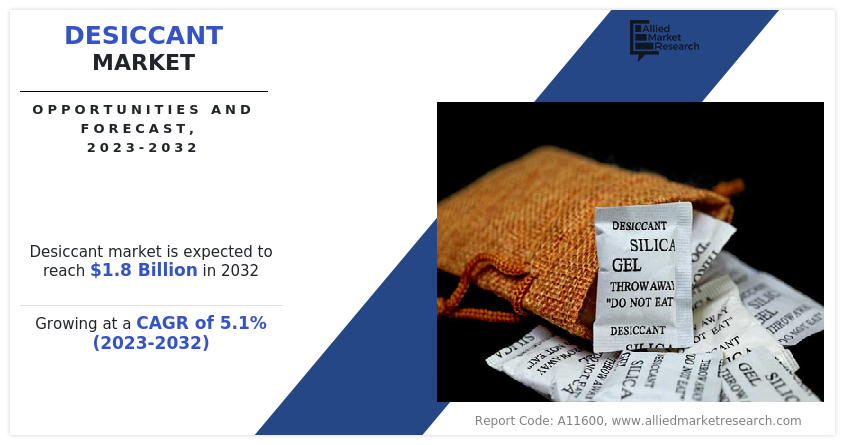
The increasing demand for desiccants, such as silica gel and molecular sieves, is driven by various industries. Desiccants are crucial for moisture control in products like electronics, pharmaceuticals, and food packaging. Additionally, they play a vital role in preventing corrosion and maintaining product quality during storage and transportation. As these industries grow and emphasize product preservation, the demand for desiccants continues to rise steadily.

Desiccant Market

"Desiccants" are products or materials that are hygroscopic. Desiccants absorb moisture from the surrounding environment. By absorbing moisture, they reduce humidity and aid in preventing the damage that moisture causes to products. Physical absorption is the process whereby desiccants absorb moisture and trap it within surfaces or capillaries without modifying the properties of the water. However, certain desiccants absorb moisture and generate a new substance through a chemical reaction with it. This is referred to as chemical assimilation. Chemical absorption is irreversible, whereas physical absorption of moisture is reversible. Desiccants such as zeolites, silica gel, and others absorb moisture physically, while magnesium sulfate, calcium chloride, and others absorb moisture chemically.

Desiccants play a crucial role in the shipment of food and pharmaceuticals by absorbing moisture and maintaining a controlled atmosphere in order to preserve product quality during transport. Desiccants are used in the production of insulated windows to prevent moisture condensation on the panes. As drying components, air conditioning systems use desiccants such as zeolites to preserve the efficacy of the refrigerant. Zeolites are used as dehydrating agents in the Grignard reaction, which requires the removal of water from solvents.

Increasing demand for desiccants from the food industry will drive the growth of the market.

In the food industry, desiccants are employed to reduce moisture-related concerns that could lead to spoilage, degradation of taste, texture, and nutritional value, as well as the growth of harmful microorganisms. This is particularly crucial in products such as cereals, snacks, and dried fruits. In addition, the increase in demand for packaged and processed foods, coupled with the globalization of the food supply chain, illustrates the need for effective moisture control to prolong shelf life and prevent economic losses.

Many foods and supplements contain desiccant to prevent clumping, allowing easier packaging, shipping, flow-ability, and eventual consumption. India’s food processing sector stood at $393.41 million in 2020-21, which is expected to reach $ 470 billion by 2025. Moreover, the total agricultural and allied products exports stood at $41.25 billion in FY21. As the food industry is expanding, the demand for desiccants is expected to rise, thus driving the growth of the desiccant market during the forecast period.

Increase in demand for desiccants from the pharmaceutical industry

The pharmaceutical industry is witnessing a substantial surge in demand for desiccants, driven by their pivotal role in maintaining the quality and efficacy of pharmaceutical products. Desiccants are crucial in preventing moisture-related damage to medicines, vaccines, and medical devices, which are highly sensitive to even slight fluctuations in humidity. As pharmaceutical products often undergo long journeys through various climatic conditions, the risk of degradation due to moisture absorption remains a significant concern. Desiccants help to counteract this risk by effectively absorbing excess moisture and maintaining the stability and integrity of the products.

Moreover, advancements in pharmaceutical R&D have led to the production of more intricate and delicate medications, many of which are prone to deterioration when exposed to moisture. As precision and efficacy become paramount in drug formulations, the demand for enhanced moisture control solutions intensifies. This has prompted pharmaceutical manufacturers to prioritize the integration of desiccant technologies into their packaging and storage processes to ensure the longevity and effectiveness of their products. According to the National Bureau of Statistics, in 2021, China’s pharmaceutical industry’s value-added increased by 24.8% over the previous year.

Furthermore, according to the India Brand Equity Foundation (IBEF), in 2021, India’s pharmaceutical industry was worth $42 billion. It is expected to grow to $65 billion by 2024 and to more than $120 billion by 2030. The pharmaceutical industry in India is currently valued at $41 billion. The growth of the pharmaceutical industry coupled with investments such as the Production Link Incentive (PLI) scheme in India by the Government of India for enhancing India’s manufacturing capabilities and enhancing exports is driving the desiccant market in the Asia-Pacific region. These initiatives by the government and the growing concern for health are contributing to the growth of the desiccant market in the Asia-Pacific region.

In addition to safeguarding product quality, regulatory standards, and compliance play a critical role in driving the demand for desiccants in the pharmaceutical sector. Thus, the expanding pharmaceutical sector with its increasing demand for desiccant is expected to drive the growth of the desiccant market during the forecast period.

Chemical absorption is more effective than physical absorption. However, chemical absorption is significantly more expensive than physical absorption desiccants, which is precisely why physical absorption desiccants are currently in greater demand in the market, owing to which there is a significant market demand for desiccants such as silica gel and zeolites. While handling desiccants, care must be taken to avoid contact with the human body, as desiccants absorb water and may produce adverse effects. Therefore, particular packing materials must be used to ensure the safety of desiccants. However, high investment costs for the installation of machinery and high maintenance costs are major restraints of the desiccant market.

Furthermore, due to the rise in global population and disposable income, the electronic industry is undergoing a period of rapid expansion. According to Statista, revenue in the consumer electronics market amounts to $1,028.0 Bn in 2023. The downsizing of electronic components and packaging is a progressive process. Sensitive electronic equipment must be handled carefully during transportation and storage. Even the smallest amount of moisture or humidity can cause irreparable harm to electronic devices. If the equipment is costly to purchase and produce, this leads to substantial losses. As a result, producers in the electronic industry are exerting significant effort to minimize the effect of moisture on their products. This factor is anticipated to offer a lucrative opportunity for the desiccant market.

The desiccant market is segmented into type, end-use industry, and region. Depending on the type, the market is divided into silica gel, activated alumina, activated charcoal, zeolite, calcium chloride, clay, and others. On the basis of the end-use industry, it is categorized into packaging, food, pharmaceutical, electronics, and others. Region-wise, the market is studied across North America, Europe, Asia-Pacific, And LAMEA.
The major players operating in the global desiccant market are Fuji Silysia Chemical Ltd., Hengye, Inc., TROPACK Packmitel GmbH, CLARIANT, Capitol Scientific, Inc. Multisorb, OKER-CHEMIE, Evonik Industries AG, Desicca Chemical Pvt. Ltd., and W. R. Grace & Co.-Conn. Other players include Porocel Corporation, The Dow Chemical Company, INEOS Corporation, Qingdao Makll Group, Zeotec Adsorbents Private Limited,AGM Container Controls, Delta Adsorbents, and others.

Desiccant Market

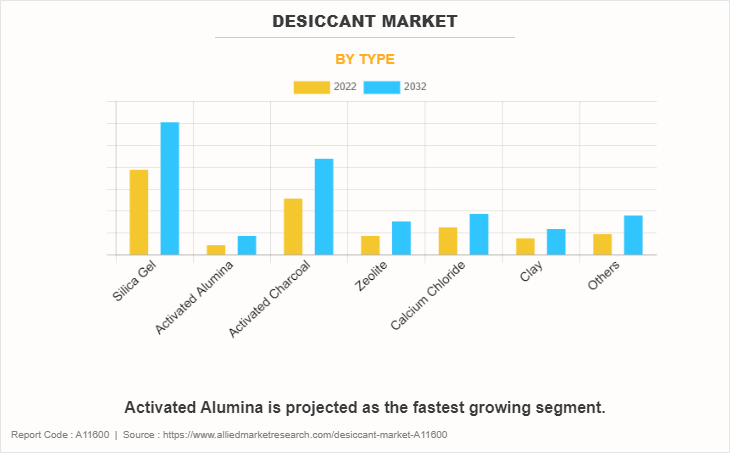
On the basis of type, the silica gel segment held the highest market share in 2022, accounting for more than one-third of the global desiccant market revenue. Silica gel serves as a desiccant due to its high surface area and strong affinity for water molecules. Its porous structure absorbs moisture, making it a reliable choice for preserving dryness in various applications, such as food packaging, electronics, and pharmaceuticals.

The activated alumina segment is the fastest-growing segment with a CAGR of 7.3%. Activated alumina is a widely used desiccant due to its high surface area, porous structure, and strong water adsorption capabilities. It's employed in drying gases and liquids, purifying industrial processes, and removing moisture in compressed air systems, making it essential for various industrial applications.
Desiccant Market

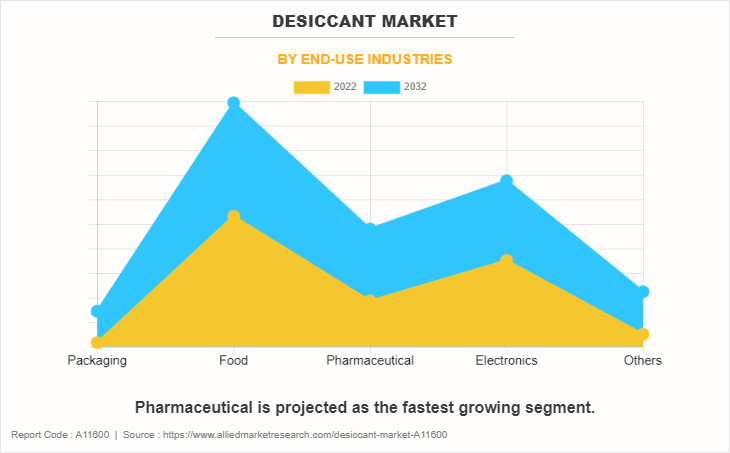
On the basis of the end-use industry, the food segment held the highest market share in 2022, accounting for more than one-third of the global Desiccant market revenue. Desiccants are vital in the food industry to maintain product quality and safety. They absorb moisture, preventing spoilage, mold growth, and clumping in products like spices, dried fruits, and packaged goods. Desiccants also extend shelf life, enhance flavor, and prevent caking, ensuring food products remain fresh and palatable.

The pharmaceutical industry is the fastest-growing industry with a CAGR of 5.8%. Desiccants play a crucial role in the pharmaceutical industry by absorbing moisture and maintaining product stability. They are used in packaging to prevent the degradation of sensitive drugs, extend shelf life, and maintain efficacy. Desiccants also help prevent mold growth, ensuring the safety and quality of pharmaceutical products.
Desiccant Market

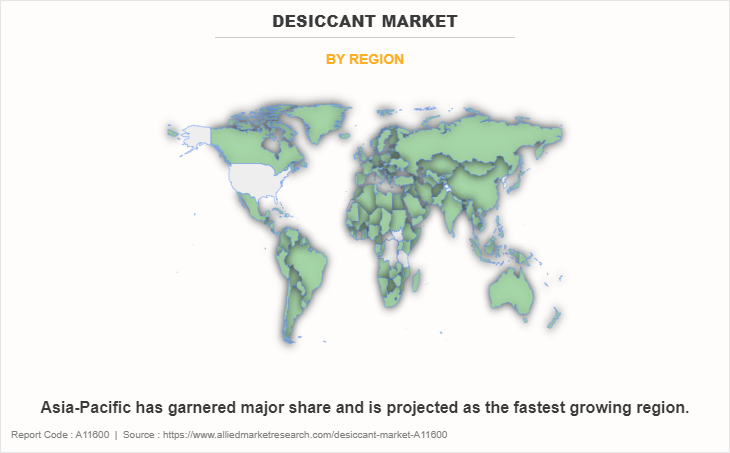
Based on region, Asia-Pacific held the highest market share in terms of revenue in 2022, accounting for nearly two-fifths of the global Desiccant market revenue The Asia-Pacific desiccant market is being driven by the expansion of the pharmaceutical industry in countries such as China, India, and Japan. India's pharmaceutical industry is presently worth $41 billion. The Asia-Pacific desiccant market is being driven by the expansion of the pharmaceutical industry as well as government investments such as the Production Link Incentive (PLI) scheme in India, which aims to improve exports and manufacturing capabilities in the country. The desiccant market in the Asia-Pacific region is expanding as a result of these government initiatives and the increased concern about health.

Public Policies:

  • Desiccants used in the pharmaceutical and food industries must adhere to regulations set forth by the U.S. Food and Drug Administration (FDA). These regulations ensure that desiccants do not contaminate the products they are intended to protect and that they maintain the safety and quality of medications and food items.
  • Desiccant manufacturers need to comply with environmental regulations enforced by the Environmental Protection Agency (EPA) Guidelines. This includes considerations related to the materials used in desiccants, waste disposal, and potential impacts on air and water quality.
  • U.S. Pharmacopeia / National Formulary (USP/NF) Monograph for Silicon Dioxide.
  • U.S. 21 CFR 172 food additives permitted for direct addition to food for human consumption.
  • Hazardous substance requirements under European Regulation (EC) 1272/2008 on classifications, labeling, and packaging of substances and mixtures (REACH).
  • European Regulation (EC) 1935/2004 and its amendments to materials and articles intended to come into contact with food.
  • European Regulation (EC) 2023/2006 on good manufacturing practices for materials and articles intended to come into contact with food.
  • European Directive 76/768/EEC and its amendments (listed as coloring agent 77004 in Annex IV Part 1), allow for use in cosmetic products with no restrictions.
  • REACH Regulation (EC) 1907/2006 aims to assess and manage potential risks associated with desiccant substances while promoting their safe use.
  • Under REACH regulations, desiccants such as silica gel sachets and calcium chloride sachets are considered substances within an article (the sachet). This means that the contents of the sachet must be registered under REACH.

Russia-Ukraine War Impact Analysis:

The Russia-Ukraine war can potentially impact the desiccant market in several ways. The conflict may disrupt the supply chains of desiccant manufacturers and raw material suppliers located in the region, leading to potential shortages and price fluctuations. With pharmaceuticals and other essential goods being transported to affected areas, there could be an increased demand for desiccants in packaging to protect products from moisture-related damage. Furthermore, the political instability and trade tensions resulting from the conflict can affect international trade, potentially impacting the desiccant market's global distribution and pricing. Moreover, the currency devaluation and economic instability in the region can affect the cost of imports and exports, influencing desiccant prices. Overall, the impact on the desiccant market will depend on the duration and severity of the conflict and its consequences on regional and global trade dynamics.

Key Benefits For Stakeholders

  • This report provides a quantitative analysis of the market segments, current trends, estimations, and dynamics of the desiccant market analysis from 2022 to 2032 to identify the prevailing desiccant market opportunities.
  • The market research is offered along with information related to key drivers, restraints, and opportunities.
  • Porter's five forces analysis highlights the potency of buyers and suppliers to enable stakeholders make profit-oriented business decisions and strengthen their supplier-buyer network.
  • In-depth analysis of the desiccant market segmentation assists to determine the prevailing market opportunities.
  • Major countries in each region are mapped according to their revenue contribution to the global market.
  • Market player positioning facilitates benchmarking and provides a clear understanding of the present position of the market players.
  • The report includes the analysis of the regional as well as global desiccant market trends, key players, market segments, application areas, and market growth strategies.

Desiccant Market Report Highlights

Aspects Details
Market Size By 2032 USD 1.8 billion
Growth Rate CAGR of 5.1%
Forecast period 2022 - 2032
Report Pages 327
By Type
  • Silica Gel
  • Activated Alumina
  • Activated Charcoal
  • Zeolite
  • Calcium Chloride
  • Clay
  • Others
By End-use industries
  • Packaging
  • Food
  • Pharmaceutical
  • Electronics
  • Others
By Region
  • North America  (U.S., Canada, Mexico)
  • Europe  (Germany, France, UK, Spain, Italy, Rest of Europe)
  • Asia-Pacific  (China, Japan, India, South Korea, Australia, Rest of Asia-Pacific)
  • LAMEA  (Brazil, Saudi Arabia, South Africa, Rest of LAMEA)
Key Market Players Multisorb, Fuji Silysia Chemical Ltd., OKER-CHEMIE, W. R. Grace & Co.-Conn., Capitol Scientific, Inc., Evonik Industries AG, Desicca Chemical Pvt. Ltd., CLARIANT, Hengye, Inc., TROPACK Packmitel GmbH

Analyst Review

According to the insights of the CXOs of leading companies, the growing demand for desiccants across industries such as pharmaceuticals, electronics, and food preservation, plays a crucial role in maintaining product quality by reducing moisture levels. The expansion of these industries, coupled with increasing awareness about the detrimental effects of moisture on sensitive goods, fuels the market growth. In addition, the increase in e-commerce and international trade increases the demand for effective moisture control during storage and transportation, thereby driving the expansion of the desiccant market during the forecast period. However, the environmental concerns surrounding traditional desiccants, often made of non-biodegradable materials, raise sustainability issues. This has led to rise in demand for eco-friendly alternatives. Moreover, pricing fluctuations of raw materials used in desiccant production can hamper the growth of the desiccant market.

The CXO further added that with the growing global focus on environmental responsibility, there is a growing need for biodegradable and reusable desiccants. Manufacturers can participate by developing eco-friendly options that align with consumer values and contribute to a greener future. This will offer a lucrative opportunity for the desiccant market.


  • CHAPTER 1: INTRODUCTION

    • 1.1. Report description

    • 1.2. Key market segments

    • 1.3. Key benefits to the stakeholders

    • 1.4. Research Methodology

      • 1.4.1. Primary research

      • 1.4.2. Secondary research

      • 1.4.3. Analyst tools and models

  • CHAPTER 2: EXECUTIVE SUMMARY

    • 2.1. CXO Perspective

  • CHAPTER 3: MARKET OVERVIEW

    • 3.1. Market definition and scope

    • 3.2. Key findings

      • 3.2.1. Top impacting factors

      • 3.2.2. Top investment pockets

    • 3.3. Porter’s five forces analysis

      • 3.3.1. Moderate bargaining power of suppliers

      • 3.3.2. Moderate threat of new entrants

      • 3.3.3. Moderate threat of substitutes

      • 3.3.4. High intensity of rivalry

      • 3.3.5. High bargaining power of buyers

    • 3.4. Market dynamics

      • 3.4.1. Drivers

        • 3.4.1.1. Increase in demand for desiccants from the pharmaceutical industry
        • 3.4.1.2. Increase in Demand for Activated Alumina from the Oil and Gas Industry
      • 3.4.2. Restraints

        • 3.4.2.1. High investment costs
      • 3.4.3. Opportunities

        • 3.4.3.1. Increase in the use of desiccant in the chemical sector and air conditioning system
    • 3.5. Market Share Analysis

    • 3.6. Value Chain Analysis

    • 3.7. Pricing Analysis

    • 3.8. Patent Landscape

  • CHAPTER 4: DESICCANT MARKET, BY TYPE

    • 4.1. Overview

      • 4.1.1. Market size and forecast

    • 4.2. Silica Gel

      • 4.2.1. Key market trends, growth factors and opportunities

      • 4.2.2. Market size and forecast, by region

      • 4.2.3. Market share analysis by country

    • 4.3. Activated Alumina

      • 4.3.1. Key market trends, growth factors and opportunities

      • 4.3.2. Market size and forecast, by region

      • 4.3.3. Market share analysis by country

    • 4.4. Activated Charcoal

      • 4.4.1. Key market trends, growth factors and opportunities

      • 4.4.2. Market size and forecast, by region

      • 4.4.3. Market share analysis by country

    • 4.5. Zeolite

      • 4.5.1. Key market trends, growth factors and opportunities

      • 4.5.2. Market size and forecast, by region

      • 4.5.3. Market share analysis by country

    • 4.6. Calcium Chloride

      • 4.6.1. Key market trends, growth factors and opportunities

      • 4.6.2. Market size and forecast, by region

      • 4.6.3. Market share analysis by country

    • 4.7. Clay

      • 4.7.1. Key market trends, growth factors and opportunities

      • 4.7.2. Market size and forecast, by region

      • 4.7.3. Market share analysis by country

    • 4.8. Others

      • 4.8.1. Key market trends, growth factors and opportunities

      • 4.8.2. Market size and forecast, by region

      • 4.8.3. Market share analysis by country

  • CHAPTER 5: DESICCANT MARKET, BY END-USE INDUSTRIES

    • 5.1. Overview

      • 5.1.1. Market size and forecast

    • 5.2. Packaging

      • 5.2.1. Key market trends, growth factors and opportunities

      • 5.2.2. Market size and forecast, by region

      • 5.2.3. Market share analysis by country

    • 5.3. Food

      • 5.3.1. Key market trends, growth factors and opportunities

      • 5.3.2. Market size and forecast, by region

      • 5.3.3. Market share analysis by country

    • 5.4. Pharmaceutical

      • 5.4.1. Key market trends, growth factors and opportunities

      • 5.4.2. Market size and forecast, by region

      • 5.4.3. Market share analysis by country

    • 5.5. Electronics

      • 5.5.1. Key market trends, growth factors and opportunities

      • 5.5.2. Market size and forecast, by region

      • 5.5.3. Market share analysis by country

    • 5.6. Others

      • 5.6.1. Key market trends, growth factors and opportunities

      • 5.6.2. Market size and forecast, by region

      • 5.6.3. Market share analysis by country

  • CHAPTER 6: DESICCANT MARKET, BY REGION

    • 6.1. Overview

      • 6.1.1. Market size and forecast By Region

    • 6.2. North America

      • 6.2.1. Key market trends, growth factors and opportunities

      • 6.2.2. Market size and forecast, by Type

      • 6.2.3. Market size and forecast, by End-use industries

      • 6.2.4. Market size and forecast, by country

        • 6.2.4.1. U.S.
          • 6.2.4.1.1. Market size and forecast, by Type
          • 6.2.4.1.2. Market size and forecast, by End-use industries
        • 6.2.4.2. Canada
          • 6.2.4.2.1. Market size and forecast, by Type
          • 6.2.4.2.2. Market size and forecast, by End-use industries
        • 6.2.4.3. Mexico
          • 6.2.4.3.1. Market size and forecast, by Type
          • 6.2.4.3.2. Market size and forecast, by End-use industries
    • 6.3. Europe

      • 6.3.1. Key market trends, growth factors and opportunities

      • 6.3.2. Market size and forecast, by Type

      • 6.3.3. Market size and forecast, by End-use industries

      • 6.3.4. Market size and forecast, by country

        • 6.3.4.1. Germany
          • 6.3.4.1.1. Market size and forecast, by Type
          • 6.3.4.1.2. Market size and forecast, by End-use industries
        • 6.3.4.2. France
          • 6.3.4.2.1. Market size and forecast, by Type
          • 6.3.4.2.2. Market size and forecast, by End-use industries
        • 6.3.4.3. UK
          • 6.3.4.3.1. Market size and forecast, by Type
          • 6.3.4.3.2. Market size and forecast, by End-use industries
        • 6.3.4.4. Spain
          • 6.3.4.4.1. Market size and forecast, by Type
          • 6.3.4.4.2. Market size and forecast, by End-use industries
        • 6.3.4.5. Italy
          • 6.3.4.5.1. Market size and forecast, by Type
          • 6.3.4.5.2. Market size and forecast, by End-use industries
        • 6.3.4.6. Rest of Europe
          • 6.3.4.6.1. Market size and forecast, by Type
          • 6.3.4.6.2. Market size and forecast, by End-use industries
    • 6.4. Asia-Pacific

      • 6.4.1. Key market trends, growth factors and opportunities

      • 6.4.2. Market size and forecast, by Type

      • 6.4.3. Market size and forecast, by End-use industries

      • 6.4.4. Market size and forecast, by country

        • 6.4.4.1. China
          • 6.4.4.1.1. Market size and forecast, by Type
          • 6.4.4.1.2. Market size and forecast, by End-use industries
        • 6.4.4.2. Japan
          • 6.4.4.2.1. Market size and forecast, by Type
          • 6.4.4.2.2. Market size and forecast, by End-use industries
        • 6.4.4.3. India
          • 6.4.4.3.1. Market size and forecast, by Type
          • 6.4.4.3.2. Market size and forecast, by End-use industries
        • 6.4.4.4. South Korea
          • 6.4.4.4.1. Market size and forecast, by Type
          • 6.4.4.4.2. Market size and forecast, by End-use industries
        • 6.4.4.5. Australia
          • 6.4.4.5.1. Market size and forecast, by Type
          • 6.4.4.5.2. Market size and forecast, by End-use industries
        • 6.4.4.6. Rest of Asia-Pacific
          • 6.4.4.6.1. Market size and forecast, by Type
          • 6.4.4.6.2. Market size and forecast, by End-use industries
    • 6.5. LAMEA

      • 6.5.1. Key market trends, growth factors and opportunities

      • 6.5.2. Market size and forecast, by Type

      • 6.5.3. Market size and forecast, by End-use industries

      • 6.5.4. Market size and forecast, by country

        • 6.5.4.1. Brazil
          • 6.5.4.1.1. Market size and forecast, by Type
          • 6.5.4.1.2. Market size and forecast, by End-use industries
        • 6.5.4.2. Saudi Arabia
          • 6.5.4.2.1. Market size and forecast, by Type
          • 6.5.4.2.2. Market size and forecast, by End-use industries
        • 6.5.4.3. South Africa
          • 6.5.4.3.1. Market size and forecast, by Type
          • 6.5.4.3.2. Market size and forecast, by End-use industries
        • 6.5.4.4. Rest of LAMEA
          • 6.5.4.4.1. Market size and forecast, by Type
          • 6.5.4.4.2. Market size and forecast, by End-use industries
  • CHAPTER 7: COMPETITIVE LANDSCAPE

    • 7.1. Introduction

    • 7.2. Top winning strategies

    • 7.3. Product Mapping of Top 10 Player

    • 7.4. Competitive Dashboard

    • 7.5. Competitive Heatmap

    • 7.6. Top player positioning, 2022

  • CHAPTER 8: COMPANY PROFILES

    • 8.1. Fuji Silysia Chemical Ltd.

      • 8.1.1. Company overview

      • 8.1.2. Key Executives

      • 8.1.3. Company snapshot

      • 8.1.4. Operating business segments

      • 8.1.5. Product portfolio

    • 8.2. Desicca Chemical Pvt. Ltd.

      • 8.2.1. Company overview

      • 8.2.2. Key Executives

      • 8.2.3. Company snapshot

      • 8.2.4. Operating business segments

      • 8.2.5. Product portfolio

    • 8.3. TROPACK Packmitel GmbH

      • 8.3.1. Company overview

      • 8.3.2. Key Executives

      • 8.3.3. Company snapshot

      • 8.3.4. Operating business segments

      • 8.3.5. Product portfolio

    • 8.4. OKER-CHEMIE

      • 8.4.1. Company overview

      • 8.4.2. Key Executives

      • 8.4.3. Company snapshot

      • 8.4.4. Operating business segments

      • 8.4.5. Product portfolio

    • 8.5. Hengye, Inc.

      • 8.5.1. Company overview

      • 8.5.2. Key Executives

      • 8.5.3. Company snapshot

      • 8.5.4. Operating business segments

      • 8.5.5. Product portfolio

    • 8.6. Multisorb

      • 8.6.1. Company overview

      • 8.6.2. Key Executives

      • 8.6.3. Company snapshot

      • 8.6.4. Operating business segments

      • 8.6.5. Product portfolio

    • 8.7. CLARIANT

      • 8.7.1. Company overview

      • 8.7.2. Key Executives

      • 8.7.3. Company snapshot

      • 8.7.4. Operating business segments

      • 8.7.5. Product portfolio

      • 8.7.6. Business performance

    • 8.8. Capitol Scientific, Inc.

      • 8.8.1. Company overview

      • 8.8.2. Key Executives

      • 8.8.3. Company snapshot

      • 8.8.4. Operating business segments

      • 8.8.5. Product portfolio

    • 8.9. W. R. Grace & Co.-Conn.

      • 8.9.1. Company overview

      • 8.9.2. Key Executives

      • 8.9.3. Company snapshot

      • 8.9.4. Operating business segments

      • 8.9.5. Product portfolio

      • 8.9.6. Business performance

    • 8.10. Evonik Industries AG

      • 8.10.1. Company overview

      • 8.10.2. Key Executives

      • 8.10.3. Company snapshot

      • 8.10.4. Operating business segments

      • 8.10.5. Product portfolio

      • 8.10.6. Business performance

  • LIST OF TABLES

  • TABLE 01. GLOBAL DESICCANT MARKET, BY TYPE, 2022-2032 ($MILLION)
    TABLE 02. GLOBAL DESICCANT MARKET, BY TYPE, 2022-2032 (KILOTON)
    TABLE 03. DESICCANT MARKET FOR SILICA GEL, BY REGION, 2022-2032 ($MILLION)
    TABLE 04. DESICCANT MARKET FOR SILICA GEL, BY REGION, 2022-2032 (KILOTON)
    TABLE 05. DESICCANT MARKET FOR ACTIVATED ALUMINA, BY REGION, 2022-2032 ($MILLION)
    TABLE 06. DESICCANT MARKET FOR ACTIVATED ALUMINA, BY REGION, 2022-2032 (KILOTON)
    TABLE 07. DESICCANT MARKET FOR ACTIVATED CHARCOAL, BY REGION, 2022-2032 ($MILLION)
    TABLE 08. DESICCANT MARKET FOR ACTIVATED CHARCOAL, BY REGION, 2022-2032 (KILOTON)
    TABLE 09. DESICCANT MARKET FOR ZEOLITE, BY REGION, 2022-2032 ($MILLION)
    TABLE 10. DESICCANT MARKET FOR ZEOLITE, BY REGION, 2022-2032 (KILOTON)
    TABLE 11. DESICCANT MARKET FOR CALCIUM CHLORIDE, BY REGION, 2022-2032 ($MILLION)
    TABLE 12. DESICCANT MARKET FOR CALCIUM CHLORIDE, BY REGION, 2022-2032 (KILOTON)
    TABLE 13. DESICCANT MARKET FOR CLAY, BY REGION, 2022-2032 ($MILLION)
    TABLE 14. DESICCANT MARKET FOR CLAY, BY REGION, 2022-2032 (KILOTON)
    TABLE 15. DESICCANT MARKET FOR OTHERS, BY REGION, 2022-2032 ($MILLION)
    TABLE 16. DESICCANT MARKET FOR OTHERS, BY REGION, 2022-2032 (KILOTON)
    TABLE 17. GLOBAL DESICCANT MARKET, BY END-USE INDUSTRIES, 2022-2032 ($MILLION)
    TABLE 18. GLOBAL DESICCANT MARKET, BY END-USE INDUSTRIES, 2022-2032 (KILOTON)
    TABLE 19. DESICCANT MARKET FOR PACKAGING, BY REGION, 2022-2032 ($MILLION)
    TABLE 20. DESICCANT MARKET FOR PACKAGING, BY REGION, 2022-2032 (KILOTON)
    TABLE 21. DESICCANT MARKET FOR FOOD, BY REGION, 2022-2032 ($MILLION)
    TABLE 22. DESICCANT MARKET FOR FOOD, BY REGION, 2022-2032 (KILOTON)
    TABLE 23. DESICCANT MARKET FOR PHARMACEUTICAL, BY REGION, 2022-2032 ($MILLION)
    TABLE 24. DESICCANT MARKET FOR PHARMACEUTICAL, BY REGION, 2022-2032 (KILOTON)
    TABLE 25. DESICCANT MARKET FOR ELECTRONICS, BY REGION, 2022-2032 ($MILLION)
    TABLE 26. DESICCANT MARKET FOR ELECTRONICS, BY REGION, 2022-2032 (KILOTON)
    TABLE 27. DESICCANT MARKET FOR OTHERS, BY REGION, 2022-2032 ($MILLION)
    TABLE 28. DESICCANT MARKET FOR OTHERS, BY REGION, 2022-2032 (KILOTON)
    TABLE 29. DESICCANT MARKET, BY REGION, 2022-2032 ($MILLION)
    TABLE 30. DESICCANT MARKET, BY REGION, 2022-2032 (KILOTON)
    TABLE 31. NORTH AMERICA DESICCANT MARKET, BY TYPE, 2022-2032 ($MILLION)
    TABLE 32. NORTH AMERICA DESICCANT MARKET, BY TYPE, 2022-2032 (KILOTON)
    TABLE 33. NORTH AMERICA DESICCANT MARKET, BY END-USE INDUSTRIES, 2022-2032 ($MILLION)
    TABLE 34. NORTH AMERICA DESICCANT MARKET, BY END-USE INDUSTRIES, 2022-2032 (KILOTON)
    TABLE 35. NORTH AMERICA DESICCANT MARKET, BY COUNTRY, 2022-2032 ($MILLION)
    TABLE 36. NORTH AMERICA DESICCANT MARKET, BY COUNTRY, 2022-2032 (KILOTON)
    TABLE 37. U.S. DESICCANT MARKET, BY TYPE, 2022-2032 ($MILLION)
    TABLE 38. U.S. DESICCANT MARKET, BY TYPE, 2022-2032 (KILOTON)
    TABLE 39. U.S. DESICCANT MARKET, BY END-USE INDUSTRIES, 2022-2032 ($MILLION)
    TABLE 40. U.S. DESICCANT MARKET, BY END-USE INDUSTRIES, 2022-2032 (KILOTON)
    TABLE 41. CANADA DESICCANT MARKET, BY TYPE, 2022-2032 ($MILLION)
    TABLE 42. CANADA DESICCANT MARKET, BY TYPE, 2022-2032 (KILOTON)
    TABLE 43. CANADA DESICCANT MARKET, BY END-USE INDUSTRIES, 2022-2032 ($MILLION)
    TABLE 44. CANADA DESICCANT MARKET, BY END-USE INDUSTRIES, 2022-2032 (KILOTON)
    TABLE 45. MEXICO DESICCANT MARKET, BY TYPE, 2022-2032 ($MILLION)
    TABLE 46. MEXICO DESICCANT MARKET, BY TYPE, 2022-2032 (KILOTON)
    TABLE 47. MEXICO DESICCANT MARKET, BY END-USE INDUSTRIES, 2022-2032 ($MILLION)
    TABLE 48. MEXICO DESICCANT MARKET, BY END-USE INDUSTRIES, 2022-2032 (KILOTON)
    TABLE 49. EUROPE DESICCANT MARKET, BY TYPE, 2022-2032 ($MILLION)
    TABLE 50. EUROPE DESICCANT MARKET, BY TYPE, 2022-2032 (KILOTON)
    TABLE 51. EUROPE DESICCANT MARKET, BY END-USE INDUSTRIES, 2022-2032 ($MILLION)
    TABLE 52. EUROPE DESICCANT MARKET, BY END-USE INDUSTRIES, 2022-2032 (KILOTON)
    TABLE 53. EUROPE DESICCANT MARKET, BY COUNTRY, 2022-2032 ($MILLION)
    TABLE 54. EUROPE DESICCANT MARKET, BY COUNTRY, 2022-2032 (KILOTON)
    TABLE 55. GERMANY DESICCANT MARKET, BY TYPE, 2022-2032 ($MILLION)
    TABLE 56. GERMANY DESICCANT MARKET, BY TYPE, 2022-2032 (KILOTON)
    TABLE 57. GERMANY DESICCANT MARKET, BY END-USE INDUSTRIES, 2022-2032 ($MILLION)
    TABLE 58. GERMANY DESICCANT MARKET, BY END-USE INDUSTRIES, 2022-2032 (KILOTON)
    TABLE 59. FRANCE DESICCANT MARKET, BY TYPE, 2022-2032 ($MILLION)
    TABLE 60. FRANCE DESICCANT MARKET, BY TYPE, 2022-2032 (KILOTON)
    TABLE 61. FRANCE DESICCANT MARKET, BY END-USE INDUSTRIES, 2022-2032 ($MILLION)
    TABLE 62. FRANCE DESICCANT MARKET, BY END-USE INDUSTRIES, 2022-2032 (KILOTON)
    TABLE 63. UK DESICCANT MARKET, BY TYPE, 2022-2032 ($MILLION)
    TABLE 64. UK DESICCANT MARKET, BY TYPE, 2022-2032 (KILOTON)
    TABLE 65. UK DESICCANT MARKET, BY END-USE INDUSTRIES, 2022-2032 ($MILLION)
    TABLE 66. UK DESICCANT MARKET, BY END-USE INDUSTRIES, 2022-2032 (KILOTON)
    TABLE 67. SPAIN DESICCANT MARKET, BY TYPE, 2022-2032 ($MILLION)
    TABLE 68. SPAIN DESICCANT MARKET, BY TYPE, 2022-2032 (KILOTON)
    TABLE 69. SPAIN DESICCANT MARKET, BY END-USE INDUSTRIES, 2022-2032 ($MILLION)
    TABLE 70. SPAIN DESICCANT MARKET, BY END-USE INDUSTRIES, 2022-2032 (KILOTON)
    TABLE 71. ITALY DESICCANT MARKET, BY TYPE, 2022-2032 ($MILLION)
    TABLE 72. ITALY DESICCANT MARKET, BY TYPE, 2022-2032 (KILOTON)
    TABLE 73. ITALY DESICCANT MARKET, BY END-USE INDUSTRIES, 2022-2032 ($MILLION)
    TABLE 74. ITALY DESICCANT MARKET, BY END-USE INDUSTRIES, 2022-2032 (KILOTON)
    TABLE 75. REST OF EUROPE DESICCANT MARKET, BY TYPE, 2022-2032 ($MILLION)
    TABLE 76. REST OF EUROPE DESICCANT MARKET, BY TYPE, 2022-2032 (KILOTON)
    TABLE 77. REST OF EUROPE DESICCANT MARKET, BY END-USE INDUSTRIES, 2022-2032 ($MILLION)
    TABLE 78. REST OF EUROPE DESICCANT MARKET, BY END-USE INDUSTRIES, 2022-2032 (KILOTON)
    TABLE 79. ASIA-PACIFIC DESICCANT MARKET, BY TYPE, 2022-2032 ($MILLION)
    TABLE 80. ASIA-PACIFIC DESICCANT MARKET, BY TYPE, 2022-2032 (KILOTON)
    TABLE 81. ASIA-PACIFIC DESICCANT MARKET, BY END-USE INDUSTRIES, 2022-2032 ($MILLION)
    TABLE 82. ASIA-PACIFIC DESICCANT MARKET, BY END-USE INDUSTRIES, 2022-2032 (KILOTON)
    TABLE 83. ASIA-PACIFIC DESICCANT MARKET, BY COUNTRY, 2022-2032 ($MILLION)
    TABLE 84. ASIA-PACIFIC DESICCANT MARKET, BY COUNTRY, 2022-2032 (KILOTON)
    TABLE 85. CHINA DESICCANT MARKET, BY TYPE, 2022-2032 ($MILLION)
    TABLE 86. CHINA DESICCANT MARKET, BY TYPE, 2022-2032 (KILOTON)
    TABLE 87. CHINA DESICCANT MARKET, BY END-USE INDUSTRIES, 2022-2032 ($MILLION)
    TABLE 88. CHINA DESICCANT MARKET, BY END-USE INDUSTRIES, 2022-2032 (KILOTON)
    TABLE 89. JAPAN DESICCANT MARKET, BY TYPE, 2022-2032 ($MILLION)
    TABLE 90. JAPAN DESICCANT MARKET, BY TYPE, 2022-2032 (KILOTON)
    TABLE 91. JAPAN DESICCANT MARKET, BY END-USE INDUSTRIES, 2022-2032 ($MILLION)
    TABLE 92. JAPAN DESICCANT MARKET, BY END-USE INDUSTRIES, 2022-2032 (KILOTON)
    TABLE 93. INDIA DESICCANT MARKET, BY TYPE, 2022-2032 ($MILLION)
    TABLE 94. INDIA DESICCANT MARKET, BY TYPE, 2022-2032 (KILOTON)
    TABLE 95. INDIA DESICCANT MARKET, BY END-USE INDUSTRIES, 2022-2032 ($MILLION)
    TABLE 96. INDIA DESICCANT MARKET, BY END-USE INDUSTRIES, 2022-2032 (KILOTON)
    TABLE 97. SOUTH KOREA DESICCANT MARKET, BY TYPE, 2022-2032 ($MILLION)
    TABLE 98. SOUTH KOREA DESICCANT MARKET, BY TYPE, 2022-2032 (KILOTON)
    TABLE 99. SOUTH KOREA DESICCANT MARKET, BY END-USE INDUSTRIES, 2022-2032 ($MILLION)
    TABLE 100. SOUTH KOREA DESICCANT MARKET, BY END-USE INDUSTRIES, 2022-2032 (KILOTON)
    TABLE 101. AUSTRALIA DESICCANT MARKET, BY TYPE, 2022-2032 ($MILLION)
    TABLE 102. AUSTRALIA DESICCANT MARKET, BY TYPE, 2022-2032 (KILOTON)
    TABLE 103. AUSTRALIA DESICCANT MARKET, BY END-USE INDUSTRIES, 2022-2032 ($MILLION)
    TABLE 104. AUSTRALIA DESICCANT MARKET, BY END-USE INDUSTRIES, 2022-2032 (KILOTON)
    TABLE 105. REST OF ASIA-PACIFIC DESICCANT MARKET, BY TYPE, 2022-2032 ($MILLION)
    TABLE 106. REST OF ASIA-PACIFIC DESICCANT MARKET, BY TYPE, 2022-2032 (KILOTON)
    TABLE 107. REST OF ASIA-PACIFIC DESICCANT MARKET, BY END-USE INDUSTRIES, 2022-2032 ($MILLION)
    TABLE 108. REST OF ASIA-PACIFIC DESICCANT MARKET, BY END-USE INDUSTRIES, 2022-2032 (KILOTON)
    TABLE 109. LAMEA DESICCANT MARKET, BY TYPE, 2022-2032 ($MILLION)
    TABLE 110. LAMEA DESICCANT MARKET, BY TYPE, 2022-2032 (KILOTON)
    TABLE 111. LAMEA DESICCANT MARKET, BY END-USE INDUSTRIES, 2022-2032 ($MILLION)
    TABLE 112. LAMEA DESICCANT MARKET, BY END-USE INDUSTRIES, 2022-2032 (KILOTON)
    TABLE 113. LAMEA DESICCANT MARKET, BY COUNTRY, 2022-2032 ($MILLION)
    TABLE 114. LAMEA DESICCANT MARKET, BY COUNTRY, 2022-2032 (KILOTON)
    TABLE 115. BRAZIL DESICCANT MARKET, BY TYPE, 2022-2032 ($MILLION)
    TABLE 116. BRAZIL DESICCANT MARKET, BY TYPE, 2022-2032 (KILOTON)
    TABLE 117. BRAZIL DESICCANT MARKET, BY END-USE INDUSTRIES, 2022-2032 ($MILLION)
    TABLE 118. BRAZIL DESICCANT MARKET, BY END-USE INDUSTRIES, 2022-2032 (KILOTON)
    TABLE 119. SAUDI ARABIA DESICCANT MARKET, BY TYPE, 2022-2032 ($MILLION)
    TABLE 120. SAUDI ARABIA DESICCANT MARKET, BY TYPE, 2022-2032 (KILOTON)
    TABLE 121. SAUDI ARABIA DESICCANT MARKET, BY END-USE INDUSTRIES, 2022-2032 ($MILLION)
    TABLE 122. SAUDI ARABIA DESICCANT MARKET, BY END-USE INDUSTRIES, 2022-2032 (KILOTON)
    TABLE 123. SOUTH AFRICA DESICCANT MARKET, BY TYPE, 2022-2032 ($MILLION)
    TABLE 124. SOUTH AFRICA DESICCANT MARKET, BY TYPE, 2022-2032 (KILOTON)
    TABLE 125. SOUTH AFRICA DESICCANT MARKET, BY END-USE INDUSTRIES, 2022-2032 ($MILLION)
    TABLE 126. SOUTH AFRICA DESICCANT MARKET, BY END-USE INDUSTRIES, 2022-2032 (KILOTON)
    TABLE 127. REST OF LAMEA DESICCANT MARKET, BY TYPE, 2022-2032 ($MILLION)
    TABLE 128. REST OF LAMEA DESICCANT MARKET, BY TYPE, 2022-2032 (KILOTON)
    TABLE 129. REST OF LAMEA DESICCANT MARKET, BY END-USE INDUSTRIES, 2022-2032 ($MILLION)
    TABLE 130. REST OF LAMEA DESICCANT MARKET, BY END-USE INDUSTRIES, 2022-2032 (KILOTON)
    TABLE 131. FUJI SILYSIA CHEMICAL LTD.: KEY EXECUTIVES
    TABLE 132. FUJI SILYSIA CHEMICAL LTD.: COMPANY SNAPSHOT
    TABLE 133. FUJI SILYSIA CHEMICAL LTD.: PRODUCT SEGMENTS
    TABLE 134. FUJI SILYSIA CHEMICAL LTD.: PRODUCT PORTFOLIO
    TABLE 135. DESICCA CHEMICAL PVT. LTD.: KEY EXECUTIVES
    TABLE 136. DESICCA CHEMICAL PVT. LTD.: COMPANY SNAPSHOT
    TABLE 137. DESICCA CHEMICAL PVT. LTD.: PRODUCT SEGMENTS
    TABLE 138. DESICCA CHEMICAL PVT. LTD.: PRODUCT PORTFOLIO
    TABLE 139. TROPACK PACKMITEL GMBH: KEY EXECUTIVES
    TABLE 140. TROPACK PACKMITEL GMBH: COMPANY SNAPSHOT
    TABLE 141. TROPACK PACKMITEL GMBH: PRODUCT SEGMENTS
    TABLE 142. TROPACK PACKMITEL GMBH: PRODUCT PORTFOLIO
    TABLE 143. OKER-CHEMIE: KEY EXECUTIVES
    TABLE 144. OKER-CHEMIE: COMPANY SNAPSHOT
    TABLE 145. OKER-CHEMIE: PRODUCT SEGMENTS
    TABLE 146. OKER-CHEMIE: PRODUCT PORTFOLIO
    TABLE 147. HENGYE, INC.: KEY EXECUTIVES
    TABLE 148. HENGYE, INC.: COMPANY SNAPSHOT
    TABLE 149. HENGYE, INC.: PRODUCT SEGMENTS
    TABLE 150. HENGYE, INC.: PRODUCT PORTFOLIO
    TABLE 151. MULTISORB: KEY EXECUTIVES
    TABLE 152. MULTISORB: COMPANY SNAPSHOT
    TABLE 153. MULTISORB: PRODUCT SEGMENTS
    TABLE 154. MULTISORB: PRODUCT PORTFOLIO
    TABLE 155. CLARIANT: KEY EXECUTIVES
    TABLE 156. CLARIANT: COMPANY SNAPSHOT
    TABLE 157. CLARIANT: PRODUCT SEGMENTS
    TABLE 158. CLARIANT: PRODUCT PORTFOLIO
    TABLE 159. CAPITOL SCIENTIFIC, INC.: KEY EXECUTIVES
    TABLE 160. CAPITOL SCIENTIFIC, INC.: COMPANY SNAPSHOT
    TABLE 161. CAPITOL SCIENTIFIC, INC.: PRODUCT SEGMENTS
    TABLE 162. CAPITOL SCIENTIFIC, INC.: PRODUCT PORTFOLIO
    TABLE 163. W. R. GRACE & CO.-CONN.: KEY EXECUTIVES
    TABLE 164. W. R. GRACE & CO.-CONN.: COMPANY SNAPSHOT
    TABLE 165. W. R. GRACE & CO.-CONN.: PRODUCT SEGMENTS
    TABLE 166. W. R. GRACE & CO.-CONN.: PRODUCT PORTFOLIO
    TABLE 167. EVONIK INDUSTRIES AG: KEY EXECUTIVES
    TABLE 168. EVONIK INDUSTRIES AG: COMPANY SNAPSHOT
    TABLE 169. EVONIK INDUSTRIES AG: PRODUCT SEGMENTS
    TABLE 170. EVONIK INDUSTRIES AG: PRODUCT PORTFOLIO
  • LIST OF FIGURES

  • FIGURE 01. DESICCANT MARKET, 2022-2032
    FIGURE 02. SEGMENTATION OF DESICCANT MARKET,2022-2032
    FIGURE 03. TOP INVESTMENT POCKETS IN DESICCANT MARKET (2023-2032)
    FIGURE 04. MODERATE BARGAINING POWER OF SUPPLIERS
    FIGURE 05. MODERATE THREAT OF NEW ENTRANTS
    FIGURE 06. MODERATE THREAT OF SUBSTITUTES
    FIGURE 07. HIGH INTENSITY OF RIVALRY
    FIGURE 08. HIGH BARGAINING POWER OF BUYERS
    FIGURE 09. GLOBAL DESICCANT MARKET:DRIVERS, RESTRAINTS AND OPPORTUNITIES
    FIGURE 10. MARKET SHARE ANALYSIS OF DESICCANT MARKET BY KEY PLAYERS, 2022 (%)
    FIGURE 11. PRICING ANALYSIS: DESICCANT MARKET 2022 AND 2032
    FIGURE 12. PATENT ANALYSIS BY COMPANY
    FIGURE 13. PATENT ANALYSIS BY COUNTRY
    FIGURE 14. DESICCANT MARKET, BY TYPE, 2022(%)
    FIGURE 15. COMPARATIVE SHARE ANALYSIS OF DESICCANT MARKET FOR SILICA GEL, BY COUNTRY 2022 AND 2032(%)
    FIGURE 16. COMPARATIVE SHARE ANALYSIS OF DESICCANT MARKET FOR ACTIVATED ALUMINA, BY COUNTRY 2022 AND 2032(%)
    FIGURE 17. COMPARATIVE SHARE ANALYSIS OF DESICCANT MARKET FOR ACTIVATED CHARCOAL, BY COUNTRY 2022 AND 2032(%)
    FIGURE 18. COMPARATIVE SHARE ANALYSIS OF DESICCANT MARKET FOR ZEOLITE, BY COUNTRY 2022 AND 2032(%)
    FIGURE 19. COMPARATIVE SHARE ANALYSIS OF DESICCANT MARKET FOR CALCIUM CHLORIDE, BY COUNTRY 2022 AND 2032(%)
    FIGURE 20. COMPARATIVE SHARE ANALYSIS OF DESICCANT MARKET FOR CLAY, BY COUNTRY 2022 AND 2032(%)
    FIGURE 21. COMPARATIVE SHARE ANALYSIS OF DESICCANT MARKET FOR OTHERS, BY COUNTRY 2022 AND 2032(%)
    FIGURE 22. DESICCANT MARKET, BY END-USE INDUSTRIES, 2022(%)
    FIGURE 23. COMPARATIVE SHARE ANALYSIS OF DESICCANT MARKET FOR PACKAGING, BY COUNTRY 2022 AND 2032(%)
    FIGURE 24. COMPARATIVE SHARE ANALYSIS OF DESICCANT MARKET FOR FOOD, BY COUNTRY 2022 AND 2032(%)
    FIGURE 25. COMPARATIVE SHARE ANALYSIS OF DESICCANT MARKET FOR PHARMACEUTICAL, BY COUNTRY 2022 AND 2032(%)
    FIGURE 26. COMPARATIVE SHARE ANALYSIS OF DESICCANT MARKET FOR ELECTRONICS, BY COUNTRY 2022 AND 2032(%)
    FIGURE 27. COMPARATIVE SHARE ANALYSIS OF DESICCANT MARKET FOR OTHERS, BY COUNTRY 2022 AND 2032(%)
    FIGURE 28. DESICCANT MARKET BY REGION, 2022(%)
    FIGURE 29. U.S. DESICCANT MARKET, 2022-2032 ($MILLION)
    FIGURE 30. CANADA DESICCANT MARKET, 2022-2032 ($MILLION)
    FIGURE 31. MEXICO DESICCANT MARKET, 2022-2032 ($MILLION)
    FIGURE 32. GERMANY DESICCANT MARKET, 2022-2032 ($MILLION)
    FIGURE 33. FRANCE DESICCANT MARKET, 2022-2032 ($MILLION)
    FIGURE 34. UK DESICCANT MARKET, 2022-2032 ($MILLION)
    FIGURE 35. SPAIN DESICCANT MARKET, 2022-2032 ($MILLION)
    FIGURE 36. ITALY DESICCANT MARKET, 2022-2032 ($MILLION)
    FIGURE 37. REST OF EUROPE DESICCANT MARKET, 2022-2032 ($MILLION)
    FIGURE 38. CHINA DESICCANT MARKET, 2022-2032 ($MILLION)
    FIGURE 39. JAPAN DESICCANT MARKET, 2022-2032 ($MILLION)
    FIGURE 40. INDIA DESICCANT MARKET, 2022-2032 ($MILLION)
    FIGURE 41. SOUTH KOREA DESICCANT MARKET, 2022-2032 ($MILLION)
    FIGURE 42. AUSTRALIA DESICCANT MARKET, 2022-2032 ($MILLION)
    FIGURE 43. REST OF ASIA-PACIFIC DESICCANT MARKET, 2022-2032 ($MILLION)
    FIGURE 44. BRAZIL DESICCANT MARKET, 2022-2032 ($MILLION)
    FIGURE 45. SAUDI ARABIA DESICCANT MARKET, 2022-2032 ($MILLION)
    FIGURE 46. SOUTH AFRICA DESICCANT MARKET, 2022-2032 ($MILLION)
    FIGURE 47. REST OF LAMEA DESICCANT MARKET, 2022-2032 ($MILLION)
    FIGURE 48. TOP WINNING STRATEGIES, BY YEAR
    FIGURE 49. TOP WINNING STRATEGIES, BY DEVELOPMENT
    FIGURE 50. TOP WINNING STRATEGIES, BY COMPANY
    FIGURE 51. PRODUCT MAPPING OF TOP 10 PLAYERS
    FIGURE 52. COMPETITIVE DASHBOARD
    FIGURE 53. COMPETITIVE HEATMAP: DESICCANT MARKET
    FIGURE 54. TOP PLAYER POSITIONING, 2022
    FIGURE 55. CLARIANT: NET REVENUE, 2020-2022 ($MILLION)
    FIGURE 56. CLARIANT: RESEARCH & DEVELOPMENT EXPENDITURE, 2020-2022 ($MILLION)
    FIGURE 57. CLARIANT: REVENUE SHARE BY SEGMENT, 2022 (%)
    FIGURE 58. CLARIANT: REVENUE SHARE BY REGION, 2022 (%)
    FIGURE 59. W. R. GRACE & CO.-CONN.: NET REVENUE, 2018-2020 ($MILLION)
    FIGURE 60. W. R. GRACE & CO.-CONN.: REVENUE SHARE BY SEGMENT, 2020 (%)
    FIGURE 61. W. R. GRACE & CO.-CONN.: REVENUE SHARE BY REGION, 2020 (%)
    FIGURE 62. EVONIK INDUSTRIES AG: NET REVENUE, 2019-2021 ($MILLION)
    FIGURE 63. EVONIK INDUSTRIES AG: RESEARCH & DEVELOPMENT EXPENDITURE, 2019-2021 ($MILLION)
    FIGURE 64. EVONIK INDUSTRIES AG: REVENUE SHARE BY SEGMENT, 2021 (%)
    FIGURE 65. EVONIK INDUSTRIES AG: REVENUE SHARE BY REGION, 2021 (%)


PURCHASE OPTIONS

Call or Email us

U.S.-Canada Toll-free: +1-800-792-5285
Int'l : +1-503-894-6022
Europe : +44-845-528-1300
Email : help@alliedmarketresearch.com
 
FREQUENTLY ASKED QUESTIONS?

A. Desiccant Market is studied across North America, Europe, Asia-Pacific, and LAMEA.

A. Increase in demand for desiccants from the pharmaceutical industry and increase in demand for activated alumina from the oil and gas industry are the driving factors of the Desiccant Market.

A. Increase in use of desiccant in chemical sector and air conditioning system is the upcoming trend of Desiccant Market in the world.

A. Asia-Pacific is the largest regional market for Desiccant.

A. ROPACK Packmitel GmbH, CLARIANT, Capitol Scientific, Inc. Multisorb, OKER-CHEMIE, Evonik Industries AG, Desicca Chemical Pvt. Ltd., and W. R. Grace & Co.-Conn are the top companies to hold the market share in Desiccant.

A. The global desiccant market was valued at $1.1 billion in 2022 and is projected to reach $1.8 billion by 2032, growing at a CAGR of 5.1% from 2023 to 2032.

A. Food is the leading End-Use Industry of Desiccant Market.

Looking for Customization?

 Customization Request

Have a Question?

 Speak with Analyst

Any Confusion?

 Inquire Before Buying

Have a glance of the Report

  Request Sample
RELATED TAGS

Purchase Full Report of
Desiccant Market

Start reading instantly.
This Report and over 68,439+ more Reports, Available with Avenue Library. T&C*.

  • Online Only
  • $3,570
  • Online cloud access only
  • Restricted print, copy, paste & download
  • Read only
  • Free industry update
    (Within 180 days)
  • Free report update in next update cycle
    (Aug 2024 - Aug 2025)
  • Data Pack
  • $3,840
  • Restricted to one authorized user
  • One print only
  • Available in
    Excel
  • Free industry update
    (Within 180 days)
  •   Free report update in next update cycle
    (Aug 2024 - Aug 2025)
  • Single User
  • $5,730
  • Restricted to one authorized user
  • One print only
  • Available in
    PDF
  • Free industry update
    (Within 180 days)
  •   Free report update in next update cycle
    (Aug 2024 - Aug 2025)
  • Five Users
  • $6,450
  • Limited to five authorized users
  • Print upto five copies
  • Available in
    PDF
  • Free industry update
    (Within 180 days)
  •   Free report update in next update cycle
    (Aug 2024 - Aug 2025)
  • Enterprise
    License/PDF

  • $9,600
  • Unlimited
    within
    company/enterprise
  • Available in Excel & PDF
  • Free industry update
    (Within 180 days)
  •   Free report update in next update cycle
    (Aug 2024 - Aug 2025)
  • Library
    Membership

  • $999 $ 1,175
    Per User/ Per month/ Billed annually
  • Published Content
    E-access
  • Company Profiles
    E-access
  • Newly Added Content Access
  • 10 PDF
    Downloads
  • 5 Excel Data
    Pack Downloads
  • 250 Company Profiles PDF Downloads
  • Buy Now

*Taxes/Fees, if applicable will be added during checkout. All prices in USD

RELATED REPORTS
 

Why Allied Market Research?


Infallible Methodology

To ensure high-level data integrity, accurate analysis, and impeccable forecasts

Analyst Support

For complete satisfaction

Customization

On-demand customization of scope of the report to exactly meet your needs

TARGETED MARKET VIEW

Targeted market view to provide pertinent information and save time of readers

Get fresh content delivered

Get insights on topics that are crucial for your business. Stay abreast of your interest areas.

Get Industry Data Alerts

Why Allied Market Research?

Infallible Methodology

To ensure high-level data integrity, accurate analysis, and impeccable forecasts

Analyst Support

For complete satisfaction

Customization

On-demand customization of scope of the report to exactly meet your needs

TARGETED MARKET VIEW

Targeted market view to provide pertinent information and save time of readers