0
2019
Dewatering Pumps Market

Dewatering Pumps Market

by Type (Submersible Dewatering Pumps and Non-submersible Dewatering Pumps) and Application (Construction & Agriculture, Oil & Gas, Municipal, Mineral & Mining, and Others): Global Opportunity Analysis and Industry Forecast, 2019-2026

Report Code: A05034
Jul 2019 | Pages: 250
Tables: 130
Charts: 35
  • Formats*:

  • pdf

    Single User License, Five User
    License & Enterprise User License

  • xls

    Data Pack Excel License

  • ppt

    It comes with the additional cost
    of $2500.00 contact sales.


COVID-19

Pandemic disrupted the entire world and affected many industries.

Get detailed COVID-19 impact analysis on the Dewatering Pumps Market

Request Now !

Dewatering Pumps Market Outlook - 2026

The global dewatering pumps market size is expected to reach $10,133.4 million in 2026, from $6,374.1 million in 2018, growing at a CAGR of 5.9% from 2019 to 2026. 

The dewatering process involves the removal or draining of groundwater or surface water from a riverbed, construction site, caisson, or mine shaft, by pumping. Dewatering pumps are majorly used for water removal or expulsion process in industries such as power plants, underground mines, flood dewatering, cement plants, thermal plants, and construction industries. These pumps are installed at construction sites situated at lower ground levels to maintain and control groundwater water level.  They serve as a cost-efficient option, as they eliminate the cost of solids handling.

Dewatering Pumps Market

Two types of dewatering pumps are available in the market, which include submersible dewatering pumps and non-submersible dewatering pumps. Submersible dewatering pump is equipped with an airtight sealed motor, which is closely clamped to the machine. Non-submersible pumps are available in various types such as centrifugal dewatering pumps and wellpoint dewatering pumps. These pumps are a mechanical machine, which is positioned upon the surface that is used to bring the groundwater up to the dewatering pump unit present on the surface.  

Increase in adoption of water removal pumps to eliminate the water which is accumulated in the excavated foundations or pit and surge in construction activities in urban areas are anticipated to fuel the growth of the global dewatering pumps market. One of the leading factors for the dewatering pumps market growth is focus of major vendors toward manufacturing pumps for dewatering applications. For instance, ARO Fluid Management introduced P35A1-EU submersible dewatering pump, which is capable to handle a wide variety of debris-laden applications. In addition, upsurge in population and rapid urbanization & industrialization have led to the development of the construction industry, which in turn is anticipated to propel the growth of the dewatering pumps market. Moreover, several industries such as food & beverages, power generation, and others use these pumps, as they are highly efficient, have the large wear-resistant capacity, long service life, low maintenance, and wide flow-rate capacity. However, unstable prices of raw materials and high operating costs associated with its installation hamper the growth of the market.

Dewatering Pumps Market by Application


Furthermore, rise in adoption of dewatering pumps in wastewater management and recycling is expected to create remunerative opportunities for market expansion. This is attributed to the fact that dewatering pumps help to pump fresh water and dirty water mixed with abrasives. In addition, manufacturers focus on designing energy-efficient pump systems to augment the growth of the market. For instance, BBA Pumps BV provides a series of PT wellpoint dewatering pumps that offer minimal maintenance, superior suction lift, and long service life. In addition, the demand for energy-efficient and environmental-friendly pumps are anticipated to offer significant growth opportunities for pump manufacturers in the near future.

Dewatering Pumps Market by Type

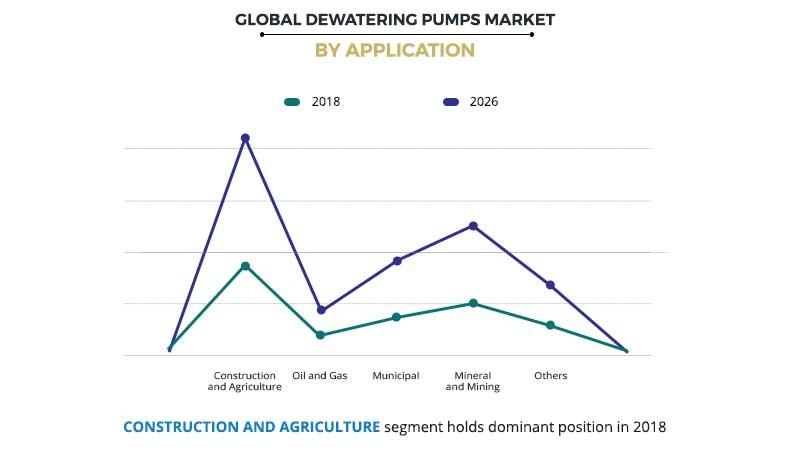
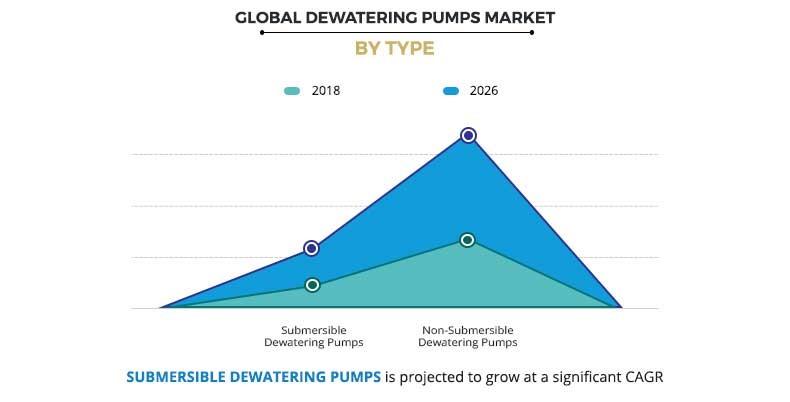
The global dewatering pumps market is segmented based on type, application, and region. Depending on type, the market is categorized into submersible dewatering pump and non-submersible dewatering pumps. In terms, of volume, the submersible dewatering pump segment is anticipated to dominate the global dewatering pumps market in the upcoming years. The applications covered in the market include construction & agriculture, oil & gas, municipal, mineral & mining, and others. The construction & agriculture segment is projected to dominate the global dewatering pumps market throughout the study period. 

Dewatering Pumps Market by Region


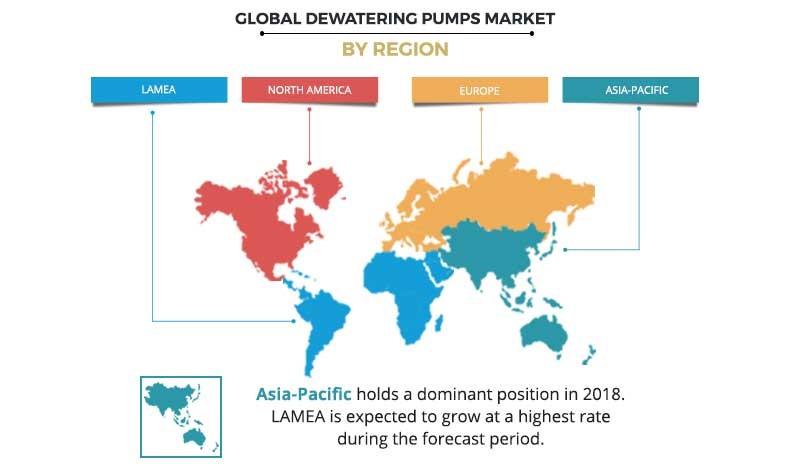
The global dewatering pumps market is analyzed across four geographical regions, which include North America (U.S., Canada, and Mexico), Europe (Germany, France, UK, Russia, and rest of Europe), Asia-Pacific (Japan, China, Australia, India, and rest of Asia-Pacific), and LAMEA (Latin America, Middle East, and Africa). Asia-Pacific is expected to hold the largest market share throughout the study period, however, LAMEA region is expected to grow at the fastest rate.

Competition Analysis

The key market players profiled in the report of dewatering pumps market include Atlas Copco, EBARA Corporation, Flowserve Corporation, Grundfos, Gorman-Rupp, ITT INC., KSB SE & Co., Sulzer Ltd., The Weir Group PLC, and Xylem. Other companies operating in the market are Honda Power Equipment, BBA Pumps, Designed & Engineered Pumps, Ruhrpumpen, Atlantic Pumps Ltd., Tsurumi Pump, Veer Pump, Wacker Neuson, Mersino Dewatering, Kirloskar Pumps, and Zoeller Pumps.

Many competitors holds dominant position in the dewatering pumps market share. These companies have adopted product launch as their key developmental strategy to expand their product portfolio for business expansion. For instance, in January 2018, Gorman-Rupp introduced an innovative ValuPrime Line, which is an economical priming-assisted submersible dewatering pump. This line of pumps is suitable for dewatering demands of the agricultural, industrial, and construction sectors. Similarly, in March 2019, EBARA launched eDYNAMiQ particularly used for standard pump technology.
 
Key Benefits for Dewatering Pumps Market:

  • The report provides an extensive analysis of the current and emerging dewatering pumps market trends and dynamics.  
  • In-depth analysis of the dewatering pumps market is conducted by constructing market estimations for the key segments between 2018 and 2026. 
  • Extensive analysis is conducted by following key product positioning and monitoring of the top competitors within the market framework.
  • A comprehensive analysis of all the regions is provided to determine the prevailing opportunities.
  • Global dewatering pumps market forecast analysis from 2018 to 2026 is included in the report.
  • Key market players within dewatering pumps market are profiled in this report, and their strategies are analyzed thoroughly, which help to understand the competitive outlook of the dewatering pumps industry. 

Dewatering Pumps Market Segments:

By Type

  • Submersible Dewatering Pumps
  • Non-submersible Dewatering Pumps

By Application

  • Construction & Agriculture
  • Oil & Gas
  • Municipal
  • Mineral & Mining
  • Others

By Region

  • North America
    • U.S.
    • Canada
    • Mexico
  • Europe
    • Germany
    • France
    • UK
    • Russia
    • Rest of Europe
  • Asia-Pacific
    • Japan
    • China
    • Australia
    • India
    • Rest of Asia-Pacific
  • LAMEA
    • Latin America
    • Middle East 
    • Africa

Key Players

  • Atlas Copco 
  • Ebara Corporation
  • Flowserve Corporation
  • Grundfos
  • Gorman-Rupp
  • ITT INC. 
  • KSB SE & Co. 
  • Sulzer Ltd.
  • The Weir Group PLC 
  • Xylem

Dewatering Pumps Market Report Highlights

Aspects Details
By TYPE
  • Submersible dewatering pumps
  • Non-submersible dewatering pumps Dewatering Pumps
By APPLICATION
  • Construction and agriculture
  • Mineral and mining
  • Oil & Gas
  • Municipal
  • Others
By Region
  • North America  (U.S., Canada, Mexico)
  • Europe  (France, Germany, Italy, Spain, UK, Russia, Rest of Europe)
  • Asia-Pacific  (China, Japan, India, South Korea, Australia, Thailand, Malaysia, Indonesia, Rest of Asia-Pacific)
  • LAMEA  (Brazil, South Africa, Saudi Arabia, UAE, Argentina, Rest of LAMEA)
Key Market Players Xylem Inc., The Weir Group PLC, EBARA CORPORATION, Atlas Copco AB, The Gorman-Rupp Company, Flowserve Corporation, KSB SE & Co. KGaA, Sulzer Ltd., ITT Inc., Grundfos Holding A/S
 

CHAPTER 1:    INTRODUCTION

1.1.    Report description 
1.2.    Key benefits for stakeholders
1.3.    Key market segments
1.4.    Research methodology

1.4.1.    Secondary research
1.4.2.    Primary research
1.4.3.    Analyst tools & models

CHAPTER 2:    EXECUTIVE SUMMARY

2.1.1.    Key findings of the dewatering pumps market:

2.2.    Key findings

2.2.1.    Top impacting factors
2.2.2.    Top investment pockets

2.3.    CXO perspective

CHAPTER 3:    MARKET OVERVIEW

3.1.    Market definition and scope
3.2.    Parent/Peer Market Overview
3.3.    Key Forces Shaping Dewatering Pumps Industry

3.3.1.    Low-to-moderate bargaining power of suppliers
3.3.2.    Low-to-moderate threat of new entrants
3.3.3.    Low-to-moderate threat of substitutes
3.3.4.    Moderate-to-high intensity of rivalry
3.3.5.    Moderate-to-high bargaining power of buyers

3.4.    Pricing Analysis

3.4.1.    Pricing Analysis of Product A, By Region, 2018 & 2025

3.5.    Value Chain Analysis
3.6.    Industry Pain point analysis
3.7.    Market dynamics

3.7.1.    Drivers

3.7.1.1.    Increase in construction activities
3.7.1.2.    The surge in demand from the mining industry
3.7.1.3.    Strong industrialization and rapid urbanization in emerging economies

3.7.2.    Restraint

3.7.2.1.    Unstable prices of raw material and high operating costs associated

3.7.3.    Opportunities

3.7.3.1.    The surge in awareness about energy saving and government regulations
3.7.3.2.    A rise in demand for wastewater management

CHAPTER 4:    DEWATERING PUMPS MARKET, BY TYPE

4.1.    Market overview

4.1.1.    Market size and forecast, by Type
4.1.2.    Market volume and forecast, by Type

4.2.    Submersible dewatering pumps

4.2.1.    Key market trends, growth factors, and opportunities
4.2.2.    Market size and forecast, by region
4.2.3.    Market analysis by country

4.3.    Non-submersible dewatering pumps Dewatering Pumps

4.3.1.    Key market trends, growth factors, and opportunities
4.3.2.    Market size and forecast, by region
4.3.3.    Market analysis by country

CHAPTER 5:    DEWATERING PUMPS MARKET, BY APPLICATION

5.1.    Market overview

5.1.1.    Market size and forecast, by application

5.2.    Construction and agriculture

5.2.1.    Key market trends, growth factors, and opportunities
5.2.2.    Market size and forecast, by region
5.2.3.    Market analysis by country

5.3.    Mineral and mining

5.3.1.    Key market trends, growth factors, and opportunities
5.3.2.    Market size and forecast, by region
5.3.3.    Market analysis by country

5.4.    Oil & Gas

5.4.1.    Key market trends, growth, and opportunities
5.4.2.    Market size and forecast, by region
5.4.3.    Market analysis by country

5.5.    Municipal

5.5.1.    Key market trends, growth, and opportunities
5.5.2.    Market size and forecast, by region
5.5.3.    Market analysis by country

5.6.    Others

5.6.1.    Key market trends, growth, and opportunities
5.6.2.    Market size and forecast, by region
5.6.3.    Market analysis by country

CHAPTER 6:    DEWATERING PUMPS MARKET, BY REGION

6.1.    Market overview

6.1.1.    Market size and forecast, by region

6.2.    North America

6.2.1.    Key market trends, growth factors, and opportunities
6.2.2.    Market size and forecast, by type
6.2.3.    Market size and forecast, by Application
6.2.4.    Market size and forecast, by country

6.2.4.1.    U.S.

6.2.4.1.1.    U.S. market size and forecast, by type
6.2.4.1.3.    U.S. market size and forecast, by application

6.2.4.2.    Canada

6.2.4.2.1.    Canada market size and forecast, by type
6.2.4.2.3.    Canada market size and forecast, by application

6.2.4.3.    Mexico

6.2.4.3.1.    Mexico market size and forecast, by type
6.2.4.3.3.    Mexico market size and forecast, by application

6.3.    Europe

6.3.1.    Key market trends, growth factors, and opportunities
6.3.2.    Europe market size and forecast, by Type
6.3.4.    Europe market size and forecast, by Application
6.3.5.    Europe market size and forecast, by country

6.3.5.1.    Germany

6.3.5.1.1.    Germany market size and forecast, by type
6.3.5.1.2.    Germany market size and forecast, by application

6.3.5.2.    Russia

6.3.5.2.1.    Russia market size and forecast, by type
6.3.5.2.3.    Russia market size and forecast, by application

6.3.5.3.    France

6.3.5.3.1.    France market size and forecast, by type
6.3.5.3.2.    France market size and forecast, by application

6.3.5.4.    UK

6.3.5.4.1.    UK market size and forecast, by type
6.3.5.4.2.    UK market size and forecast, by application

6.3.5.5.    Rest of Europe

6.3.5.5.1.    Rest of Europe market size and forecast, by type
6.3.5.5.3.    Rest of Europe market size and forecast, by application

6.4.    Asia-Pacific

6.4.1.    Key market trends, growth factors, and opportunities
6.4.2.    Asia-Pacific market size and forecast, by type
6.4.4.    Asia-Pacific market size and forecast, by application
6.4.5.    Asia-Pacific market size and forecast, by country

6.4.5.1.    China

6.4.5.1.1.    China market size and forecast, by type
6.4.5.1.3.    China market size and forecast, by application

6.4.5.2.    Japan

6.4.5.2.1.    Japan market size and forecast, by type
6.4.5.2.3.    Japan market size and forecast, by application

6.4.5.3.    India

6.4.5.3.1.    India market size and forecast, by type
6.4.5.3.3.    India market size and forecast, by application

6.4.5.4.    Australia

6.4.5.4.1.    Australia market size and forecast, by Type
6.4.5.4.2.    Australia market size and forecast, by application

6.4.5.5.    Rest of Asia-Pacific

6.4.5.5.1.    Rest of Asia-Pacific market size and forecast, by Type
6.4.5.5.3.    Rest of Asia-Pacific market size and forecast, by application

6.5.    LAMEA

6.5.1.    Key market trends, growth factors, and opportunities
6.5.2.    LAMEA market size and forecast, by Type
6.5.4.    LAMEA market size and forecast, by Application

6.5.4.1.    Latin America

6.5.4.1.1.    Latin America market size and forecast, by type
6.5.4.1.2.    Latin America market size and forecast, by application

6.5.4.2.    Middle-East

6.5.4.2.1.    Middle-East market size and forecast, by type
6.5.4.2.2.    Middle-East market size and forecast, by application

6.5.4.3.    Africa

6.5.4.3.1.    Africa market size and forecast, by type
6.5.4.3.2.    Africa market size and forecast, by application

CHAPTER 7:    COMPETITIVE LANDSCAPE

7.1.    INTRODUCTION

7.1.1.    MARKET PLAYER POSITIONING, 2017

7.2.    TOP WINNING STRATEGIES

7.2.1.    Top winning strategies, by year
7.2.2.    Top winning strategies, by development
7.2.3.    Top winning strategies, by company

7.3.    PRODUCT MAPPING OF TOP 10 PLAYER
7.4.    COMPETITIVE DASHBOARD
7.5.    COMPETITIVE HEATMAP
7.6.    KEY DEVELOPMENTS

7.6.1.    New product launches
7.6.2.    Expansions
7.6.3.    Mergers and acquisition
7.6.4.    Other developments

CHAPTER 8:    COMPANY PROFILES

8.1.    Atlas Copco AB

8.1.1.    Company overview
8.1.2.    Key Executives
8.1.3.    Company snapshot
8.1.4.    Operating business segments
8.1.5.    Product portfolio
8.1.6.    R&D Expenditure
8.1.7.    Business performance
8.1.8.    Key strategic moves and developments

8.2.    EBARA CORPORATION

8.2.1.    Company overview
8.2.2.    Key Executives
8.2.3.    Company snapshot
8.2.4.    Operating business segments
8.2.5.    Product portfolio
8.2.6.    R&D Expenditure
8.2.7.    Business performance
8.2.8.    Key strategic moves and developments

8.3.    Flowserve Corporation

8.3.1.    Company overview
8.3.2.    Company snapshot
8.3.3.    Operating business segments
8.3.4.    Product portfolio
8.3.1.    R&D Expenditure
8.3.2.    Business performance

8.4.    Grundfos Holding A/S

8.4.1.    Company overview
8.4.2.    Key Executives
8.4.3.    Company snapshot
8.4.4.    Product portfolio
8.4.5.    R&D Expenditure
8.4.6.    Business performance
8.4.7.    Key strategic moves and developments

8.5.    ITT Inc.

8.5.1.    Company overview
8.5.2.    Key Executives
8.5.3.    Company snapshot
8.5.4.    Operating business segments
8.5.5.    Product portfolio
8.5.6.    R&D Expenditure
8.5.7.    Business performance
8.5.8.    Key strategic moves and developments

8.6.    KSB SE & Co. KGaA

8.6.1.    Company overview
8.6.2.    Key Executives
8.6.3.    Company snapshot
8.6.4.    Operating business segments
8.6.5.    Product portfolio
8.6.6.    R&D Expenditure
8.6.7.    Business performance
8.6.8.    Key strategic moves and developments

8.7.    Sulzer Ltd.

8.7.1.    Company overview
8.7.2.    Key Executives
8.7.3.    Company snapshot
8.7.4.    Product portfolio
8.7.5.    Business performance
8.7.6.    Key strategic moves and developments

8.8.    The Gorman-Rupp Company

8.8.1.    Company overview
8.8.2.    Key Executives
8.8.3.    Company snapshot
8.8.4.    Product categories
8.8.5.    Product portfolio
8.8.6.    Business performance
8.8.7.    Key strategic moves and developments

8.9.    The Weir Group PLC

8.9.1.    Company overview
8.9.2.    Key Executives
8.9.3.    Company snapshot
8.9.4.    Operating business segments
8.9.5.    Product portfolio
8.9.6.    R&D Expenditure
8.9.7.    Business performance
8.9.8.    Key strategic moves and developments

8.10.    Xylem Inc.

8.10.1.    Company overview
8.10.2.    Key Executives
8.10.3.    Company snapshot
8.10.4.    Operating business segments
8.10.5.    Product portfolio
8.10.6.    R&D Expenditure
8.10.7.    Business performance
8.10.8.    Key strategic moves and developments

LIST OF TABLES

TABLE 01.    GLOBAL DEWATERING PUMPS MARKET REVENUE, BY TYPE, 2018-2026 ($MILLION)
TABLE 02.    GLOBAL DEWATERING PUMPS MARKET REVENUE, BY TYPE, 2018-2026 (THOUSAND UNITS)
TABLE 03.    DEWATERING PUMPS MARKET REVENUE, FOR SUBMERSIBLE DEWATERING PUMPS, BY REGION, 2018-2026 ($MILLION)
TABLE 04.    DEWATERING PUMPS MARKET REVENUE, FOR NON-SUBMERSIBLE DEWATERING PUMPS, BY REGION, 2018-2026 ($MILLION)
TABLE 05.    GLOBAL DEWATERING PUMPS MARKET REVENUE, BY APPLICATION, 2018-2026 ($MILLION)
TABLE 06.    DEWATERING PUMPS MARKET REVENUE, FOR CONSTRUCTION AND AGRICULTURE, BY REGION, 2018-2026 ($MILLION)
TABLE 07.    DEWATERING PUMPS MARKET REVENUE, FOR MINERAL & MINING, BY REGION, 2018-2026 ($MILLION)
TABLE 08.    DEWATERING PUMPS MARKET REVENUE, FOR OIL & GAS, BY REGION, 2018-2026 ($MILLION)
TABLE 09.    DEWATERING PUMPS MARKET REVENUE, FOR MUNICIPAL, BY REGION, 2018-2026 ($MILLION)
TABLE 10.    DEWATERING PUMPS MARKET REVENUE, FOR INDUSTRIAL, BY REGION, 2018-2026 ($MILLION)
TABLE 11.    DEWATERING PUMPS MARKET, BY REGION, 2018-2026 ($MILLION)
TABLE 12.    NORTH AMERICA DEWATERING PUMPS MARKET, BY TYPE, 2018-2026 ($MILLION)
TABLE 13.    NORTH AMERICA DEWATERING PUMPS MARKET REVENUE, BY APPLICATION, 2018-2026 ($MILLION)
TABLE 14.    NORTH AMERICA DEWATERING PUMPS MARKET, BY COUNTRY, 2018-2026 ($MILLION)
TABLE 15.    U.S. DEWATERING PUMPS MARKET, BY TYPE, 2018-2026 ($MILLION)
TABLE 16.    U.S. DEWATERING PUMPS MARKET, BY APPLICATION, 2018-2026 ($MILLION)
TABLE 17.    CANADA DEWATERING PUMPS MARKET, BY TYPE, 2018-2026 ($MILLION)
TABLE 18.    CANADA DEWATERING PUMPS MARKET, BY APPLICATION, 2018-2026 ($MILLION)
TABLE 19.    MEXICO DEWATERING PUMPS MARKET, BY TYPE, 2018-2026 ($MILLION)
TABLE 20.    MEXICO DEWATERING PUMPS MARKET, BY APPLICATION, 2018-2026 ($MILLION)
TABLE 21.    EUROPE DEWATERING PUMPS MARKET, BY TYPE, 2018-2026 ($MILLION)
TABLE 22.    EUROPE DEWATERING PUMPS MARKET, BY APPLICATION, 2018-2026 ($MILLION)
TABLE 23.    EUROPE DEWATERING PUMPS MARKET, BY COUNTRY, 2018-2026 ($MILLION)
TABLE 24.    GERMANY DEWATERING PUMPS MARKET, BY TYPE, 2018-2026 ($MILLION)
TABLE 25.    GERMANY DEWATERING PUMPS MARKET, BY APPLICATION, 2018-2026 ($MILLION)
TABLE 26.    RUSSIA DEWATERING PUMPS MARKET, BY TYPE, 2018-2026 ($MILLION)
TABLE 27.    RUSSIA DEWATERING PUMPS MARKET, BY APPLICATION, 2018-2026 ($MILLION)
TABLE 28.    FRANCE DEWATERING PUMPS MARKET, BY TYPE, 2018-2026 ($MILLION)
TABLE 29.    FRANCE DEWATERING PUMPS MARKET, BY APPLICATION, 2018-2026 ($MILLION)
TABLE 30.    UK DEWATERING PUMPS MARKET, BY TYPE, 2018-2026 ($MILLION)
TABLE 31.    UK DEWATERING PUMPS MARKET, BY APPLICATION, 2016–2025 ($MILLION)
TABLE 32.    REST OF EUROPE DEWATERING PUMPS MARKET, BY TYPE, 2018-2026 ($MILLION)
TABLE 33.    REST OF EUROPE DEWATERING PUMPS MARKET, BY APPLICATION, 2018-2026 ($MILLION)
TABLE 34.    ASIA-PACIFIC DEWATERING PUMPS MARKET, BY TYPE, 2018-2026 ($MILLION)
TABLE 35.    ASIA-PACIFIC DEWATERING PUMPS MARKET, BY APPLICATION, 2018-2026 ($MILLION)
TABLE 36.    ASIA-PACIFIC DEWATERING PUMPS MARKET, BY COUNTRY, 2018-2026 ($MILLION)
TABLE 37.    CHINA DEWATERING PUMPS MARKET, BY TYPE, 2018-2026 ($MILLION)
TABLE 38.    CHINA DEWATERING PUMPS MARKET, BY APPLICATION, 2018-2026 ($MILLION)
TABLE 39.    JAPAN DEWATERING PUMPS MARKET, BY TYPE, 2018-2026 ($MILLION)
TABLE 40.    JAPAN DEWATERING PUMPS MARKET, BY APPLICATION, 2018-2026 ($MILLION)
TABLE 41.    INDIA DEWATERING PUMPS MARKET, BY TYPE, 2018-2026 ($MILLION)
TABLE 42.    INDIA DEWATERING PUMPS MARKET, BY APPLICATION, 2018-2026 ($MILLION)
TABLE 43.    AUSTRALIA DEWATERING PUMPS MARKET, BY TYPE, 2018-2026 ($MILLION)
TABLE 44.    AUSTRALIA DEWATERING PUMPS MARKET, BY APPLICATION, 2018-2026 ($MILLION)
TABLE 45.    REST OF ASIA-PACIFIC DEWATERING PUMPS MARKET, BY TYPE, 2018-2026 ($MILLION)
TABLE 46.    REST OF ASIA-PACIFIC DEWATERING PUMPS MARKET, BY APPLICATION, 2018-2026 ($MILLION)
TABLE 47.    LAMEA DEWATERING PUMPS MARKET, BY TYPE, 2018-2026 ($MILLION)
TABLE 48.    LAMEA DEWATERING PUMPS MARKET, BY APPLICATION, 2018-2026 ($MILLION)
TABLE 49.    LAMEA MARKET SIZE AND FORECAST, BY COUNTRY
TABLE 50.    LAMEA DEWATERING PUMPS MARKET, BY COUNTRY, 2018-2026 ($MILLION)
TABLE 51.    LATIN AMERICA DEWATERING PUMPS MARKET, BY TYPE, 2018-2026 ($MILLION)
TABLE 52.    LATIN AMERICA DEWATERING PUMPS MARKET, BY APPLICATION, 2018-2026 ($MILLION)
TABLE 53.    MIDDLE-EAST DEWATERING PUMPS MARKET, BY TYPE, 2018-2026 ($MILLION)
TABLE 54.    MIDDLE-EAST DEWATERING PUMPS MARKET, BY APPLICATION, 2016–2025 ($MILLION)
TABLE 55.    AFRICA DEWATERING PUMPS MARKET, BY TYPE, 2018-2026 ($MILLION)
TABLE 56.    AFRICA DEWATERING PUMPS MARKET, BY APPLICATION, 2018-2026 ($MILLION)
TABLE 57.    KEY NEW PRODUCT LAUNCHES (2015-2018)
TABLE 58.    KEY EXPANSIONS (2015-2018)
TABLE 59.    KEY MERGERS AND ACQUISITION (2015-2018)
TABLE 60.    OTHER KEY DEVELOPMENTS (2015-2018)
TABLE 61.    ATLAS COPCO: KEY EXECUTIVES
TABLE 62.    ATLAS COPCO: COMPANY SNAPSHOT
TABLE 63.    ATLAS COPCO: OPERATING SEGMENTS
TABLE 64.    ATLAS COPCO: PRODUCT PORTFOLIO
TABLE 65.    EBARA: KEY EXECUTIVES
TABLE 66.    EBARA: COMPANY SNAPSHOT
TABLE 67.    EBARA: OPERATING SEGMENTS
TABLE 68.    EBARA: PRODUCT PORTFOLIO
TABLE 69.    FLOWSERVE: KEY EXECUTIVES
TABLE 70.    FLOWSERVE: COMPANY SNAPSHOT
TABLE 71.    FLOWSERVE: OPERATING SEGMENTS
TABLE 72.    FLOWSERVE: PRODUCT PORTFOLIO
TABLE 73.    GRUNDFOS: KEY EXECUTIVES
TABLE 74.    GRUNDFOS: COMPANY SNAPSHOT
TABLE 75.    GRUNDFOS: PRODUCT PORTFOLIO
TABLE 76.    ITT: KEY EXECUTIVES
TABLE 77.    ITT: COMPANY SNAPSHOT
TABLE 78.    ITT: OPERATING SEGMENTS
TABLE 79.    ITT: PRODUCT PORTFOLIO
TABLE 80.    KSB: KEY EXECUTIVES
TABLE 81.    KSB: COMPANY SNAPSHOT
TABLE 82.    KSB: PRODUCT PORTFOLIO
TABLE 83.    KSB: PRODUCT PORTFOLIO
TABLE 84.    SULZER: KEY EXECUTIVES
TABLE 85.    SULZER: COMPANY SNAPSHOT
TABLE 86.    SULZER: PRODUCT PORTFOLIO
TABLE 87.    GORMAN-RUPP: KEY EXECUTIVES
TABLE 88.    GORMAN-RUPP: COMPANY SNAPSHOT
TABLE 89.    GORMAN-RUPP: PRODUCT CATEGORY
TABLE 90.    GORMAN-RUPP: PRODUCT PORTFOLIO
TABLE 91.    WEIR: KEY EXECUTIVES
TABLE 92.    WEIR: COMPANY SNAPSHOT
TABLE 93.    WEIR: OPERATING SEGMENTS
TABLE 94.    WEIR: PRODUCT PORTFOLIO
TABLE 95.    XYLEM: KEY EXECUTIVES
TABLE 96.    XYLEM: COMPANY SNAPSHOT
TABLE 97.    XYLEM: OPERATING BUSINESS SEGMENTS
TABLE 98.    XYLEM: PRODUCT PORTFOLIO

LIST OF FIGURES

FIGURE 01.    KEY MARKET SEGMENTS
FIGURE 02.    GLOBAL DEWATERING PUMPS MARKET, 2018-2026
FIGURE 03.    GLOBAL DEWATERING PUMPS MARKET, BY COUNTRY, 2018-2026
FIGURE 04.    GLOBAL DEWATERING PUMPS MARKET: KEY PLAYERS
FIGURE 05.    TOP IMPACTING FACTORS
FIGURE 06.    TOP INVESTMENT POCKETS
FIGURE 07.    VALUE CHAIN ANALYSIS
FIGURE 08.    SMILING CURVE VALUE CHAIN MODEL
FIGURE 09.    GLOBAL DEWATERING PUMPS MARKET, BY TYPE, 2019-2026
FIGURE 10.    COMPARATIVE SHARE ANALYSIS OF SUBMERSIBLE DEWATERING PUMPS DEWATERING PUMPS MARKET, BY COUNTRY, 2018 & 2026 (%)
FIGURE 11.    COMPARATIVE SHARE ANALYSIS OF NON-SUBMERSIBLE DEWATERING PUMPS DEWATERING PUMPS MARKET, BY COUNTRY, 2018 & 2026 (%)
FIGURE 12.    GLOBAL DEWATERING PUMPS MARKET, BY APPLICATION, 2019-2026
FIGURE 13.    COMPARATIVE SHARE ANALYSIS OF DEWATERING PUMPS DEWATERING PUMPS MARKET, FOR CONSTRUCTION AND AGRICULTURE, BY COUNTRY, 2018 & 2026 (%)
FIGURE 14.    COMPARATIVE SHARE ANALYSIS OF DEWATERING PUMPS MARKET, FOR MINERAL & MINING, BY COUNTRY, 2018 & 2026 (%)
FIGURE 15.    COMPARATIVE SHARE ANALYSIS OF DEWATERING PUMPS MARKET IN OIL & GAS, BY COUNTRY, 2018 & 2026 (%)
FIGURE 16.    COMPARATIVE SHARE ANALYSIS OF DEWATERING PUMPS MARKET IN MUNICIPAL, BY COUNTRY, 2018 & 2026 (%)
FIGURE 17.    COMPARATIVE SHARE ANALYSIS OF DEWATERING PUMPS MARKET IN INDUSTRIAL, BY COUNTRY, 2018 & 2026 (%)
FIGURE 18.    MARKET PLAYER POSITIONING, 2017
FIGURE 19.    TOP WTOP WINNING STRATEGIES, BY YEAR, 2015–2018
FIGURE 20.    TOP WINNING STRATEGIES, BY DEVELOPMENT, 2015–2018 (%)
FIGURE 21.    TOP WINNING STRATEGIES, BY COMPANY, 2015–2018
FIGURE 22.    PRODUCT MAPPING OF TOP 10 PLAYERS
FIGURE 23.    COMPETITIVE DASHBOARD
FIGURE 24.    COMPETITIVE HEATMAP OF KEY PLAYERS
FIGURE 25.    ATLAS COPCO: R&D EXPENDITURE, 2016–2018 ($MILLION)
FIGURE 26.    ATLAS COPCO: NET SALES, 2016–2018 ($MILLION)
FIGURE 27.    ATLAS COPCO: REVENUE SHARE BY SEGMENTS, 2018 (%)
FIGURE 28.    ATLAS COPCO: REVENUE SHARE BY GEOGRAPHY, 2018 (%)
FIGURE 01.    EBARA: R&D EXPENDITURE, 2016–2018 ($MILLION)
FIGURE 02.    EBARA: NET SALES, 2016–2018 ($MILLION)
FIGURE 03.    EBARA: REVENUE SHARE BY SEGMENT, 2018 (%)
FIGURE 04.    EBARA: REVENUE SHARE BY GEOGRAPHY, 2018 (%)
FIGURE 05.    FLOWSERVE: R&D EXPENDITURE, 2016–2018 ($MILLION)
FIGURE 06.    FLOWSERVE: NET SALES, 2016–2018 ($MILLION)
FIGURE 07.    FLOWSERVE: REVENUE SHARE BY SEGMENT, 2018 (%)
FIGURE 08.    FLOWSERVE CORPORATION: REVENUE BY CUSTOMERS, 2016-2018 ($MILLION)
FIGURE 09.    FLOWSERVE: REVENUE SHARE BY GEOGRAPHY, 2018 (%)
FIGURE 10.    GRUNDFOS: R&D EXPENDITURE, 2016–2018 ($MILLION)
FIGURE 11.    GRUNDFOS: NET SALES, 2016–2018 ($MILLION)
FIGURE 12.    GRUNDFOS: REVENUE SHARE BY GEOGRAPHY, 2018 (%)
FIGURE 13.    ITT: R&D EXPENDITURE, 2016–2018 ($MILLION)
FIGURE 14.    ITT: NET SALES, 2016–2018 ($MILLION)
FIGURE 15.    ITT: REVENUE SHARE BY SEGMENT, 2018 (%)
FIGURE 16.    ITT: REVENUE SHARE BY END MARKETS, 2018 (%)
FIGURE 17.    ITT: REVENUE SHARE BY GEOGRAPHY, 2018 (%)
FIGURE 18.    KSB: R&D EXPENDITURE, 2016–2018 ($MILLION)
FIGURE 19.    KSB: NET SALES, 2016–2018 ($MILLION)
FIGURE 20.    KSB: REVENUE SHARE BY SEGMENT, 2018 (%)
FIGURE 21.    SULZER: NET SALES, 2016–2018 ($MILLION)
FIGURE 22.    SULZER: REVENUE SHARE BY SEGMENT, 2018 (%)
FIGURE 23.    SULZER: REVENUE SHARE BY GEOGRAPHY, 2018 (%)
FIGURE 24.    SULZER: REVENUE SHARE BY END MARKETS, 2018 (%)
FIGURE 25.    GORMAN-RUPP: NET SALES, 2016–2018 ($MILLION)
FIGURE 26.    GORMAN-RUPP: REVENUE SHARE BY PRODUCT CATEGORY, 2018 (%)
FIGURE 27.    GORMAN-RUPP: REVENUE SHARE BY GEOGRAPHY, 2018 (%)
FIGURE 28.    WEIR: R&D EXPENDITURE, 2016–2018 ($MILLION)
FIGURE 29.    WEIR: NET SALES, 2016–2018 ($MILLION)
FIGURE 30.    WEIR: REVENUE SHARE BY SEGMENT, 2018 (%)
FIGURE 31.    WEIR: REVENUE SHARE BY GEOGRAPHY, 2018 (%)
FIGURE 32.    XYLEM: R&D EXPENDITURE, 2016–2018 ($MILLION)
FIGURE 33.    XYLEM: NET SALES, 2016–2018 ($MILLION)
FIGURE 34.    XYLEM: REVENUE SHARE BY SEGMENT, 2018 (%)
FIGURE 35.    XYLEM: REVENUE SHARE BY GEOGRAPHY, 2018 (%)


The global dewatering pumps market holds high potential in the construction and agriculture industry, due to the expansion of construction sector globally. The current business scenario experiences rapid development in the oil & gas sector, leading to increased adoption of dewatering pumps, particularly in the developed regions such as North America and Europe.  

Improved efficiency and high durability of dewatering pumps are some of the major drivers for this market. However, high cost and unstable prices of raw material impede the growth of this market. In the near future, rise in demand for dewatering pumps is expected to be witnessed, due to expansion of construction industry globally. This factor is expected to create lucrative opportunities for the key players operating in the dewatering pumps market. Moreover, rise in demand for dewatering pumps in municipalities is expected to fuel the growth of the dewatering pumps market in the near future. 

Based on study of the regions, Asia-Pacific is expected to account for the highest revenue in the global dewatering pumps market throughout the forecast period, followed by Europe, North America, and LAMEA.

The key companies have focused on product launch and joint venture to strengthen their foothold in the market. For instance, Grundfos Pumps Korea, ChungSuk, and Keum Jung Industrial, the subsidiaries of Grundfos, merged to form a joint venture company called Grundfos Pumps Korea. The joint venture was aimed at provide integrated design and development of dewatering pumps as well as to expand the business in the Republic of Korea.


PURCHASE OPTIONS

Call or Email us

U.S.-Canada Toll-free: +1-800-792-5285
Int'l : +1-503-894-6022
Europe : +44-845-528-1300
Email : help@alliedmarketresearch.com

Looking for Customization?

 Customization Request

Have a Question?

 Speak with Analyst

Any Confusion?

 Inquire Before Buying

Have a glance of the Report

  Request Sample
RELATED TAGS

Purchase Full Report of
Dewatering Pumps Market

Start reading instantly.
This Report and over 66,804+ more Reports, Available with Avenue Library. T&C*.

  • Online Only
  • $3,456
  • Online cloud access only
  • Restricted print, copy, paste & download
  • Read only
  • Free industry update
    (Within 180 days)
  • Free report update in next update cycle
    (Jul 2020 - Jul 2021)
  • Data Pack
  • $3,840
  • Restricted to one authorized user
  • One print only
  • Available in
    Excel
  • Free industry update
    (Within 180 days)
  •   Free report update in next update cycle
    (Jul 2020 - Jul 2021)
  • Single User
  • $5,769
  • Restricted to one authorized user
  • One print only
  • Available in
    PDF
  • Free industry update
    (Within 180 days)
  •   Free report update in next update cycle
    (Jul 2020 - Jul 2021)
  • Five Users
  • $6,450
  • Limited to five authorized users
  • Print upto five copies
  • Available in
    PDF
  • Free industry update
    (Within 180 days)
  •   Free report update in next update cycle
    (Jul 2020 - Jul 2021)
  • Enterprise
    License/PDF

  • $10,995
  • Unlimited
    within
    company/enterprise
  • Available in Excel & PDF
  • Free industry update
    (Within 180 days)
  •   Free report update in next update cycle
    (Jul 2020 - Jul 2021)
  • Library
    Membership

  • $999 $ 1,175
    Per User/ Per month/ Billed annually
  • Published Content
    E-access
  • Company Profiles
    E-access
  • Newly Added Content Access
  • 10 PDF
    Downloads
  • 5 Excel Data
    Pack Downloads
  • 250 Company Profiles PDF Downloads
  • Buy Now

*Taxes/Fees, if applicable will be added during checkout. All prices in USD

RELATED REPORTS
 

Why Allied Market Research?


Infallible Methodology

To ensure high-level data integrity, accurate analysis, and impeccable forecasts

Analyst Support

For complete satisfaction

Customization

On-demand customization of scope of the report to exactly meet your needs

TARGETED MARKET VIEW

Targeted market view to provide pertinent information and save time of readers

Get fresh content delivered

Get insights on topics that are crucial for your business. Stay abreast of your interest areas.

Get Industry Data Alerts

Why Allied Market Research?

Infallible Methodology

To ensure high-level data integrity, accurate analysis, and impeccable forecasts

Analyst Support

For complete satisfaction

Customization

On-demand customization of scope of the report to exactly meet your needs

TARGETED MARKET VIEW

Targeted market view to provide pertinent information and save time of readers