0
2019
Dialyzer Market

Dialyzer Market

by Type (High-Flux Dialyzer and Low-Flux Dialyzer) and End User (In-Center and Home Dialysis): Global Opportunity Analysis and Industry Forecast, 2018 - 2025

Report Code: A02311
Mar 2019 | Pages: 192
Tables: 123
Charts: 42
  • Formats*:

  • pdf

    Single User License, Five User
    License & Enterprise User License

  • xls

    Data Pack Excel License

  • ppt

    It comes with the additional cost
    of $2500.00 contact sales.


COVID-19

Pandemic disrupted the entire world and affected many industries.

Get detailed COVID-19 impact analysis on the Dialyzer Market

Request Now !

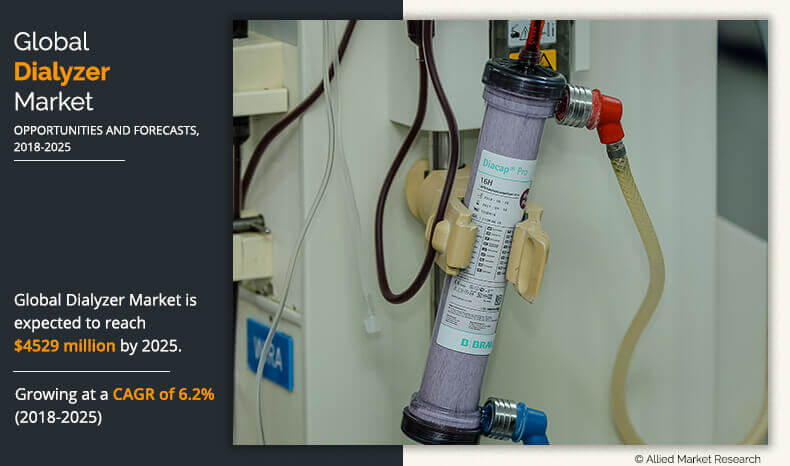
Dialyzer Market Outlook - 2025

The global dialyzer market size was valued at $2,810 million in 2017 and is estimated to reach $4,529 million by 2025, registering a CAGR of 6.2 % from 2018 to 2025.

A dialyzer is a medical device that replaces the function of kidney by removing excess water and metabolic waste products from the blood using an artificial membrane, often known as hollow fiber. Dialyzers are primarily used by the medical professionals while performing hemodialysis. Hemodialysis is a medical procedure used to remove waste from the blood of the patients with chronic or acute kidney failure. Waste removal helps to maintain electrolyte balance in the patient’s body. It also prevents accumulation of salts and wastes in blood, which is expected to lead to poisoning.

The significant increase in geriatric population and rise in incidence of renal diseases, especially end stage renal disease (ESRD) are the major factors that drive the growth of the global dialyzer market. In addition, increase in funding for improved dialysis products and services, rise in incidence of diabetes and hypertension, and shortage of kidneys for transplantation are expected to further propel the market growth. Although the dialyzer market trends continue to grow, certain factors hamper the growth of this market. The complications and risks associated with the procedure of hemodialysis, such as severe anemia and fluid overload, hamper the market growth. Conversely, technological advancements leading to better adoption and opportunities in emerging economies are anticipated to offer growth opportunities for the global dialyzer market.
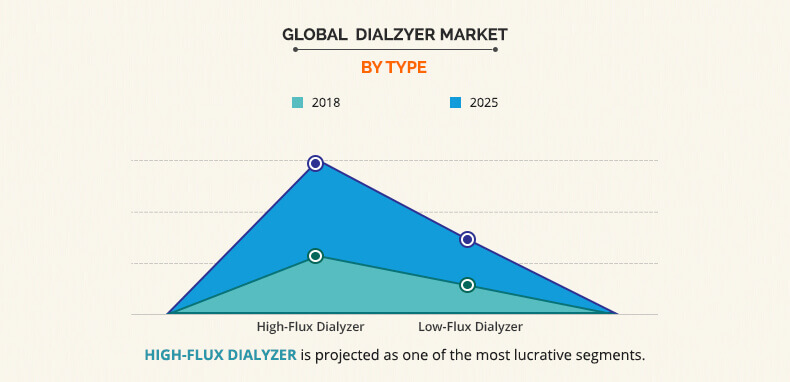
Type segment review

Based on dialyzer market analysis by type, the market is categorized into high-flux dialyzer and low-flux dialyzer. The high-flux dialyzer segment was the highest contributor to the market in 2017 and is anticipated to grow at the fastest rate during the forecast period as more efficient in the removal of larger molecules while performing dialysis as compared to the low-flux dialyzer. In addition, its use is eventually based on the need to reduce the high morbidity and mortality of endstage renal disease (ESRD) patients maintained on conventional dialysis by offering better biocompatibility and enhanced removal of uremic toxins.

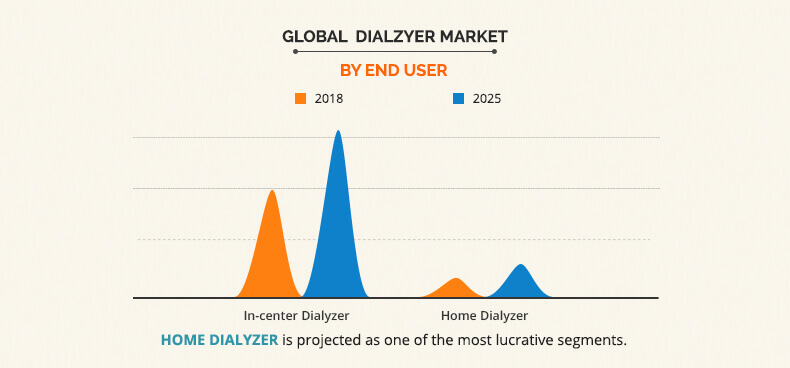
End User segment review

Based on end user, the dialyzer market is bifurcated into in-center dialysis and home dialysis. The in-center dialysis segment accounted for the highest dialyzer market share in 2017 and is projected to continue the same during the forecast period. This is attributed to the availability of trained medical staff in dialysis centers that helps to provide better services to the patient and contributes toward market growth of in-center dialysis. Furthermore, high quality care and management provided to the patient and use of high-grade equipment helps increase the revenue generated by this segment. However, the dialyzers used for home dialysis are anticipated to grow at the fastest CAGR during the forecast period, the emergence of advanced dialysis products with improved efficiency enables patients to opt for home dialysis thereby boosting the market growth. Moreover, new and easy-to-use machines are being developed for home hemodialysis by the leading manufacturers such as Fresenius Medical Care.

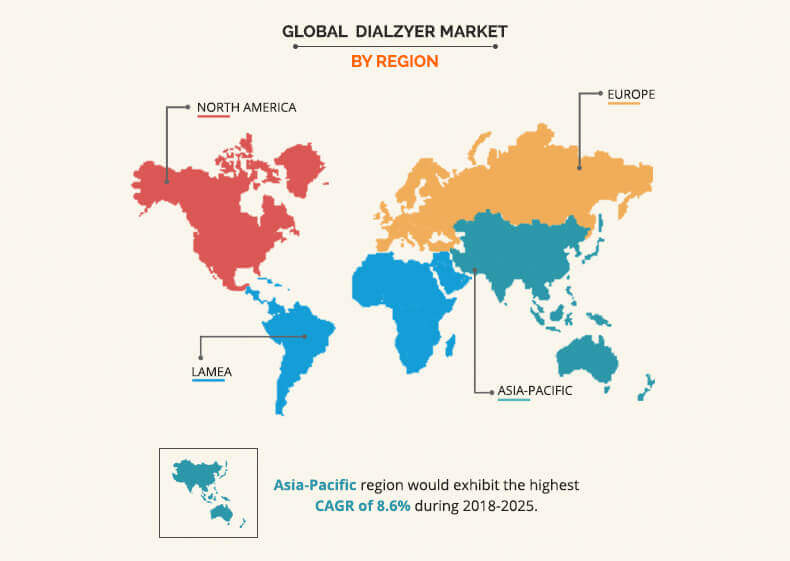
Region segment review

Based on region, the global dialyzer market is analyzed across North America, Europe, Asia-Pacific, and LAMEA. North America dominated the market in 2017, accounting for the highest market share, and is anticipated to maintain this trend throughout the forecast period. This is attributed to the significant rise in prevalence of end-stage renal disease (ESRD), diabetes, hypertension, and others in this region. However, as per dialyzer market forecast, Asia-Pacific is projected to register the highest growth rate from 2018 to 2025, owing to the increase in healthcare expenditure, improvements in healthcare infrastructure, and rise in medical tourism.

The report provides a comprehensive analysis of the leading companies operating in the global market such as Asahi Kasei Corporation, B. Braun Melsungen AG, Baxter International Inc., Browndove Healthcare (P) Ltd, Bain Medical Equipment, Fresenius Medical Care AG & Co. KGaA, Kawasumi Laboratories Inc., NIKKISO CO., LTD., Medtronic Plc. (Bellco), Jihua Medical Apparatus & Instruments Co., Ltd, Allmed Medical Care Holdings Limited, Weigao group, Farmasol, China Chengdu Wesley Biotech Co., Ltd, Toray Industries, Inc., Medica Group, JMS Co. Ltd, Jiangsu Lengthen Life Science and Technology Co., Ltd, Medivators, Inc. and Dialifegroup.

Key Benefits For Dialyzer Market:

  • The study provides an in-depth analysis dialyzer market share with the current trends and future estimations to elucidate the imminent investment pockets.
  • A comprehensive analysis of the factors that drive and restrict the dialyzer market growth is provided.
  • A comprehensive quantitative analysis of the industry is provided from 2018 to 2025 to assist stakeholders to capitalize on the prevailing market opportunities.
  • An extensive analysis of the key segments of the industry helps understand the market trends.
  • Key players and their strategies are provided to understand the competitive outlook of the industry.

Dialyzer Key Market Segments:

By Type

  • High-Flux
  • Low-Flux

By End User

  • In Center Dialyzer
  • Home Dialyzer

By Region

  • North America
    • U.S.
    • Canada
    • Mexico
  • Europe
    • UK
    • France
    • Germany
    • Italy
    • Spain
    • Russia
    • Austria
    • Rest of Europe
  • Asia-Pacific
    • Japan
    • China
    • India
    • South Korea
    • Australia
    • Taiwan
    • Thailand
    • Malaysia
    • Indonesia
    • Rest of Asia-Pacific
  • LAMEA
    • Saudi Arabia
    • South Africa
    • Turkey
    • Brazil
    • Rest of LAMEA

Dialyzer Market Report Highlights

Aspects Details
By Type
  • High-flux dialyzer
  • Low-Flux Dialyzer
By END USER
  • In-Center Dialysis
  • Home Dialysis
By Region
  • North America  (U.S., Canada, Mexico)
  • Europe  (France, Germany, Italy, Spain, UK, Russia, Rest of Europe)
  • Asia-Pacific  (China, Japan, India, South Korea, Australia, Thailand, Malaysia, Indonesia, Rest of Asia-Pacific)
  • LAMEA  (Brazil, South Africa, Saudi Arabia, UAE, Argentina, Rest of LAMEA)
Key Market Players JIHUA MEDICAL APPARATUS & INSTRUMENTS CO., LTD, BAXTER INTERNATIONAL INC., MEDIVATORS, INC., FARMASOL, MEDTRONIC PLC. (BELCO), TORAY INDUSTRIES, INC., WEIGAO GROUP, BROWNDOVE HEALTHCARE (P) LTD., JMS CO. LTD., ASAHI KASEI CORPORATION, FRESENIUS MEDICAL CARE AG & CO. KGAA, DIALIFEGROUP.COM, NIKKISO CO., LTD., CHINA CHENGDU WESLEY BIOTECH CO., LTD, KAWASUMI LABORATORIES INC., MEDICA GROUP, ALLMED MEDICAL CARE HOLDINGS LIMITED, B. BRAUN MELSUNGEN AG, JIANGSU LENGTHEN LIFE SCIENCE AND TECHNOLOGY CO., LTD, BAIN MEDICAL EQUIPMENT
 

CHAPTER 1:    INTRODUCTION

1.1.    Report description
1.2.    Key Benefits for Stakeholders
1.3.    Key Market Segments

1.3.1.    List of players profiled in the report

1.4.    Research Methodology

1.4.1.    Secondary research
1.4.2.    Primary research
1.4.3.    Analyst tools and models

CHAPTER 2:    EXECUTIVE SUMMARY

2.1.    Key Findings of the Study
2.2.    CXO perspective

CHAPTER 3:    MARKET OVERVIEW

3.1.    Market Definition and Scope
3.2.    Key Findings

3.2.1.    Top investment pockets

3.3.    Porter’s five forces analysis
3.4.    Market share analysis, 2017
3.5.    Market Dynamics

3.5.1.    Drivers

3.5.1.1.    Significant surge in the number of ESRD patients
3.5.1.2.    Rise in incidence of diabetes and hypertension
3.5.1.3.    Shortage of kidneys for transplantation

3.5.2.    Restraints

3.5.2.1.    Risks and complications associated with dialyzers reuse
3.5.2.2.    High cost associated with the hemodialysis

3.5.3.    Opportunities

3.5.3.1.    Technological advancements leading to better adoption

3.6.    Patent Analysis (2016-2018)

3.6.1.    Patent analysis, by year

3.7.    Clinical Trials for Dialyzers

CHAPTER 4:    DIALYZER MARKET, BY TYPE

4.1.    Overview

4.1.1.    Market size and forecast

4.2.    High-flux dialyzer

4.2.1.    Key market trends and opportunities
4.2.2.    Market size and forecast, by region
4.2.3.    Market analysis, by country

4.3.    Low-Flux Dialyzer

4.3.1.    Key market trends and opportunities
4.3.2.    Market size and forecast, by region
4.3.3.    Market analysis, by country

CHAPTER 5:    DIALYZER MARKET, BY END USER

5.1.    Overview

5.1.1.    Market size and forecast

5.2.    In-Center Dialysis

5.2.1.    Market analysis, by country

5.3.    Home Dialysis

5.3.1.    Market analysis, by country

CHAPTER 6:    DIALYZER MARKET BY REGION

6.1.    Overview

6.1.1.    Market size and forecast

6.2.    North America

6.2.1.    Key market trends, growth factors, and opportunities
6.2.2.    Market size and forecast, by country

6.2.2.1.    U.S. dialyzer market, by type
6.2.2.2.    U.S. dialyzer market, by end user
6.2.2.3.    Canada dialyzer market, by type
6.2.2.4.    Canada dialyzer market, by end user
6.2.2.5.    Mexico dialyzer market, by type
6.2.2.6.    Mexico dialyzer market, by end user

6.2.3.    North America dialyzer market, by type
6.2.4.    North America dialyzer market, by end user

6.3.    Europe

6.3.1.    Key market trends, growth factors, and opportunities
6.3.2.    Market size and forecast, by country

6.3.2.1.    Germany dialyzer market, by type
6.3.2.2.    Germany dialyzer market, by end user
6.3.2.3.    France dialyzer market, by type
6.3.2.4.    France dialyzer market, by end user
6.3.2.5.    UK dialyzer market, by type
6.3.2.6.    UK dialyzer market, by end user
6.3.2.7.    Italy dialyzer market, by type
6.3.2.8.    Italy dialyzer market, by end user
6.3.2.9.    Spain dialyzer market, by type
6.3.2.10.    Spain dialyzer market, by end user
6.3.2.11.    Russia dialyzer market, by type
6.3.2.12.    Russia dialyzer market, by end user
6.3.2.13.    Austria dialyzer market, by type
6.3.2.14.    Austria dialyzer market, by end user
6.3.2.15.    Rest of Europe dialyzer market, by type
6.3.2.16.    Rest of Europe dialyzer market, by end user

6.3.3.    Europe dialyzer market, by type
6.3.4.    Europe dialyzer market, by end user

6.4.    Asia-Pacific

6.4.1.    Key market trends and opportunities
6.4.2.    Market size and forecast, by country

6.4.2.1.    Japan dialyzer market, by type
6.4.2.2.    Japan dialyzer market, by end user
6.4.2.3.    China dialyzer market, by type
6.4.2.4.    China dialyzer market, by end user
6.4.2.5.    India dialyzer market, by type
6.4.2.6.    India dialyzer market, by end user
6.4.2.7.    Australia dialyzer market, by type
6.4.2.8.    Australia dialyzer market, by end user
6.4.2.9.    South Korea dialyzer market, by type
6.4.2.10.    South Korea dialyzer market, by end user
6.4.2.11.    Taiwan dialyzer market, by type
6.4.2.12.    Taiwan dialyzer market, by end user
6.4.2.13.    Thailand dialyzer market, by type
6.4.2.14.    Thailand dialyzer market, by end user
6.4.2.15.    Malaysia dialyzer market, by type
6.4.2.16.    Malaysia dialyzer market, by end user
6.4.2.17.    Indonesia dialyzer market, by type
6.4.2.18.    Indonesia dialyzer market, by end user
6.4.2.19.    Rest of Asia-Pacific dialyzer market, by type
6.4.2.20.    Rest of Asia-Pacific dialyzer market, by end user

6.4.3.    Asia-Pacific dialyzer market, by type
6.4.4.    Asia-Pacific dialyzer market, by end user

6.5.    LAMEA

6.5.1.    Key market trends and opportunities
6.5.2.    Market size and forecast, by country

6.5.2.1.    Brazil dialyzer market, by type
6.5.2.2.    Brazil dialyzer market, by end user
6.5.2.3.    Saudi Arabia dialyzer market, by type
6.5.2.4.    Saudi Arabia dialyzer market, by end user
6.5.2.5.    South Africa dialyzer market, by type
6.5.2.6.    South Africa dialyzer market, by end user
6.5.2.7.    Turkey dialyzer market, by type
6.5.2.8.    Turkey dialyzer market, by end user
6.5.2.9.    Rest of LAMEA dialyzer market, by type
6.5.2.10.    Rest of LAMEA dialyzer market, by end user

6.5.3.    LAMEA dialyzer market, by type
6.5.4.    LAMEA dialyzer market, by end user

CHAPTER 7:    COMPANY PROFILES

7.1.    ASAHI KASEI CORPORATION

7.1.1.    Company overview
7.1.2.    Company snapshot
7.1.3.    Operating business segments
7.1.4.    Product Portfolio
7.1.5.    Business performance

7.2.    B. BRAUN MELSUNGEN AG

7.2.1.    Company overview
7.2.2.    Company snapshot
7.2.3.    Operating business segments
7.2.4.    Product Portfolio
7.2.5.    Business performance
7.2.6.    Key strategic moves and developments

7.3.    BAXTER INTERNATIONAL INC.

7.3.1.    Company overview
7.3.2.    Company snapshot
7.3.3.    Operating business segments
7.3.4.    Product Portfolio
7.3.5.    Business performance
7.3.6.    Key strategic moves and developments

7.4.    BROWNDOVE HEALTHCARE (P) LTD.

7.4.1.    Company overview
7.4.2.    Company snapshot
7.4.3.    Operating business segments
7.4.4.    Product portfolio

7.5.    BAIN MEDICAL EQUIPMENT

7.5.1.    Company overview
7.5.2.    Company snapshot
7.5.3.    Product Portfolio

7.6.    FRESENIUS MEDICAL CARE AG & CO. KGAA

7.6.1.    Company overview
7.6.2.    Company snapshot
7.6.3.    Operating business segments
7.6.4.    Product Portfolio
7.6.5.    Business performance
7.6.6.    Key strategic moves and developments

7.7.    KAWASUMI LABORATORIES INC.

7.7.1.    Company overview
7.7.2.    Company snapshot
7.7.3.    Operating business segment
7.7.4.    Product Portfolio
7.7.5.    Business performance

7.8.    MEDTRONIC PLC. (BELCO)

7.8.1.    Company overview
7.8.2.    Company snapshot
7.8.3.    Operating business segments
7.8.4.    Product portfolio
7.8.5.    Business performance
7.8.6.    Key strategic moves and developments

7.9.    NIKKISO CO., LTD.

7.9.1.    Company overview
7.9.2.    Company snapshot
7.9.3.    Operating business segments
7.9.4.    Product Portfolio
7.9.5.    Business performance

7.10.    JIHUA MEDICAL APPARATUS & INSTRUMENTS CO., LTD

7.10.1.    Company overview
7.10.2.    Company snapshot
7.10.3.    Operating business segments
7.10.4.    Product Portfolio

7.11.    ALLMED MEDICAL CARE HOLDINGS LIMITED

7.11.1.    Company overview
7.11.2.    Company snapshot
7.11.3.    Operating business segments
7.11.4.    Product Portfolio

7.12.    WEIGAO GROUP

7.12.1.    Company overview
7.12.2.    Company snapshot
7.12.3.    Operating business segments
7.12.4.    Product Portfolio
7.12.5.    Business performance

7.13.    FARMASOL

7.13.1.    Company overview
7.13.2.    Company snapshot
7.13.3.    Operating business segments
7.13.4.    Product Portfolio

7.14.    CHINA CHENGDU WESLEY BIOTECH CO., LTD

7.14.1.    Company overview
7.14.2.    Company snapshot
7.14.3.    Operating business segments
7.14.4.    Product Portfolio

7.15.    TORAY INDUSTRIES, INC.

7.15.1.    Company overview
7.15.2.    Company snapshot
7.15.3.    Operating business segments
7.15.4.    Product Portfolio
7.15.5.    Business performance

7.16.    MEDICA GROUP

7.16.1.    Company overview
7.16.2.    Company snapshot
7.16.3.    Operating business segments
7.16.4.    Product Portfolio

7.17.    JMS CO. LTD.

7.17.1.    Company overview
7.17.2.    Company snapshot
7.17.3.    Operating business segments
7.17.4.    Product Portfolio
7.17.5.    Business performance

7.18.    JIANGSU LENGTHEN LIFE SCIENCE AND TECHNOLOGY CO., LTD

7.18.1.    Company overview
7.18.2.    Company snapshot
7.18.3.    Operating business segments
7.18.4.    Product Portfolio

7.19.    MEDIVATORS, INC.

7.19.1.    Company overview
7.19.2.    Company snapshot
7.19.3.    Operating business segments
7.19.4.    Product Portfolio

7.20.    DIALIFEGROUP.COM

7.20.1.    Company overview
7.20.2.    Company snapshot
7.20.3.    Operating business segments
7.20.4.    Product Portfolio

LIST OF TABLES

TABLE 01.    CLINICAL TRIALS FOR DIALYZERS (2014-2017)
TABLE 02.    DIALYZER MARKET, BY TYPE, 2017–2025 ($MILLION)
TABLE 03.    HIGH-FLUX DIALYZER MARKET, BY REGION, 2017–2025 ($MILLION)
TABLE 04.    GLOBAL LOW-FLUX DIALYZER MARKET, BY REGION, 2017–2025 ($MILLION)
TABLE 05.    GLOBAL DIALYZER MARKET, BY END USER, 2017–2025 ($MILLION)
TABLE 06.    IN-CENTER DIALYSIS MARKET, BY REGION, 2017–2025 ($MILLION)
TABLE 07.    HOME DIALYSIS MARKET, BY REGION, 2017–2025 ($MILLION)
TABLE 08.    DIALYZER MARKET, BY REGION, 2017–2025 ($MILLION)
TABLE 09.    NORTH AMERICA DIALYZER MARKET, BY COUNTRY, 2017–2025 ($MILLION)
TABLE 10.    U.S. DIALYZER MARKET, BY TYPE, 2017–2025 ($MILLION)
TABLE 11.    U.S. DIALYZER MARKET, BY END USER, 2017–2025 ($MILLION)
TABLE 12.    CANADA DIALYZER MARKET, BY TYPE, 2017–2025 ($MILLION)
TABLE 13.    CANADA DIALYZER MARKET, BY END USER, 2017–2025 ($MILLION)
TABLE 14.    MEXICO DIALYZER MARKET, BY TYPE, 2017–2025 ($MILLION)
TABLE 15.    MEXICO DIALYZER MARKET, BY END USER, 2017–2025 ($MILLION)
TABLE 16.    NORTH AMERICA DIALYZER MARKET, BY TYPE, 2017–2025 ($MILLION)
TABLE 17.    NORTH AMERICA DIALYZER MARKET, BY END USER, 2017–2025 ($MILLION)
TABLE 18.    EUROPE DIALYZER MARKET, BY COUNTRY, 2017–2025 ($MILLION)
TABLE 19.    GERMANY DIALYZER MARKET, BY TYPE, 2017–2025 ($MILLION)
TABLE 20.    GERMANY DIALYZER MARKET, BY END USER, 2017–2025 ($MILLION)
TABLE 21.    FRANCE DIALYZER MARKET, BY TYPE, 2017–2025 ($MILLION)
TABLE 22.    FRANCE DIALYZER MARKET, BY END USER, 2017–2025 ($MILLION)
TABLE 23.    UK DIALYZER MARKET, BY TYPE, 2017–2025 ($MILLION)
TABLE 24.    UK DIALYZER MARKET, BY END USER, 2017–2025 ($MILLION)
TABLE 25.    ITALY DIALYZER MARKET, BY TYPE, 2017–2025 ($MILLION)
TABLE 26.    ITALY DIALYZER MARKET, BY END USER, 2017–2025 ($MILLION)
TABLE 27.    SPAIN DIALYZER MARKET, BY TYPE, 2017–2025 ($MILLION)
TABLE 28.    SPAIN DIALYZER MARKET, BY END USER, 2017–2025 ($MILLION)
TABLE 29.    RUSSIA DIALYZER MARKET, BY TYPE, 2017–2025 ($MILLION)
TABLE 30.    RUSSIA DIALYZER MARKET, BY END USER, 2017–2025 ($MILLION)
TABLE 31.    AUSTRIA DIALYZER MARKET, BY TYPE, 2017–2025 ($MILLION)
TABLE 32.    AUSTRIA DIALYZER MARKET, BY END USER, 2017–2025 ($MILLION)
TABLE 33.    REST OF EUROPE DIALYZER MARKET, BY TYPE, 2017–2025 ($MILLION)
TABLE 34.    REST OF EUROPE DIALYZER MARKET, BY END USER, 2017–2025 ($MILLION)
TABLE 35.    EUROPE DIALYZER MARKET, BY TYPE, 2017–2025 ($MILLION)
TABLE 36.    EUROPE DIALYZER MARKET, BY END USER, 2017–2025 ($MILLION)
TABLE 37.    ASIA-PACIFIC DIALYZER MARKET, BY COUNTRY, 2017–2025 ($MILLION)
TABLE 38.    JAPAN DIALYZER MARKET, BY TYPE, 2017–2025 ($MILLION)
TABLE 39.    JAPAN DIALYZER MARKET, BY END USER, 2017–2025 ($MILLION)
TABLE 40.    CHINA DIALYZER MARKET, BY TYPE, 2017–2025 ($MILLION)
TABLE 41.    CHINA DIALYZER MARKET, BY END USER, 2017–2025 ($MILLION)
TABLE 42.    INDIA DIALYZER MARKET, BY TYPE, 2017–2025 ($MILLION)
TABLE 43.    INDIA DIALYZER MARKET, BY END USER, 2017–2025 ($MILLION)
TABLE 44.    AUSTRALIA DIALYZER MARKET, BY TYPE, 2017–2025 ($MILLION)
TABLE 45.    AUSTRALIA DIALYZER MARKET, BY END USER, 2017–2025 ($MILLION)
TABLE 46.    SOUTH KOREA DIALYZER MARKET, BY TYPE, 2017–2025 ($MILLION)
TABLE 47.    SOUTH KOREA DIALYZER MARKET, BY END USER, 2017–2025 ($MILLION)
TABLE 48.    TAIWAN DIALYZER MARKET, BY TYPE, 2017–2025 ($MILLION)
TABLE 49.    TAIWAN DIALYZER MARKET, BY END USER, 2017–2025 ($MILLION)
TABLE 50.    THAILAND DIALYZER MARKET, BY TYPE, 2017–2025 ($MILLION)
TABLE 51.    THAILAND DIALYZER MARKET, BY END USER, 2017–2025 ($MILLION)
TABLE 52.    MALAYSIA DIALYZER MARKET, BY TYPE, 2017–2025 ($MILLION)
TABLE 53.    MALAYSIA DIALYZER MARKET, BY END USER, 2017–2025 ($MILLION)
TABLE 54.    INDONESIA DIALYZER MARKET, BY TYPE, 2017–2025 ($MILLION)
TABLE 55.    INDONESIA DIALYZER MARKET, BY END USER, 2017–2025 ($MILLION)
TABLE 56.    REST OF ASIA-PACIFIC DIALYZER MARKET, BY TYPE, 2017–2025 ($MILLION)
TABLE 57.    REST OF ASIA-PACIFIC DIALYZER MARKET, BY END USER, 2017–2025 ($MILLION)
TABLE 58.    ASIA-PACIFIC DIALYZER MARKET, BY TYPE, 2017–2025 ($MILLION)
TABLE 59.    ASIA-PACIFIC DIALYZER MARKET, BY END USER, 2017–2025 ($MILLION)
TABLE 60.    LAMEA DIALYZER MARKET, BY COUNTRY, 2017–2025 ($MILLION)
TABLE 61.    BRAZIL DIALYZER MARKET, BY TYPE, 2017–2025 ($MILLION)
TABLE 62.    BRAZIL DIALYZER MARKET, BY END USER, 2017–2025 ($MILLION)
TABLE 63.    SAUDI ARABIA DIALYZER MARKET, BY TYPE, 2017–2025 ($MILLION)
TABLE 64.    SAUDI ARABIA DIALYZER MARKET, BY END USER, 2017–2025 ($MILLION)
TABLE 65.    SOUTH AFRICA DIALYZER MARKET, BY TYPE, 2017–2025 ($MILLION)
TABLE 66.    SOUTH AFRICA DIALYZER MARKET, BY END USER, 2017–2025 ($MILLION)
TABLE 67.    TURKEY DIALYZER MARKET, BY TYPE, 2017–2025 ($MILLION)
TABLE 68.    TURKEY DIALYZER MARKET, BY END USER, 2017–2025 ($MILLION)
TABLE 69.    REST OF LAMEA DIALYZER MARKET, BY TYPE, 2017–2025 ($MILLION)
TABLE 70.    REST OF LAMEA DIALYZER MARKET, BY END USER, 2017–2025 ($MILLION)
TABLE 71.    LAMEA DIALYZER MARKET, BY TYPE, 2017–2025 ($MILLION)
TABLE 72.    LAMEA DIALYZER MARKET, BY END USER, 2017–2025 ($MILLION)
TABLE 73.    ASAHI KASEI: COMPANY SNAPSHOT
TABLE 74.    ASAHI KASEI: OPERATING SEGMENTS
TABLE 75.    ASAHI KASEI: PRODUCT PORTFOLIO
TABLE 76.    B. BRAUN: COMPANY SNAPSHOT
TABLE 77.    B. BRAUN: OPERATING SEGMENTS
TABLE 78.    B. BRAUN: PRODUCT PORTFOLIO
TABLE 79.    BAXTER: COMPANY SNAPSHOT
TABLE 80.    BAXTER: BUSINESS UNITS
TABLE 81.    BROWNDOVE: COMPANY SNAPSHOT
TABLE 82.    BROWNDOVE: PRODUCT PORTFOLIO
TABLE 83.    BAIN MEDICAL: COMPANY SNAPSHOT
TABLE 84.    BAIN MEDICAL: PRODUCT PORTFOLIO
TABLE 85.    FRESENIUS: COMPANY SNAPSHOT
TABLE 86.    FRESENIUS: OPERATING SEGMENTS
TABLE 87.    FRESENIUS: PRODUCT PORTFOLIO
TABLE 88.    KAWASUMI: COMPANY SNAPSHOT
TABLE 89.    KAWASUMI: OPERATING SEGMENT
TABLE 90.    KAWASUMI: PRODUCT PORTFOLIO
TABLE 91.    MEDTRONIC: COMPANY SNAPSHOT
TABLE 92.    MEDTRONIC: OPERATING SEGMENTS
TABLE 93.    MEDTRONIC: PRODUCT PORTFOLIO
TABLE 94.    NIKKISO: COMPANY SNAPSHOT
TABLE 95.    NIKKISO: OPERATING SEGMENTS
TABLE 96.    NIKKISO: PRODUCT PORTFOLIO
TABLE 97.    JIHUA: COMPANY SNAPSHOT
TABLE 98.    ALLMED MEDICAL CARE HOLDINGS LIMITED: COMPANY SNAPSHOT
TABLE 99.    ALLMED MEDICAL CARE HOLDINGS LIMITED: SEGMENTS
TABLE 100.    ALLMED MEDICAL CARE HOLDINGS LIMITED: PRODUCT PORTFOLIO
TABLE 101.    WEIGAO: COMPANY SNAPSHOT
TABLE 102.    WEIGAO: OPERATING SEGMENTS
TABLE 103.    WEIGAO: PRODUCT PORTFOLIO
TABLE 104.    FARMASOL: COMPANY SNAPSHOT
TABLE 105.    FARMASOL: PRODUCT PORTFOLIO
TABLE 106.    WESLEY BIOTECH: COMPANY SNAPSHOT
TABLE 107.    WESLEY BIOTECH: PRODUCT PORTFOLIO
TABLE 108.    TORAY: COMPANY SNAPSHOT
TABLE 109.    TORAY: OPERATING SEGMENTS
TABLE 110.    TORAY PRODUCT PORTFOLIO
TABLE 111.    MEDICA: COMPANY SNAPSHOT
TABLE 112.    TORAY: OPERATING SEGMENTS
TABLE 113.    MEDICA PRODUCT PORTFOLIO
TABLE 114.    JMS: COMPANY SNAPSHOT
TABLE 115.    JMS: OPERATING SEGMENTS
TABLE 116.    JMS: PRODUCT PORTFOLIO
TABLE 117.    LENGTHEN: COMPANY SNAPSHOT
TABLE 118.    LENGTHEN: PRODUCT PORTFOLIO
TABLE 119.    MEDIVATORS: COMPANY SNAPSHOT
TABLE 120.    MEDIVATORS: OPERATING SEGMENTS
TABLE 121.    MEDIVATORS: COMPANY SNAPSHOT
TABLE 122.    DIALIFE: COMPANY SNAPSHOT
TABLE 123.    DIALIFE: PRODUCT PORTFOLIO

LIST OF FIGURES

FIGURE 01.    DIALYZER MARKET SEGMENTATION
FIGURE 02.    TOP INVESTMENT POCKETS
FIGURE 03.    MODERATE BARGAINING POWER OF SUPPLIERS
FIGURE 04.    HIGH BARGAINING POWER OF BUYERS
FIGURE 05.    LOW THREAT OF SUBSTITUTION
FIGURE 06.    LOW THREAT OF NEW ENTRANTS
FIGURE 07.    LOW COMPETITIVE RIVALRY
FIGURE 08.    MARKET SHARE ANALYSIS, 2017
FIGURE 09.    MARKET DYNAMICS
FIGURE 10.    PATENTS REGISTERED/APPROVED IN THE WORLD, 2016-2018
FIGURE 11.    PATENTS ANALYSIS BY YEAR, 2016 THROUGH 2018
FIGURE 12.    COMPARATIVE ANALYSIS OF HIGH-FLUX DIALYZER MARKET, BY COUNTRY, 2017 & 2025 (%)
FIGURE 13.    COMPARATIVE ANALYSIS OF LOW-FLUX DIALYZER MARKET, BY COUNTRY, 2017 & 2025 (%)
FIGURE 14.    COMPARATIVE ANALYSIS OF IN-CENTER DIALYSIS DIALYZER MARKET, BY COUNTRY, 2017 & 2025 (%)
FIGURE 15.    HOME DIALYSIS MARKET, BY COUNTRY, 2017 & 2025 (%)
FIGURE 16.    NET SALES, 2015–2017 ($MILLION)
FIGURE 17.    ASAHI KASEI: NET SALES BY SEGMENT, 2017 (%)
FIGURE 18.    ASAHI KASEI: NET SALES BY REGION, 2017 (%)
FIGURE 19.    NET SALES, 2015–2017 ($MILLION)
FIGURE 20.    B. BRAUN: NET SALES BY DIVISION, 2017 (%)
FIGURE 21.    B. BRAUN: NET SALES BY REGION, 2017 (%)
FIGURE 22.    NET SALES, 2015–2017 ($MILLION)
FIGURE 23.    BAXTER: REVENUE SHARE BY BUSINESS UNIT, 2017 (%)
FIGURE 24.    BAXTER: REVENUE SHARE BY REGION, 2017 (%)
FIGURE 25.    FRESENIUS: NET SALES, 2015–2017 ($MILLION)
FIGURE 26.    FRESENIUS: NET SALES BY SEGMENT, 2017 (%)
FIGURE 27.    FRESENIUS: NET SALES BY REGION, 2017 (%)
FIGURE 28.    KAWASUMI: NET SALES, 2016–2017 ($MILLION)
FIGURE 29.    MEDTRONIC: NET SALES, 2016–2018 ($MILLION)
FIGURE 30.    MEDTRONIC: REVENUE SHARE BY SEGMENT, 2018 (%)
FIGURE 31.    MEDTRONIC: REVENUE SHARE BY REGION, 2018 (%)
FIGURE 32.    NET SALES, 2015–2017 ($MILLION)
FIGURE 33.    NIKKISO: NET SALES BY BUSINESS SEGMENT, 2017 (%)
FIGURE 34.    NIKKISO: NET SALES BY REGION, 2017 (%)
FIGURE 35.    REVENUES, 2016–2017 ($MILLION)
FIGURE 36.    WEIGAO: REVENUES BY SEGMENT, 2017 (%)
FIGURE 37.    WEIGAO: REVENUES BY REGION, 2017 (%)
FIGURE 38.    TORAY: REVENUES, 2017–2018 ($MILLION)
FIGURE 39.    TORAY: REVENUES BY SEGMENT, 2017 (%)
FIGURE 40.    TORAY: REVENUES BY REGION, 2017 (%)
FIGURE 41.    JMS: REVENUES, 2017–2018 ($MILLION)
FIGURE 42.    JMS: REVENUES BY SEGMENT, 2017 (%)


Dialyzer also termed as artificial kidney is a device that is used by the medical professionals while performing hemodialysis. Hemodialysis is the most popular and preferred form of treatment for chronic renal diseases and kidney failures. Hemodialysis can be performed in hospitals or in dialysis centers and even at home.

Rise in the incidence of kidney failures, surge in ESRD patients across the globe, increased occurrence of diabetes, surge in funding for the development of new products with advanced technology, and lack of matching donors for kidney transplantation are expected to propel the growth of the dialyzer market in the near future. However, lack of awareness about kidney diseases, product recall, and risks associated with the reuse of dialyzer are expected to hamper the market growth.

The adoption of hemodialysis is highest in North America owing to an increase in the adoption of dialyzers, high prevalence rate of renal disorders, and growth in disposable income among customers. The adoption rate in Asia-Pacific and LAMEA is expected to increase due to rise in disposable income, surge in the incidence rate of kidney failure, and growth of the geriatric population.

PURCHASE OPTIONS

Call or Email us

U.S.-Canada Toll-free: +1-800-792-5285
Int'l : +1-503-894-6022
Europe : +44-845-528-1300
Email : help@alliedmarketresearch.com

Looking for Customization?

 Customization Request

Have a Question?

 Speak with Analyst

Any Confusion?

 Inquire Before Buying

Have a glance of the Report

  Request Sample

Purchase Full Report of
Dialyzer Market

Start reading instantly.
This Report and over 66,804+ more Reports, Available with Avenue Library. T&C*.

  • Online Only
  • $3,456
  • Online cloud access only
  • Restricted print, copy, paste & download
  • Read only
  • Free industry update
    (Within 180 days)
  • Free report update in next update cycle
    (Mar 2020 - Mar 2021)
  • Data Pack
  • $3,840
  • Restricted to one authorized user
  • One print only
  • Available in
    Excel
  • Free industry update
    (Within 180 days)
  •   Free report update in next update cycle
    (Mar 2020 - Mar 2021)
  • Single User
  • $5,769
  • Restricted to one authorized user
  • One print only
  • Available in
    PDF
  • Free industry update
    (Within 180 days)
  •   Free report update in next update cycle
    (Mar 2020 - Mar 2021)
  • Five Users
  • $6,450
  • Limited to five authorized users
  • Print upto five copies
  • Available in
    PDF
  • Free industry update
    (Within 180 days)
  •   Free report update in next update cycle
    (Mar 2020 - Mar 2021)
  • Enterprise
    License/PDF

  • $10,995
  • Unlimited
    within
    company/enterprise
  • Available in Excel & PDF
  • Free industry update
    (Within 180 days)
  •   Free report update in next update cycle
    (Mar 2020 - Mar 2021)
  • Library
    Membership

  • $999 $ 1,175
    Per User/ Per month/ Billed annually
  • Published Content
    E-access
  • Company Profiles
    E-access
  • Newly Added Content Access
  • 10 PDF
    Downloads
  • 5 Excel Data
    Pack Downloads
  • 250 Company Profiles PDF Downloads
  • Buy Now

*Taxes/Fees, if applicable will be added during checkout. All prices in USD

RELATED REPORTS
 

Why Allied Market Research?


Infallible Methodology

To ensure high-level data integrity, accurate analysis, and impeccable forecasts

Analyst Support

For complete satisfaction

Customization

On-demand customization of scope of the report to exactly meet your needs

TARGETED MARKET VIEW

Targeted market view to provide pertinent information and save time of readers

Get fresh content delivered

Get insights on topics that are crucial for your business. Stay abreast of your interest areas.

Get Industry Data Alerts

Why Allied Market Research?

Infallible Methodology

To ensure high-level data integrity, accurate analysis, and impeccable forecasts

Analyst Support

For complete satisfaction

Customization

On-demand customization of scope of the report to exactly meet your needs

TARGETED MARKET VIEW

Targeted market view to provide pertinent information and save time of readers