0
Upcoming Allied Market Research
2023
Digital Mortgage Software Market

Digital Mortgage Software Market

by Component (Solutions, Services), by Type (Conventional Mortgages, Adjustable-Rate Mortgages, Fixed-Rate Mortgages, Government-Insured Mortgages, Government-Insured Mortgages), by Deployment (On-Premises, Cloud), by  End-User (Individual, Corporate) and by Enterprise Size (Large Enterprise, Small Medium Enterprises): Global Opportunity Analysis and Industry Forecast, 2023-2032

Report Code: A12740
Nov 2023 | Pages: NA
Tables: NA
Charts: NA
  • Formats*:

  • pdf

    Single User License, Five User
    License & Enterprise User License

  • xls

    Data Pack Excel License

  • ppt

    It comes with the additional cost
    of $2500.00 contact sales.


COVID-19

Pandemic disrupted the entire world and affected many industries.

Get detailed COVID-19 impact analysis on the Digital Mortgage Software Market

Request Now !

Digital Mortgage Software Market Outlook - 2030

Lenders use digital mortgage software to manage the entire mortgage process, from application to closing and funds release. These tools simplify the borrower experience by automating the majority of the process for the lender and reducing the time it takes for both parties to close. Automated workflows are provided by digital mortgage solutions, which include the creation of digital application forms for borrowers.

E-signature is a key feature of this software, which allows both borrowers and lenders to electronically sign documents to close mortgages. Moreover, the value of digital mortgage solutions is found in the lender's automation of the mortgage process and the borrower's streamlined process. Therefore, the surge in demand for digital mortgage software is expected to boost the growth of the market in the upcoming years.

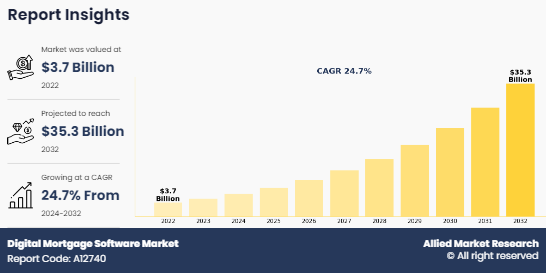
The global digital mortgage software market is segmented on the basis of component, type, deployment, end-user, enterprise size and region. Based on component, the market is divided into solutions and services. The services segment is further divided into digital origination, digital mortgage advisor, digital underwriting, digital quality control, digital servicing, AI based chatbot and automated document classification & extraction. In terms of type, the market is categorized into conventional mortgages, adjustable-rate mortgages, fixed-rate mortgages, government-insured mortgages and jumbo mortgages.

On the basis of deployment, the market is divided into on-premise and cloud. On the basis of end-user, the market is divided into individual and corporate. In terms of enterprise size, the market is categorized into large enterprise and small & medium enterprises. Geographically, the market is analyzed across several regions such as North America, Europe, Asia-Pacific, and Latin America, Middle East & Africa (LAMEA).

Key players operating in the global digital mortgage software industry include Blend, Roostify, StreamLoan, SimpleNexus, Cloudvirga, HW Media LLC, Maxwell Lender Solutions Inc., ICE Mortgage Technology Inc., Blue Sage Solutions and Salesforce Inc. These companies have adopted several strategies such as product launches, partnerships, collaborations, mergers & acquisitions, and joint ventures to strengthen their foothold in the global digital mortgage software market.

COVID-19 Scenario Analysis

  • The mortgage industry has experienced both major and minor issues due to the impact of the COVID-19 pandemic. The situation is made even more complicated by the inherent complexities of the mortgage industry. As risk-averse lenders rush to adopt digital solutions that will enable digital lending, they are tightening borrowers' eligibility requirements.
  • The COVID crisis serves as a wake-up call for the mortgage industry to address current challenges and plan for the future by implementing purpose-driven digital ecosystem-based business models and reducing reliance on manual labor.

Top Impacting Factors

Growth in shift from traditional loan process to digital lending and rise in the number of borrowers overtime are expected to drive the growth of the market. In addition, increase in the adoption of better fraud detection propel the growth of the market. However, scams involving mortgage lending are common on the internet and this will hamper the growth of the market. Contrarily, stringent government policies in order to protect both consumers & lenders is expected to provide lucrative opportunities to the market in the upcoming years.

Growth in Shift from Traditional Loan Process to Digital Lending

Loan personnel can access documents, files, and other data remotely, whether they are across the office or across town due to digitalization. The ability for multiple users to quickly originate a loan reduces the time it takes to close; the bottlenecks that a traditional mortgage process creates are eliminated. Because access, convenience, and user experience are at the heart of the process, one person waiting for paperwork to clear from another isn't an issue with a digital mortgage.

Borrowers benefit from increased efficiency as digital mortgage is less stressful, closes faster and identifies any potential issues sooner, allowing them to be addressed. Moreover, this not only allows lenders to process more mortgages and increase profits, but it also allows them to better serve their borrowers, who have high expectations for quality service. Therefore, the increase in demand for digital mortgage software is expected to boost the growth of the market during the forecast period.

Key Benefits of the Report

  • This study presents analytical depiction of the global digital mortgage software market forecast along with the current trends and future estimations to determine the imminent investment pockets.
  • The report presents information related to key drivers, restraints, and opportunities along with detailed analysis of the global digital mortgage software market trends.     
  • The current market is quantitatively analyzed to highlight the global digital mortgage software market growth scenario.              
  • Porter’s five forces analysis illustrates the potency of buyers & suppliers in the market.
  • The report provides a detailed global digital mortgage software market analysis depending on the present and future competitive intensity of the market.

Questions Answered in the Digital Mortgage Software Market Research Report    

  • Which are the leading players active in the global digital mortgage software market size?
  • What would be the detailed impact of COVID-19 on the global digital mortgage software market share?
  • What are current trends that would influence the global digital mortgage software market in the next few years?
  • What are the driving factors, restraints, and opportunities of the global digital mortgage software market?
  • What are the projections for the future that would help in taking further strategic steps?

Digital Mortgage Software Market Report Highlights

Aspects Details
By Component
  • Solutions
  • Services
    • Digital Origination
    • Digital Mortgage Advisor
    • Digital Underwriting
    • Digital Quality Control
    • Digital Servicing
    • AI based chatbot
    • Automated Document Classification & Extraction
By Type
  • Conventional Mortgages
  • Adjustable-Rate Mortgages
  • Fixed-Rate Mortgages
  • Government-Insured Mortgages
  • Government-Insured Mortgages
By Deployment
  • On-Premises
  • Cloud
By  End-User
  • Individual
  • Corporate
By Enterprise Size
  • Large Enterprise
  • Small & Medium Enterprises
By Region
  • North America  (U.S., Canada)
  • Europe  (France, Germany, UK, Rest of Europe)
  • Asia-Pacific  (China, Japan, India, Rest of Asia-Pacific)
  • LAMEA  (Latin America, Middle East, Africa)
Key Market Players Roostify, HW Media LLC, Salesforce Inc., SimpleNexus, Maxwell Lender Solutions Inc., Blend, ICE Mortgage Technology Inc., Blue Sage Solutions, Cloudvirga, StreamLoan
 
  • CHAPTER 1: INTRODUCTION

    • 1.1. Report Description

    • 1.2. Key Market Segments

    • 1.3. Key Benefits

    • 1.4. Research Methodology

      • 1.4.1. Primary Research

      • 1.4.2. Secondary Research

      • 1.4.3. Analyst Tools and Models

  • CHAPTER 2: EXECUTIVE SUMMARY

    • 2.1. CXO Perspective

  • CHAPTER 3: MARKET LANDSCAPE

    • 3.1. Market Definition and Scope

    • 3.2. Key Findings

      • 3.2.1. Top Investment Pockets

      • 3.2.2. Top Winning Strategies

    • 3.3. Porter's Five Forces Analysis

      • 3.3.1. Bargaining Power of Suppliers

      • 3.3.2. Threat of New Entrants

      • 3.3.3. Threat of Substitutes

      • 3.3.4. Competitive Rivalry

      • 3.3.5. Bargaining Power among Buyers

    • 3.5. Market Dynamics

      • 3.5.1. Drivers

      • 3.5.2. Restraints

      • 3.5.3. Opportunities

    • 3.6. COVID-19 Impact Analysis

  • CHAPTER 4: DIGITAL MORTGAGE SOFTWARE MARKET, BY COMPONENT

    • 4.1. Market Overview

      • 4.1.1 Market Size and Forecast, By Component

    • 4.2. Solutions

      • 4.2.1. Key Market Trends, Growth Factors and Opportunities

      • 4.2.2. Market Size and Forecast, By Region

      • 4.2.3. Market Share Analysis, By Country

    • 4.3. Services

      • 4.3.1. Key Market Trends, Growth Factors and Opportunities

      • 4.3.2. Market Size and Forecast, By Region

      • 4.3.3. Market Share Analysis, By Country

      • 4.3.4. Digital Origination

        • 4.3.4.1. Market Size and Forecast
      • 4.3.4. Digital Mortgage Advisor

        • 4.3.4.1. Market Size and Forecast
      • 4.3.4. Digital Underwriting

        • 4.3.4.1. Market Size and Forecast
      • 4.3.4. Digital Quality Control

        • 4.3.4.1. Market Size and Forecast
      • 4.3.4. Digital Servicing

        • 4.3.4.1. Market Size and Forecast
      • 4.3.4. AI based chatbot

        • 4.3.4.1. Market Size and Forecast
      • 4.3.4. Automated Document Classification Extraction

        • 4.3.4.1. Market Size and Forecast
  • CHAPTER 5: DIGITAL MORTGAGE SOFTWARE MARKET, BY TYPE

    • 5.1. Market Overview

      • 5.1.1 Market Size and Forecast, By Type

    • 5.2. Conventional Mortgages

      • 5.2.1. Key Market Trends, Growth Factors and Opportunities

      • 5.2.2. Market Size and Forecast, By Region

      • 5.2.3. Market Share Analysis, By Country

    • 5.3. Adjustable-Rate Mortgages

      • 5.3.1. Key Market Trends, Growth Factors and Opportunities

      • 5.3.2. Market Size and Forecast, By Region

      • 5.3.3. Market Share Analysis, By Country

    • 5.4. Fixed-Rate Mortgages

      • 5.4.1. Key Market Trends, Growth Factors and Opportunities

      • 5.4.2. Market Size and Forecast, By Region

      • 5.4.3. Market Share Analysis, By Country

    • 5.5. Government-Insured Mortgages

      • 5.5.1. Key Market Trends, Growth Factors and Opportunities

      • 5.5.2. Market Size and Forecast, By Region

      • 5.5.3. Market Share Analysis, By Country

    • 5.6. Government-Insured Mortgages

      • 5.6.1. Key Market Trends, Growth Factors and Opportunities

      • 5.6.2. Market Size and Forecast, By Region

      • 5.6.3. Market Share Analysis, By Country

  • CHAPTER 6: DIGITAL MORTGAGE SOFTWARE MARKET, BY DEPLOYMENT

    • 6.1. Market Overview

      • 6.1.1 Market Size and Forecast, By Deployment

    • 6.2. On-Premises

      • 6.2.1. Key Market Trends, Growth Factors and Opportunities

      • 6.2.2. Market Size and Forecast, By Region

      • 6.2.3. Market Share Analysis, By Country

    • 6.3. Cloud

      • 6.3.1. Key Market Trends, Growth Factors and Opportunities

      • 6.3.2. Market Size and Forecast, By Region

      • 6.3.3. Market Share Analysis, By Country

  • CHAPTER 7: DIGITAL MORTGAGE SOFTWARE MARKET, BY  END-USER

    • 7.1. Market Overview

      • 7.1.1 Market Size and Forecast, By  end-user

    • 7.2. Individual

      • 7.2.1. Key Market Trends, Growth Factors and Opportunities

      • 7.2.2. Market Size and Forecast, By Region

      • 7.2.3. Market Share Analysis, By Country

    • 7.3. Corporate

      • 7.3.1. Key Market Trends, Growth Factors and Opportunities

      • 7.3.2. Market Size and Forecast, By Region

      • 7.3.3. Market Share Analysis, By Country

  • CHAPTER 8: DIGITAL MORTGAGE SOFTWARE MARKET, BY ENTERPRISE SIZE

    • 8.1. Market Overview

      • 8.1.1 Market Size and Forecast, By Enterprise Size

    • 8.2. Large Enterprise

      • 8.2.1. Key Market Trends, Growth Factors and Opportunities

      • 8.2.2. Market Size and Forecast, By Region

      • 8.2.3. Market Share Analysis, By Country

    • 8.3. Small Medium Enterprises

      • 8.3.1. Key Market Trends, Growth Factors and Opportunities

      • 8.3.2. Market Size and Forecast, By Region

      • 8.3.3. Market Share Analysis, By Country

  • CHAPTER 9: DIGITAL MORTGAGE SOFTWARE MARKET, BY REGION

    • 9.1. Market Overview

      • 9.1.1 Market Size and Forecast, By Region

    • 9.2. North America

      • 9.2.1. Key Market Trends and Opportunities

      • 9.2.2. Market Size and Forecast, By Component

      • 9.2.3. Market Size and Forecast, By Type

      • 9.2.4. Market Size and Forecast, By Deployment

      • 9.2.5. Market Size and Forecast, By  end-user

      • 9.2.6. Market Size and Forecast, By Enterprise Size

      • 9.2.7. Market Size and Forecast, By Country

      • 9.2.8. U.S. Digital Mortgage Software Market

        • 9.2.8.1. Market Size and Forecast, By Component
        • 9.2.8.2. Market Size and Forecast, By Type
        • 9.2.8.3. Market Size and Forecast, By Deployment
        • 9.2.8.4. Market Size and Forecast, By  end-user
        • 9.2.8.5. Market Size and Forecast, By Enterprise Size
      • 9.2.9. Canada Digital Mortgage Software Market

        • 9.2.9.1. Market Size and Forecast, By Component
        • 9.2.9.2. Market Size and Forecast, By Type
        • 9.2.9.3. Market Size and Forecast, By Deployment
        • 9.2.9.4. Market Size and Forecast, By  end-user
        • 9.2.9.5. Market Size and Forecast, By Enterprise Size
      • 9.2.10. Mexico Digital Mortgage Software Market

        • 9.2.10.1. Market Size and Forecast, By Component
        • 9.2.10.2. Market Size and Forecast, By Type
        • 9.2.10.3. Market Size and Forecast, By Deployment
        • 9.2.10.4. Market Size and Forecast, By  end-user
        • 9.2.10.5. Market Size and Forecast, By Enterprise Size
    • 9.3. Europe

      • 9.3.1. Key Market Trends and Opportunities

      • 9.3.2. Market Size and Forecast, By Component

      • 9.3.3. Market Size and Forecast, By Type

      • 9.3.4. Market Size and Forecast, By Deployment

      • 9.3.5. Market Size and Forecast, By  end-user

      • 9.3.6. Market Size and Forecast, By Enterprise Size

      • 9.3.7. Market Size and Forecast, By Country

      • 9.3.8. France Digital Mortgage Software Market

        • 9.3.8.1. Market Size and Forecast, By Component
        • 9.3.8.2. Market Size and Forecast, By Type
        • 9.3.8.3. Market Size and Forecast, By Deployment
        • 9.3.8.4. Market Size and Forecast, By  end-user
        • 9.3.8.5. Market Size and Forecast, By Enterprise Size
      • 9.3.9. Germany Digital Mortgage Software Market

        • 9.3.9.1. Market Size and Forecast, By Component
        • 9.3.9.2. Market Size and Forecast, By Type
        • 9.3.9.3. Market Size and Forecast, By Deployment
        • 9.3.9.4. Market Size and Forecast, By  end-user
        • 9.3.9.5. Market Size and Forecast, By Enterprise Size
      • 9.3.10. Italy Digital Mortgage Software Market

        • 9.3.10.1. Market Size and Forecast, By Component
        • 9.3.10.2. Market Size and Forecast, By Type
        • 9.3.10.3. Market Size and Forecast, By Deployment
        • 9.3.10.4. Market Size and Forecast, By  end-user
        • 9.3.10.5. Market Size and Forecast, By Enterprise Size
      • 9.3.11. Spain Digital Mortgage Software Market

        • 9.3.11.1. Market Size and Forecast, By Component
        • 9.3.11.2. Market Size and Forecast, By Type
        • 9.3.11.3. Market Size and Forecast, By Deployment
        • 9.3.11.4. Market Size and Forecast, By  end-user
        • 9.3.11.5. Market Size and Forecast, By Enterprise Size
      • 9.3.12. UK Digital Mortgage Software Market

        • 9.3.12.1. Market Size and Forecast, By Component
        • 9.3.12.2. Market Size and Forecast, By Type
        • 9.3.12.3. Market Size and Forecast, By Deployment
        • 9.3.12.4. Market Size and Forecast, By  end-user
        • 9.3.12.5. Market Size and Forecast, By Enterprise Size
      • 9.3.13. Russia Digital Mortgage Software Market

        • 9.3.13.1. Market Size and Forecast, By Component
        • 9.3.13.2. Market Size and Forecast, By Type
        • 9.3.13.3. Market Size and Forecast, By Deployment
        • 9.3.13.4. Market Size and Forecast, By  end-user
        • 9.3.13.5. Market Size and Forecast, By Enterprise Size
      • 9.3.14. Rest Of Europe Digital Mortgage Software Market

        • 9.3.14.1. Market Size and Forecast, By Component
        • 9.3.14.2. Market Size and Forecast, By Type
        • 9.3.14.3. Market Size and Forecast, By Deployment
        • 9.3.14.4. Market Size and Forecast, By  end-user
        • 9.3.14.5. Market Size and Forecast, By Enterprise Size
    • 9.4. Asia-Pacific

      • 9.4.1. Key Market Trends and Opportunities

      • 9.4.2. Market Size and Forecast, By Component

      • 9.4.3. Market Size and Forecast, By Type

      • 9.4.4. Market Size and Forecast, By Deployment

      • 9.4.5. Market Size and Forecast, By  end-user

      • 9.4.6. Market Size and Forecast, By Enterprise Size

      • 9.4.7. Market Size and Forecast, By Country

      • 9.4.8. China Digital Mortgage Software Market

        • 9.4.8.1. Market Size and Forecast, By Component
        • 9.4.8.2. Market Size and Forecast, By Type
        • 9.4.8.3. Market Size and Forecast, By Deployment
        • 9.4.8.4. Market Size and Forecast, By  end-user
        • 9.4.8.5. Market Size and Forecast, By Enterprise Size
      • 9.4.9. Japan Digital Mortgage Software Market

        • 9.4.9.1. Market Size and Forecast, By Component
        • 9.4.9.2. Market Size and Forecast, By Type
        • 9.4.9.3. Market Size and Forecast, By Deployment
        • 9.4.9.4. Market Size and Forecast, By  end-user
        • 9.4.9.5. Market Size and Forecast, By Enterprise Size
      • 9.4.10. India Digital Mortgage Software Market

        • 9.4.10.1. Market Size and Forecast, By Component
        • 9.4.10.2. Market Size and Forecast, By Type
        • 9.4.10.3. Market Size and Forecast, By Deployment
        • 9.4.10.4. Market Size and Forecast, By  end-user
        • 9.4.10.5. Market Size and Forecast, By Enterprise Size
      • 9.4.11. South Korea Digital Mortgage Software Market

        • 9.4.11.1. Market Size and Forecast, By Component
        • 9.4.11.2. Market Size and Forecast, By Type
        • 9.4.11.3. Market Size and Forecast, By Deployment
        • 9.4.11.4. Market Size and Forecast, By  end-user
        • 9.4.11.5. Market Size and Forecast, By Enterprise Size
      • 9.4.12. Australia Digital Mortgage Software Market

        • 9.4.12.1. Market Size and Forecast, By Component
        • 9.4.12.2. Market Size and Forecast, By Type
        • 9.4.12.3. Market Size and Forecast, By Deployment
        • 9.4.12.4. Market Size and Forecast, By  end-user
        • 9.4.12.5. Market Size and Forecast, By Enterprise Size
      • 9.4.13. Thailand Digital Mortgage Software Market

        • 9.4.13.1. Market Size and Forecast, By Component
        • 9.4.13.2. Market Size and Forecast, By Type
        • 9.4.13.3. Market Size and Forecast, By Deployment
        • 9.4.13.4. Market Size and Forecast, By  end-user
        • 9.4.13.5. Market Size and Forecast, By Enterprise Size
      • 9.4.14. Malaysia Digital Mortgage Software Market

        • 9.4.14.1. Market Size and Forecast, By Component
        • 9.4.14.2. Market Size and Forecast, By Type
        • 9.4.14.3. Market Size and Forecast, By Deployment
        • 9.4.14.4. Market Size and Forecast, By  end-user
        • 9.4.14.5. Market Size and Forecast, By Enterprise Size
      • 9.4.15. Indonesia Digital Mortgage Software Market

        • 9.4.15.1. Market Size and Forecast, By Component
        • 9.4.15.2. Market Size and Forecast, By Type
        • 9.4.15.3. Market Size and Forecast, By Deployment
        • 9.4.15.4. Market Size and Forecast, By  end-user
        • 9.4.15.5. Market Size and Forecast, By Enterprise Size
      • 9.4.16. Rest of Asia Pacific Digital Mortgage Software Market

        • 9.4.16.1. Market Size and Forecast, By Component
        • 9.4.16.2. Market Size and Forecast, By Type
        • 9.4.16.3. Market Size and Forecast, By Deployment
        • 9.4.16.4. Market Size and Forecast, By  end-user
        • 9.4.16.5. Market Size and Forecast, By Enterprise Size
    • 9.5. LAMEA

      • 9.5.1. Key Market Trends and Opportunities

      • 9.5.2. Market Size and Forecast, By Component

      • 9.5.3. Market Size and Forecast, By Type

      • 9.5.4. Market Size and Forecast, By Deployment

      • 9.5.5. Market Size and Forecast, By  end-user

      • 9.5.6. Market Size and Forecast, By Enterprise Size

      • 9.5.7. Market Size and Forecast, By Country

      • 9.5.8. Brazil Digital Mortgage Software Market

        • 9.5.8.1. Market Size and Forecast, By Component
        • 9.5.8.2. Market Size and Forecast, By Type
        • 9.5.8.3. Market Size and Forecast, By Deployment
        • 9.5.8.4. Market Size and Forecast, By  end-user
        • 9.5.8.5. Market Size and Forecast, By Enterprise Size
      • 9.5.9. South Africa Digital Mortgage Software Market

        • 9.5.9.1. Market Size and Forecast, By Component
        • 9.5.9.2. Market Size and Forecast, By Type
        • 9.5.9.3. Market Size and Forecast, By Deployment
        • 9.5.9.4. Market Size and Forecast, By  end-user
        • 9.5.9.5. Market Size and Forecast, By Enterprise Size
      • 9.5.10. Saudi Arabia Digital Mortgage Software Market

        • 9.5.10.1. Market Size and Forecast, By Component
        • 9.5.10.2. Market Size and Forecast, By Type
        • 9.5.10.3. Market Size and Forecast, By Deployment
        • 9.5.10.4. Market Size and Forecast, By  end-user
        • 9.5.10.5. Market Size and Forecast, By Enterprise Size
      • 9.5.11. UAE Digital Mortgage Software Market

        • 9.5.11.1. Market Size and Forecast, By Component
        • 9.5.11.2. Market Size and Forecast, By Type
        • 9.5.11.3. Market Size and Forecast, By Deployment
        • 9.5.11.4. Market Size and Forecast, By  end-user
        • 9.5.11.5. Market Size and Forecast, By Enterprise Size
      • 9.5.12. Argentina Digital Mortgage Software Market

        • 9.5.12.1. Market Size and Forecast, By Component
        • 9.5.12.2. Market Size and Forecast, By Type
        • 9.5.12.3. Market Size and Forecast, By Deployment
        • 9.5.12.4. Market Size and Forecast, By  end-user
        • 9.5.12.5. Market Size and Forecast, By Enterprise Size
      • 9.5.13. Rest of LAMEA Digital Mortgage Software Market

        • 9.5.13.1. Market Size and Forecast, By Component
        • 9.5.13.2. Market Size and Forecast, By Type
        • 9.5.13.3. Market Size and Forecast, By Deployment
        • 9.5.13.4. Market Size and Forecast, By  end-user
        • 9.5.13.5. Market Size and Forecast, By Enterprise Size
  • CHAPTER 10: COMPETITIVE LANDSCAPE

    • 10.1. Introduction

    • 10.2. Top Winning Strategies

    • 10.3. Product Mapping Of Top 10 Player

    • 10.4. Competitive Dashboard

    • 10.5. Competitive Heatmap

    • 10.6. Top Player Positioning,2022

  • CHAPTER 11: COMPANY PROFILES

    • 11.1. Blend

      • 11.1.1. Company Overview

      • 11.1.2. Key Executives

      • 11.1.3. Company Snapshot

      • 11.1.4. Operating Business Segments

      • 11.1.5. Product Portfolio

      • 11.1.6. Business Performance

      • 11.1.7. Key Strategic Moves and Developments

    • 11.2. Roostify

      • 11.2.1. Company Overview

      • 11.2.2. Key Executives

      • 11.2.3. Company Snapshot

      • 11.2.4. Operating Business Segments

      • 11.2.5. Product Portfolio

      • 11.2.6. Business Performance

      • 11.2.7. Key Strategic Moves and Developments

    • 11.3. StreamLoan

      • 11.3.1. Company Overview

      • 11.3.2. Key Executives

      • 11.3.3. Company Snapshot

      • 11.3.4. Operating Business Segments

      • 11.3.5. Product Portfolio

      • 11.3.6. Business Performance

      • 11.3.7. Key Strategic Moves and Developments

    • 11.4. SimpleNexus

      • 11.4.1. Company Overview

      • 11.4.2. Key Executives

      • 11.4.3. Company Snapshot

      • 11.4.4. Operating Business Segments

      • 11.4.5. Product Portfolio

      • 11.4.6. Business Performance

      • 11.4.7. Key Strategic Moves and Developments

    • 11.5. Cloudvirga

      • 11.5.1. Company Overview

      • 11.5.2. Key Executives

      • 11.5.3. Company Snapshot

      • 11.5.4. Operating Business Segments

      • 11.5.5. Product Portfolio

      • 11.5.6. Business Performance

      • 11.5.7. Key Strategic Moves and Developments

    • 11.6. HW Media LLC

      • 11.6.1. Company Overview

      • 11.6.2. Key Executives

      • 11.6.3. Company Snapshot

      • 11.6.4. Operating Business Segments

      • 11.6.5. Product Portfolio

      • 11.6.6. Business Performance

      • 11.6.7. Key Strategic Moves and Developments

    • 11.7. Maxwell Lender Solutions Inc.

      • 11.7.1. Company Overview

      • 11.7.2. Key Executives

      • 11.7.3. Company Snapshot

      • 11.7.4. Operating Business Segments

      • 11.7.5. Product Portfolio

      • 11.7.6. Business Performance

      • 11.7.7. Key Strategic Moves and Developments

    • 11.8. ICE Mortgage Technology Inc.

      • 11.8.1. Company Overview

      • 11.8.2. Key Executives

      • 11.8.3. Company Snapshot

      • 11.8.4. Operating Business Segments

      • 11.8.5. Product Portfolio

      • 11.8.6. Business Performance

      • 11.8.7. Key Strategic Moves and Developments

    • 11.9. Blue Sage Solutions

      • 11.9.1. Company Overview

      • 11.9.2. Key Executives

      • 11.9.3. Company Snapshot

      • 11.9.4. Operating Business Segments

      • 11.9.5. Product Portfolio

      • 11.9.6. Business Performance

      • 11.9.7. Key Strategic Moves and Developments

    • 11.10. Salesforce Inc.

      • 11.10.1. Company Overview

      • 11.10.2. Key Executives

      • 11.10.3. Company Snapshot

      • 11.10.4. Operating Business Segments

      • 11.10.5. Product Portfolio

      • 11.10.6. Business Performance

      • 11.10.7. Key Strategic Moves and Developments

  • LIST OF TABLES

  • TABLE 1. GLOBAL DIGITAL MORTGAGE SOFTWARE MARKET, BY COMPONENT, 2022-2032 ($MILLION)
  • TABLE 2. GLOBAL DIGITAL MORTGAGE SOFTWARE MARKET FOR SOLUTIONS, BY REGION, 2022-2032 ($MILLION)
  • TABLE 3. GLOBAL DIGITAL MORTGAGE SOFTWARE MARKET FOR SERVICES, BY REGION, 2022-2032 ($MILLION)
  • TABLE 4. GLOBAL DIGITAL MORTGAGE SOFTWARE MARKET, BY TYPE, 2022-2032 ($MILLION)
  • TABLE 5. GLOBAL DIGITAL MORTGAGE SOFTWARE MARKET FOR CONVENTIONAL MORTGAGES, BY REGION, 2022-2032 ($MILLION)
  • TABLE 6. GLOBAL DIGITAL MORTGAGE SOFTWARE MARKET FOR ADJUSTABLE-RATE MORTGAGES, BY REGION, 2022-2032 ($MILLION)
  • TABLE 7. GLOBAL DIGITAL MORTGAGE SOFTWARE MARKET FOR FIXED-RATE MORTGAGES, BY REGION, 2022-2032 ($MILLION)
  • TABLE 8. GLOBAL DIGITAL MORTGAGE SOFTWARE MARKET FOR GOVERNMENT-INSURED MORTGAGES, BY REGION, 2022-2032 ($MILLION)
  • TABLE 9. GLOBAL DIGITAL MORTGAGE SOFTWARE MARKET FOR GOVERNMENT-INSURED MORTGAGES, BY REGION, 2022-2032 ($MILLION)
  • TABLE 10. GLOBAL DIGITAL MORTGAGE SOFTWARE MARKET, BY DEPLOYMENT, 2022-2032 ($MILLION)
  • TABLE 11. GLOBAL DIGITAL MORTGAGE SOFTWARE MARKET FOR ON-PREMISES, BY REGION, 2022-2032 ($MILLION)
  • TABLE 12. GLOBAL DIGITAL MORTGAGE SOFTWARE MARKET FOR CLOUD, BY REGION, 2022-2032 ($MILLION)
  • TABLE 13. GLOBAL DIGITAL MORTGAGE SOFTWARE MARKET, BY  END-USER, 2022-2032 ($MILLION)
  • TABLE 14. GLOBAL DIGITAL MORTGAGE SOFTWARE MARKET FOR INDIVIDUAL, BY REGION, 2022-2032 ($MILLION)
  • TABLE 15. GLOBAL DIGITAL MORTGAGE SOFTWARE MARKET FOR CORPORATE, BY REGION, 2022-2032 ($MILLION)
  • TABLE 16. GLOBAL DIGITAL MORTGAGE SOFTWARE MARKET, BY ENTERPRISE SIZE, 2022-2032 ($MILLION)
  • TABLE 17. GLOBAL DIGITAL MORTGAGE SOFTWARE MARKET FOR LARGE ENTERPRISE, BY REGION, 2022-2032 ($MILLION)
  • TABLE 18. GLOBAL DIGITAL MORTGAGE SOFTWARE MARKET FOR SMALL MEDIUM ENTERPRISES, BY REGION, 2022-2032 ($MILLION)
  • TABLE 19. GLOBAL DIGITAL MORTGAGE SOFTWARE MARKET, BY REGION, 2022-2032 ($MILLION)
  • TABLE 20. NORTH AMERICA DIGITAL MORTGAGE SOFTWARE, BY REGION, 2022-2032 ($MILLION)
  • TABLE 21. NORTH AMERICA DIGITAL MORTGAGE SOFTWARE, BY COMPONENT, 2022-2032 ($MILLION)
  • TABLE 22. NORTH AMERICA DIGITAL MORTGAGE SOFTWARE, BY TYPE, 2022-2032 ($MILLION)
  • TABLE 23. NORTH AMERICA DIGITAL MORTGAGE SOFTWARE, BY DEPLOYMENT, 2022-2032 ($MILLION)
  • TABLE 24. NORTH AMERICA DIGITAL MORTGAGE SOFTWARE, BY  END-USER, 2022-2032 ($MILLION)
  • TABLE 25. NORTH AMERICA DIGITAL MORTGAGE SOFTWARE, BY ENTERPRISE SIZE, 2022-2032 ($MILLION)
  • TABLE 26. U.S. DIGITAL MORTGAGE SOFTWARE, BY COMPONENT, 2022-2032 ($MILLION)
  • TABLE 27. U.S. DIGITAL MORTGAGE SOFTWARE, BY TYPE, 2022-2032 ($MILLION)
  • TABLE 28. U.S. DIGITAL MORTGAGE SOFTWARE, BY DEPLOYMENT, 2022-2032 ($MILLION)
  • TABLE 29. U.S. DIGITAL MORTGAGE SOFTWARE, BY  END-USER, 2022-2032 ($MILLION)
  • TABLE 30. U.S. DIGITAL MORTGAGE SOFTWARE, BY ENTERPRISE SIZE, 2022-2032 ($MILLION)
  • TABLE 31. CANADA DIGITAL MORTGAGE SOFTWARE, BY COMPONENT, 2022-2032 ($MILLION)
  • TABLE 32. CANADA DIGITAL MORTGAGE SOFTWARE, BY TYPE, 2022-2032 ($MILLION)
  • TABLE 33. CANADA DIGITAL MORTGAGE SOFTWARE, BY DEPLOYMENT, 2022-2032 ($MILLION)
  • TABLE 34. CANADA DIGITAL MORTGAGE SOFTWARE, BY  END-USER, 2022-2032 ($MILLION)
  • TABLE 35. CANADA DIGITAL MORTGAGE SOFTWARE, BY ENTERPRISE SIZE, 2022-2032 ($MILLION)
  • TABLE 36. MEXICO DIGITAL MORTGAGE SOFTWARE, BY COMPONENT, 2022-2032 ($MILLION)
  • TABLE 37. MEXICO DIGITAL MORTGAGE SOFTWARE, BY TYPE, 2022-2032 ($MILLION)
  • TABLE 38. MEXICO DIGITAL MORTGAGE SOFTWARE, BY DEPLOYMENT, 2022-2032 ($MILLION)
  • TABLE 39. MEXICO DIGITAL MORTGAGE SOFTWARE, BY  END-USER, 2022-2032 ($MILLION)
  • TABLE 40. MEXICO DIGITAL MORTGAGE SOFTWARE, BY ENTERPRISE SIZE, 2022-2032 ($MILLION)
  • TABLE 41. EUROPE DIGITAL MORTGAGE SOFTWARE, BY REGION, 2022-2032 ($MILLION)
  • TABLE 42. EUROPE DIGITAL MORTGAGE SOFTWARE, BY COMPONENT, 2022-2032 ($MILLION)
  • TABLE 43. EUROPE DIGITAL MORTGAGE SOFTWARE, BY TYPE, 2022-2032 ($MILLION)
  • TABLE 44. EUROPE DIGITAL MORTGAGE SOFTWARE, BY DEPLOYMENT, 2022-2032 ($MILLION)
  • TABLE 45. EUROPE DIGITAL MORTGAGE SOFTWARE, BY  END-USER, 2022-2032 ($MILLION)
  • TABLE 46. EUROPE DIGITAL MORTGAGE SOFTWARE, BY ENTERPRISE SIZE, 2022-2032 ($MILLION)
  • TABLE 47. FRANCE DIGITAL MORTGAGE SOFTWARE, BY COMPONENT, 2022-2032 ($MILLION)
  • TABLE 48. FRANCE DIGITAL MORTGAGE SOFTWARE, BY TYPE, 2022-2032 ($MILLION)
  • TABLE 49. FRANCE DIGITAL MORTGAGE SOFTWARE, BY DEPLOYMENT, 2022-2032 ($MILLION)
  • TABLE 50. FRANCE DIGITAL MORTGAGE SOFTWARE, BY  END-USER, 2022-2032 ($MILLION)
  • TABLE 51. FRANCE DIGITAL MORTGAGE SOFTWARE, BY ENTERPRISE SIZE, 2022-2032 ($MILLION)
  • TABLE 52. GERMANY DIGITAL MORTGAGE SOFTWARE, BY COMPONENT, 2022-2032 ($MILLION)
  • TABLE 53. GERMANY DIGITAL MORTGAGE SOFTWARE, BY TYPE, 2022-2032 ($MILLION)
  • TABLE 54. GERMANY DIGITAL MORTGAGE SOFTWARE, BY DEPLOYMENT, 2022-2032 ($MILLION)
  • TABLE 55. GERMANY DIGITAL MORTGAGE SOFTWARE, BY  END-USER, 2022-2032 ($MILLION)
  • TABLE 56. GERMANY DIGITAL MORTGAGE SOFTWARE, BY ENTERPRISE SIZE, 2022-2032 ($MILLION)
  • TABLE 57. ITALY DIGITAL MORTGAGE SOFTWARE, BY COMPONENT, 2022-2032 ($MILLION)
  • TABLE 58. ITALY DIGITAL MORTGAGE SOFTWARE, BY TYPE, 2022-2032 ($MILLION)
  • TABLE 59. ITALY DIGITAL MORTGAGE SOFTWARE, BY DEPLOYMENT, 2022-2032 ($MILLION)
  • TABLE 60. ITALY DIGITAL MORTGAGE SOFTWARE, BY  END-USER, 2022-2032 ($MILLION)
  • TABLE 61. ITALY DIGITAL MORTGAGE SOFTWARE, BY ENTERPRISE SIZE, 2022-2032 ($MILLION)
  • TABLE 62. SPAIN DIGITAL MORTGAGE SOFTWARE, BY COMPONENT, 2022-2032 ($MILLION)
  • TABLE 63. SPAIN DIGITAL MORTGAGE SOFTWARE, BY TYPE, 2022-2032 ($MILLION)
  • TABLE 64. SPAIN DIGITAL MORTGAGE SOFTWARE, BY DEPLOYMENT, 2022-2032 ($MILLION)
  • TABLE 65. SPAIN DIGITAL MORTGAGE SOFTWARE, BY  END-USER, 2022-2032 ($MILLION)
  • TABLE 66. SPAIN DIGITAL MORTGAGE SOFTWARE, BY ENTERPRISE SIZE, 2022-2032 ($MILLION)
  • TABLE 67. UK DIGITAL MORTGAGE SOFTWARE, BY COMPONENT, 2022-2032 ($MILLION)
  • TABLE 68. UK DIGITAL MORTGAGE SOFTWARE, BY TYPE, 2022-2032 ($MILLION)
  • TABLE 69. UK DIGITAL MORTGAGE SOFTWARE, BY DEPLOYMENT, 2022-2032 ($MILLION)
  • TABLE 70. UK DIGITAL MORTGAGE SOFTWARE, BY  END-USER, 2022-2032 ($MILLION)
  • TABLE 71. UK DIGITAL MORTGAGE SOFTWARE, BY ENTERPRISE SIZE, 2022-2032 ($MILLION)
  • TABLE 72. RUSSIA DIGITAL MORTGAGE SOFTWARE, BY COMPONENT, 2022-2032 ($MILLION)
  • TABLE 73. RUSSIA DIGITAL MORTGAGE SOFTWARE, BY TYPE, 2022-2032 ($MILLION)
  • TABLE 74. RUSSIA DIGITAL MORTGAGE SOFTWARE, BY DEPLOYMENT, 2022-2032 ($MILLION)
  • TABLE 75. RUSSIA DIGITAL MORTGAGE SOFTWARE, BY  END-USER, 2022-2032 ($MILLION)
  • TABLE 76. RUSSIA DIGITAL MORTGAGE SOFTWARE, BY ENTERPRISE SIZE, 2022-2032 ($MILLION)
  • TABLE 77. REST OF EUROPE DIGITAL MORTGAGE SOFTWARE, BY COMPONENT, 2022-2032 ($MILLION)
  • TABLE 78. REST OF EUROPE DIGITAL MORTGAGE SOFTWARE, BY TYPE, 2022-2032 ($MILLION)
  • TABLE 79. REST OF EUROPE DIGITAL MORTGAGE SOFTWARE, BY DEPLOYMENT, 2022-2032 ($MILLION)
  • TABLE 80. REST OF EUROPE DIGITAL MORTGAGE SOFTWARE, BY  END-USER, 2022-2032 ($MILLION)
  • TABLE 81. REST OF EUROPE DIGITAL MORTGAGE SOFTWARE, BY ENTERPRISE SIZE, 2022-2032 ($MILLION)
  • TABLE 82. ASIA-PACIFIC DIGITAL MORTGAGE SOFTWARE, BY REGION, 2022-2032 ($MILLION)
  • TABLE 83. ASIA-PACIFIC DIGITAL MORTGAGE SOFTWARE, BY COMPONENT, 2022-2032 ($MILLION)
  • TABLE 84. ASIA-PACIFIC DIGITAL MORTGAGE SOFTWARE, BY TYPE, 2022-2032 ($MILLION)
  • TABLE 85. ASIA-PACIFIC DIGITAL MORTGAGE SOFTWARE, BY DEPLOYMENT, 2022-2032 ($MILLION)
  • TABLE 86. ASIA-PACIFIC DIGITAL MORTGAGE SOFTWARE, BY  END-USER, 2022-2032 ($MILLION)
  • TABLE 87. ASIA-PACIFIC DIGITAL MORTGAGE SOFTWARE, BY ENTERPRISE SIZE, 2022-2032 ($MILLION)
  • TABLE 88. CHINA DIGITAL MORTGAGE SOFTWARE, BY COMPONENT, 2022-2032 ($MILLION)
  • TABLE 89. CHINA DIGITAL MORTGAGE SOFTWARE, BY TYPE, 2022-2032 ($MILLION)
  • TABLE 90. CHINA DIGITAL MORTGAGE SOFTWARE, BY DEPLOYMENT, 2022-2032 ($MILLION)
  • TABLE 91. CHINA DIGITAL MORTGAGE SOFTWARE, BY  END-USER, 2022-2032 ($MILLION)
  • TABLE 92. CHINA DIGITAL MORTGAGE SOFTWARE, BY ENTERPRISE SIZE, 2022-2032 ($MILLION)
  • TABLE 93. JAPAN DIGITAL MORTGAGE SOFTWARE, BY COMPONENT, 2022-2032 ($MILLION)
  • TABLE 94. JAPAN DIGITAL MORTGAGE SOFTWARE, BY TYPE, 2022-2032 ($MILLION)
  • TABLE 95. JAPAN DIGITAL MORTGAGE SOFTWARE, BY DEPLOYMENT, 2022-2032 ($MILLION)
  • TABLE 96. JAPAN DIGITAL MORTGAGE SOFTWARE, BY  END-USER, 2022-2032 ($MILLION)
  • TABLE 97. JAPAN DIGITAL MORTGAGE SOFTWARE, BY ENTERPRISE SIZE, 2022-2032 ($MILLION)
  • TABLE 98. INDIA DIGITAL MORTGAGE SOFTWARE, BY COMPONENT, 2022-2032 ($MILLION)
  • TABLE 99. INDIA DIGITAL MORTGAGE SOFTWARE, BY TYPE, 2022-2032 ($MILLION)
  • TABLE 100. INDIA DIGITAL MORTGAGE SOFTWARE, BY DEPLOYMENT, 2022-2032 ($MILLION)
  • TABLE 101. INDIA DIGITAL MORTGAGE SOFTWARE, BY  END-USER, 2022-2032 ($MILLION)
  • TABLE 102. INDIA DIGITAL MORTGAGE SOFTWARE, BY ENTERPRISE SIZE, 2022-2032 ($MILLION)
  • TABLE 103. SOUTH KOREA DIGITAL MORTGAGE SOFTWARE, BY COMPONENT, 2022-2032 ($MILLION)
  • TABLE 104. SOUTH KOREA DIGITAL MORTGAGE SOFTWARE, BY TYPE, 2022-2032 ($MILLION)
  • TABLE 105. SOUTH KOREA DIGITAL MORTGAGE SOFTWARE, BY DEPLOYMENT, 2022-2032 ($MILLION)
  • TABLE 106. SOUTH KOREA DIGITAL MORTGAGE SOFTWARE, BY  END-USER, 2022-2032 ($MILLION)
  • TABLE 107. SOUTH KOREA DIGITAL MORTGAGE SOFTWARE, BY ENTERPRISE SIZE, 2022-2032 ($MILLION)
  • TABLE 108. AUSTRALIA DIGITAL MORTGAGE SOFTWARE, BY COMPONENT, 2022-2032 ($MILLION)
  • TABLE 109. AUSTRALIA DIGITAL MORTGAGE SOFTWARE, BY TYPE, 2022-2032 ($MILLION)
  • TABLE 110. AUSTRALIA DIGITAL MORTGAGE SOFTWARE, BY DEPLOYMENT, 2022-2032 ($MILLION)
  • TABLE 111. AUSTRALIA DIGITAL MORTGAGE SOFTWARE, BY  END-USER, 2022-2032 ($MILLION)
  • TABLE 112. AUSTRALIA DIGITAL MORTGAGE SOFTWARE, BY ENTERPRISE SIZE, 2022-2032 ($MILLION)
  • TABLE 113. THAILAND DIGITAL MORTGAGE SOFTWARE, BY COMPONENT, 2022-2032 ($MILLION)
  • TABLE 114. THAILAND DIGITAL MORTGAGE SOFTWARE, BY TYPE, 2022-2032 ($MILLION)
  • TABLE 115. THAILAND DIGITAL MORTGAGE SOFTWARE, BY DEPLOYMENT, 2022-2032 ($MILLION)
  • TABLE 116. THAILAND DIGITAL MORTGAGE SOFTWARE, BY  END-USER, 2022-2032 ($MILLION)
  • TABLE 117. THAILAND DIGITAL MORTGAGE SOFTWARE, BY ENTERPRISE SIZE, 2022-2032 ($MILLION)
  • TABLE 118. MALAYSIA DIGITAL MORTGAGE SOFTWARE, BY COMPONENT, 2022-2032 ($MILLION)
  • TABLE 119. MALAYSIA DIGITAL MORTGAGE SOFTWARE, BY TYPE, 2022-2032 ($MILLION)
  • TABLE 120. MALAYSIA DIGITAL MORTGAGE SOFTWARE, BY DEPLOYMENT, 2022-2032 ($MILLION)
  • TABLE 121. MALAYSIA DIGITAL MORTGAGE SOFTWARE, BY  END-USER, 2022-2032 ($MILLION)
  • TABLE 122. MALAYSIA DIGITAL MORTGAGE SOFTWARE, BY ENTERPRISE SIZE, 2022-2032 ($MILLION)
  • TABLE 123. INDONESIA DIGITAL MORTGAGE SOFTWARE, BY COMPONENT, 2022-2032 ($MILLION)
  • TABLE 124. INDONESIA DIGITAL MORTGAGE SOFTWARE, BY TYPE, 2022-2032 ($MILLION)
  • TABLE 125. INDONESIA DIGITAL MORTGAGE SOFTWARE, BY DEPLOYMENT, 2022-2032 ($MILLION)
  • TABLE 126. INDONESIA DIGITAL MORTGAGE SOFTWARE, BY  END-USER, 2022-2032 ($MILLION)
  • TABLE 127. INDONESIA DIGITAL MORTGAGE SOFTWARE, BY ENTERPRISE SIZE, 2022-2032 ($MILLION)
  • TABLE 128. REST OF ASIA PACIFIC DIGITAL MORTGAGE SOFTWARE, BY COMPONENT, 2022-2032 ($MILLION)
  • TABLE 129. REST OF ASIA PACIFIC DIGITAL MORTGAGE SOFTWARE, BY TYPE, 2022-2032 ($MILLION)
  • TABLE 130. REST OF ASIA PACIFIC DIGITAL MORTGAGE SOFTWARE, BY DEPLOYMENT, 2022-2032 ($MILLION)
  • TABLE 131. REST OF ASIA PACIFIC DIGITAL MORTGAGE SOFTWARE, BY  END-USER, 2022-2032 ($MILLION)
  • TABLE 132. REST OF ASIA PACIFIC DIGITAL MORTGAGE SOFTWARE, BY ENTERPRISE SIZE, 2022-2032 ($MILLION)
  • TABLE 133. LAMEA DIGITAL MORTGAGE SOFTWARE, BY REGION, 2022-2032 ($MILLION)
  • TABLE 134. LAMEA DIGITAL MORTGAGE SOFTWARE, BY COMPONENT, 2022-2032 ($MILLION)
  • TABLE 135. LAMEA DIGITAL MORTGAGE SOFTWARE, BY TYPE, 2022-2032 ($MILLION)
  • TABLE 136. LAMEA DIGITAL MORTGAGE SOFTWARE, BY DEPLOYMENT, 2022-2032 ($MILLION)
  • TABLE 137. LAMEA DIGITAL MORTGAGE SOFTWARE, BY  END-USER, 2022-2032 ($MILLION)
  • TABLE 138. LAMEA DIGITAL MORTGAGE SOFTWARE, BY ENTERPRISE SIZE, 2022-2032 ($MILLION)
  • TABLE 139. BRAZIL DIGITAL MORTGAGE SOFTWARE, BY COMPONENT, 2022-2032 ($MILLION)
  • TABLE 140. BRAZIL DIGITAL MORTGAGE SOFTWARE, BY TYPE, 2022-2032 ($MILLION)
  • TABLE 141. BRAZIL DIGITAL MORTGAGE SOFTWARE, BY DEPLOYMENT, 2022-2032 ($MILLION)
  • TABLE 142. BRAZIL DIGITAL MORTGAGE SOFTWARE, BY  END-USER, 2022-2032 ($MILLION)
  • TABLE 143. BRAZIL DIGITAL MORTGAGE SOFTWARE, BY ENTERPRISE SIZE, 2022-2032 ($MILLION)
  • TABLE 144. SOUTH AFRICA DIGITAL MORTGAGE SOFTWARE, BY COMPONENT, 2022-2032 ($MILLION)
  • TABLE 145. SOUTH AFRICA DIGITAL MORTGAGE SOFTWARE, BY TYPE, 2022-2032 ($MILLION)
  • TABLE 146. SOUTH AFRICA DIGITAL MORTGAGE SOFTWARE, BY DEPLOYMENT, 2022-2032 ($MILLION)
  • TABLE 147. SOUTH AFRICA DIGITAL MORTGAGE SOFTWARE, BY  END-USER, 2022-2032 ($MILLION)
  • TABLE 148. SOUTH AFRICA DIGITAL MORTGAGE SOFTWARE, BY ENTERPRISE SIZE, 2022-2032 ($MILLION)
  • TABLE 149. SAUDI ARABIA DIGITAL MORTGAGE SOFTWARE, BY COMPONENT, 2022-2032 ($MILLION)
  • TABLE 150. SAUDI ARABIA DIGITAL MORTGAGE SOFTWARE, BY TYPE, 2022-2032 ($MILLION)
  • TABLE 151. SAUDI ARABIA DIGITAL MORTGAGE SOFTWARE, BY DEPLOYMENT, 2022-2032 ($MILLION)
  • TABLE 152. SAUDI ARABIA DIGITAL MORTGAGE SOFTWARE, BY  END-USER, 2022-2032 ($MILLION)
  • TABLE 153. SAUDI ARABIA DIGITAL MORTGAGE SOFTWARE, BY ENTERPRISE SIZE, 2022-2032 ($MILLION)
  • TABLE 154. UAE DIGITAL MORTGAGE SOFTWARE, BY COMPONENT, 2022-2032 ($MILLION)
  • TABLE 155. UAE DIGITAL MORTGAGE SOFTWARE, BY TYPE, 2022-2032 ($MILLION)
  • TABLE 156. UAE DIGITAL MORTGAGE SOFTWARE, BY DEPLOYMENT, 2022-2032 ($MILLION)
  • TABLE 157. UAE DIGITAL MORTGAGE SOFTWARE, BY  END-USER, 2022-2032 ($MILLION)
  • TABLE 158. UAE DIGITAL MORTGAGE SOFTWARE, BY ENTERPRISE SIZE, 2022-2032 ($MILLION)
  • TABLE 159. ARGENTINA DIGITAL MORTGAGE SOFTWARE, BY COMPONENT, 2022-2032 ($MILLION)
  • TABLE 160. ARGENTINA DIGITAL MORTGAGE SOFTWARE, BY TYPE, 2022-2032 ($MILLION)
  • TABLE 161. ARGENTINA DIGITAL MORTGAGE SOFTWARE, BY DEPLOYMENT, 2022-2032 ($MILLION)
  • TABLE 162. ARGENTINA DIGITAL MORTGAGE SOFTWARE, BY  END-USER, 2022-2032 ($MILLION)
  • TABLE 163. ARGENTINA DIGITAL MORTGAGE SOFTWARE, BY ENTERPRISE SIZE, 2022-2032 ($MILLION)
  • TABLE 164. REST OF LAMEA DIGITAL MORTGAGE SOFTWARE, BY COMPONENT, 2022-2032 ($MILLION)
  • TABLE 165. REST OF LAMEA DIGITAL MORTGAGE SOFTWARE, BY TYPE, 2022-2032 ($MILLION)
  • TABLE 166. REST OF LAMEA DIGITAL MORTGAGE SOFTWARE, BY DEPLOYMENT, 2022-2032 ($MILLION)
  • TABLE 167. REST OF LAMEA DIGITAL MORTGAGE SOFTWARE, BY  END-USER, 2022-2032 ($MILLION)
  • TABLE 168. REST OF LAMEA DIGITAL MORTGAGE SOFTWARE, BY ENTERPRISE SIZE, 2022-2032 ($MILLION)
  • TABLE 169. BLEND: KEY EXECUTIVES
  • TABLE 170. BLEND: COMPANY SNAPSHOT
  • TABLE 171. BLEND: OPERATING SEGMENTS
  • TABLE 172. BLEND: PRODUCT PORTFOLIO
  • TABLE 173. BLEND: KEY STRATEGIC MOVES AND DEVELOPMENTS
  • TABLE 174. ROOSTIFY: KEY EXECUTIVES
  • TABLE 175. ROOSTIFY: COMPANY SNAPSHOT
  • TABLE 176. ROOSTIFY: OPERATING SEGMENTS
  • TABLE 177. ROOSTIFY: PRODUCT PORTFOLIO
  • TABLE 178. ROOSTIFY: KEY STRATEGIC MOVES AND DEVELOPMENTS
  • TABLE 179. STREAMLOAN: KEY EXECUTIVES
  • TABLE 180. STREAMLOAN: COMPANY SNAPSHOT
  • TABLE 181. STREAMLOAN: OPERATING SEGMENTS
  • TABLE 182. STREAMLOAN: PRODUCT PORTFOLIO
  • TABLE 183. STREAMLOAN: KEY STRATEGIC MOVES AND DEVELOPMENTS
  • TABLE 184. SIMPLENEXUS: KEY EXECUTIVES
  • TABLE 185. SIMPLENEXUS: COMPANY SNAPSHOT
  • TABLE 186. SIMPLENEXUS: OPERATING SEGMENTS
  • TABLE 187. SIMPLENEXUS: PRODUCT PORTFOLIO
  • TABLE 188. SIMPLENEXUS: KEY STRATEGIC MOVES AND DEVELOPMENTS
  • TABLE 189. CLOUDVIRGA: KEY EXECUTIVES
  • TABLE 190. CLOUDVIRGA: COMPANY SNAPSHOT
  • TABLE 191. CLOUDVIRGA: OPERATING SEGMENTS
  • TABLE 192. CLOUDVIRGA: PRODUCT PORTFOLIO
  • TABLE 193. CLOUDVIRGA: KEY STRATEGIC MOVES AND DEVELOPMENTS
  • TABLE 194. HW MEDIA LLC: KEY EXECUTIVES
  • TABLE 195. HW MEDIA LLC: COMPANY SNAPSHOT
  • TABLE 196. HW MEDIA LLC: OPERATING SEGMENTS
  • TABLE 197. HW MEDIA LLC: PRODUCT PORTFOLIO
  • TABLE 198. HW MEDIA LLC: KEY STRATEGIC MOVES AND DEVELOPMENTS
  • TABLE 199. MAXWELL LENDER SOLUTIONS INC.: KEY EXECUTIVES
  • TABLE 200. MAXWELL LENDER SOLUTIONS INC.: COMPANY SNAPSHOT
  • TABLE 201. MAXWELL LENDER SOLUTIONS INC.: OPERATING SEGMENTS
  • TABLE 202. MAXWELL LENDER SOLUTIONS INC.: PRODUCT PORTFOLIO
  • TABLE 203. MAXWELL LENDER SOLUTIONS INC.: KEY STRATEGIC MOVES AND DEVELOPMENTS
  • TABLE 204. ICE MORTGAGE TECHNOLOGY INC.: KEY EXECUTIVES
  • TABLE 205. ICE MORTGAGE TECHNOLOGY INC.: COMPANY SNAPSHOT
  • TABLE 206. ICE MORTGAGE TECHNOLOGY INC.: OPERATING SEGMENTS
  • TABLE 207. ICE MORTGAGE TECHNOLOGY INC.: PRODUCT PORTFOLIO
  • TABLE 208. ICE MORTGAGE TECHNOLOGY INC.: KEY STRATEGIC MOVES AND DEVELOPMENTS
  • TABLE 209. BLUE SAGE SOLUTIONS: KEY EXECUTIVES
  • TABLE 210. BLUE SAGE SOLUTIONS: COMPANY SNAPSHOT
  • TABLE 211. BLUE SAGE SOLUTIONS: OPERATING SEGMENTS
  • TABLE 212. BLUE SAGE SOLUTIONS: PRODUCT PORTFOLIO
  • TABLE 213. BLUE SAGE SOLUTIONS: KEY STRATEGIC MOVES AND DEVELOPMENTS
  • TABLE 214. SALESFORCE INC.: KEY EXECUTIVES
  • TABLE 215. SALESFORCE INC.: COMPANY SNAPSHOT
  • TABLE 216. SALESFORCE INC.: OPERATING SEGMENTS
  • TABLE 217. SALESFORCE INC.: PRODUCT PORTFOLIO
  • TABLE 218. SALESFORCE INC.: KEY STRATEGIC MOVES AND DEVELOPMENTS
  • LIST OF FIGURES

  • FIGURE 1. GLOBAL DIGITAL MORTGAGE SOFTWARE MARKET SEGMENTATION
  • FIGURE 2. GLOBAL DIGITAL MORTGAGE SOFTWARE MARKET
  • FIGURE 3. SEGMENTATION DIGITAL MORTGAGE SOFTWARE MARKET
  • FIGURE 4. TOP INVESTMENT POCKET IN DIGITAL MORTGAGE SOFTWARE MARKET
  • FIGURE 5. MODERATE BARGAINING POWER OF BUYERS
  • FIGURE 6. MODERATE BARGAINING POWER OF SUPPLIERS
  • FIGURE 7. MODERATE THREAT OF NEW ENTRANTS
  • FIGURE 8. LOW THREAT OF SUBSTITUTION
  • FIGURE 9. HIGH COMPETITIVE RIVALRY
  • FIGURE 10. OPPORTUNITIES, RESTRAINTS AND DRIVERS: GLOBALDIGITAL MORTGAGE SOFTWARE MARKET
  • FIGURE 11. DIGITAL MORTGAGE SOFTWARE MARKET SEGMENTATION, BY BY COMPONENT
  • FIGURE 12. DIGITAL MORTGAGE SOFTWARE MARKET FOR SOLUTIONS, BY COUNTRY, 2022-2032 ($MILLION)
  • FIGURE 13. DIGITAL MORTGAGE SOFTWARE MARKET FOR SERVICES, BY COUNTRY, 2022-2032 ($MILLION)
  • FIGURE 14. DIGITAL MORTGAGE SOFTWARE MARKET SEGMENTATION, BY BY TYPE
  • FIGURE 15. DIGITAL MORTGAGE SOFTWARE MARKET FOR CONVENTIONAL MORTGAGES, BY COUNTRY, 2022-2032 ($MILLION)
  • FIGURE 16. DIGITAL MORTGAGE SOFTWARE MARKET FOR ADJUSTABLE-RATE MORTGAGES, BY COUNTRY, 2022-2032 ($MILLION)
  • FIGURE 17. DIGITAL MORTGAGE SOFTWARE MARKET FOR FIXED-RATE MORTGAGES, BY COUNTRY, 2022-2032 ($MILLION)
  • FIGURE 18. DIGITAL MORTGAGE SOFTWARE MARKET FOR GOVERNMENT-INSURED MORTGAGES, BY COUNTRY, 2022-2032 ($MILLION)
  • FIGURE 19. DIGITAL MORTGAGE SOFTWARE MARKET FOR GOVERNMENT-INSURED MORTGAGES, BY COUNTRY, 2022-2032 ($MILLION)
  • FIGURE 20. DIGITAL MORTGAGE SOFTWARE MARKET SEGMENTATION, BY BY DEPLOYMENT
  • FIGURE 21. DIGITAL MORTGAGE SOFTWARE MARKET FOR ON-PREMISES, BY COUNTRY, 2022-2032 ($MILLION)
  • FIGURE 22. DIGITAL MORTGAGE SOFTWARE MARKET FOR CLOUD, BY COUNTRY, 2022-2032 ($MILLION)
  • FIGURE 23. DIGITAL MORTGAGE SOFTWARE MARKET SEGMENTATION, BY BY  END-USER
  • FIGURE 24. DIGITAL MORTGAGE SOFTWARE MARKET FOR INDIVIDUAL, BY COUNTRY, 2022-2032 ($MILLION)
  • FIGURE 25. DIGITAL MORTGAGE SOFTWARE MARKET FOR CORPORATE, BY COUNTRY, 2022-2032 ($MILLION)
  • FIGURE 26. DIGITAL MORTGAGE SOFTWARE MARKET SEGMENTATION, BY BY ENTERPRISE SIZE
  • FIGURE 27. DIGITAL MORTGAGE SOFTWARE MARKET FOR LARGE ENTERPRISE, BY COUNTRY, 2022-2032 ($MILLION)
  • FIGURE 28. DIGITAL MORTGAGE SOFTWARE MARKET FOR SMALL MEDIUM ENTERPRISES, BY COUNTRY, 2022-2032 ($MILLION)
  • FIGURE 29. TOP WINNING STRATEGIES, BY YEAR, 2020-2022*
  • FIGURE 30. TOP WINNING STRATEGIES, BY DEVELOPMENT, 2020-2022*
  • FIGURE 31. TOP WINNING STRATEGIES, BY COMPANY, 2020-2022*
  • FIGURE 32. PRODUCT MAPPING OF TOP 10 PLAYERS
  • FIGURE 33. COMPETITIVE DASHBOARD
  • FIGURE 34. COMPETITIVE HEATMAP: DIGITAL MORTGAGE SOFTWARE MARKET
  • FIGURE 35. Top player positioning, 2022
  • FIGURE 36. BLEND: NET SALES, 2020-2022 ($MILLION)
  • FIGURE 37. BLEND: REVENUE SHARE, BY SEGMENT, 2032 (%)
  • FIGURE 38. BLEND: REVENUE SHARE, BY REGION, 2032 (%)
  • FIGURE 39. ROOSTIFY: NET SALES, 2020-2022 ($MILLION)
  • FIGURE 40. ROOSTIFY: REVENUE SHARE, BY SEGMENT, 2032 (%)
  • FIGURE 41. ROOSTIFY: REVENUE SHARE, BY REGION, 2032 (%)
  • FIGURE 42. STREAMLOAN: NET SALES, 2020-2022 ($MILLION)
  • FIGURE 43. STREAMLOAN: REVENUE SHARE, BY SEGMENT, 2032 (%)
  • FIGURE 44. STREAMLOAN: REVENUE SHARE, BY REGION, 2032 (%)
  • FIGURE 45. SIMPLENEXUS: NET SALES, 2020-2022 ($MILLION)
  • FIGURE 46. SIMPLENEXUS: REVENUE SHARE, BY SEGMENT, 2032 (%)
  • FIGURE 47. SIMPLENEXUS: REVENUE SHARE, BY REGION, 2032 (%)
  • FIGURE 48. CLOUDVIRGA: NET SALES, 2020-2022 ($MILLION)
  • FIGURE 49. CLOUDVIRGA: REVENUE SHARE, BY SEGMENT, 2032 (%)
  • FIGURE 50. CLOUDVIRGA: REVENUE SHARE, BY REGION, 2032 (%)
  • FIGURE 51. HW MEDIA LLC: NET SALES, 2020-2022 ($MILLION)
  • FIGURE 52. HW MEDIA LLC: REVENUE SHARE, BY SEGMENT, 2032 (%)
  • FIGURE 53. HW MEDIA LLC: REVENUE SHARE, BY REGION, 2032 (%)
  • FIGURE 54. MAXWELL LENDER SOLUTIONS INC.: NET SALES, 2020-2022 ($MILLION)
  • FIGURE 55. MAXWELL LENDER SOLUTIONS INC.: REVENUE SHARE, BY SEGMENT, 2032 (%)
  • FIGURE 56. MAXWELL LENDER SOLUTIONS INC.: REVENUE SHARE, BY REGION, 2032 (%)
  • FIGURE 57. ICE MORTGAGE TECHNOLOGY INC.: NET SALES, 2020-2022 ($MILLION)
  • FIGURE 58. ICE MORTGAGE TECHNOLOGY INC.: REVENUE SHARE, BY SEGMENT, 2032 (%)
  • FIGURE 59. ICE MORTGAGE TECHNOLOGY INC.: REVENUE SHARE, BY REGION, 2032 (%)
  • FIGURE 60. BLUE SAGE SOLUTIONS: NET SALES, 2020-2022 ($MILLION)
  • FIGURE 61. BLUE SAGE SOLUTIONS: REVENUE SHARE, BY SEGMENT, 2032 (%)
  • FIGURE 62. BLUE SAGE SOLUTIONS: REVENUE SHARE, BY REGION, 2032 (%)
  • FIGURE 63. SALESFORCE INC.: NET SALES, 2020-2022 ($MILLION)
  • FIGURE 64. SALESFORCE INC.: REVENUE SHARE, BY SEGMENT, 2032 (%)
  • FIGURE 65. SALESFORCE INC.: REVENUE SHARE, BY REGION, 2032 (%)


With collective industry experience of about 200 years of its analysts and experts, Allied Market Research (AMR) encompasses most infallible research methodology for its market intelligence and industry analysis. We do not only engrave the deepest levels of markets but also sneak through its slimmest details for the purpose of our market estimates and forecasts. Our approach helps in building greater market consensus view for size, shape and industry trends within each industry segment. We carefully factor in industry trends and real developments for identifying key growth factors and future course of the market. Our research proceeds are the resultant of high quality data, expert views and analysis and high value independent opinions. Our research process is designed to deliver balanced view of the global markets and allow stakeholders to make informed decisions.

We offer our clients exhaustive research and analysis based on wide variety of factual inputs, which largely include interviews with industry participants, reliable statistics and regional intelligence. Our in-house industry experts play instrumental role in designing analytic tools and models, tailored to the requirements of particular industry segment. These analytical tools and models sanitize the data & statistics and enhance the accuracy of our recommendations and advice. With AMR’s calibrated research process and 360` degree data-evaluation methodology, our clients are assured of receiving:

  • Consistent, valuable, robust and actionable data & analysis that can easily be referenced for strategic business planning
  • Technologically sophisticated and reliable insights through well audited and veracious research methodology
  • Sovereign research proceeds that present a tangible depiction of marketplace


With a strong methodology we are, therefore, confident that our research and analysis are most reliable and guarantees sound business planning.

Secondary research
We refer a broad array of industry sources for our secondary, which typically include; however, not limited to: Company SEC filings, annual reports, company websites, broker & financial reports and investor presentations for competitive scenario and shape of the industry

  • Patent and regulatory databases for understanding of technical & legal developments
  • Scientific and technical writings for product information and related preemptions
  • Regional government and statistical databases for macro analysis
  • Authentic new articles, web-casts and other related releases for market evaluation
  • Internal and external proprietary databases, key market indicators and relevant press releases for market estimates and forecast


Primary research
Our primary research efforts include reaching out participants through mail, tele-conversations, referrals, professional networks and face-to-face interactions. We are also in professional corporate relations with various companies that allow us greater flexibility for reaching out industry participants and commentators for interviews and discussions, fulfilling following functions:

  • Validates and improves the data quality and strengthens research proceeds
  • Further develops analyst team’s market understanding and expertise
  • Supplies authentic information about market size, share, growth and forecasts


Our primary research interview and discussion panels are typically composed of most experienced industry members. These participants include; however, not limited to:

  • Chief executives and VPs of leading corporations specific to industry
  • Product and sales managers or country heads; channel partners and top level distributors; banking, investments and valuation experts Key opinion leaders (KOLs)


Analyst tools and models
AMR has developed set of analyst tools and data models to supplement and expedite the analysis process. Corresponding to markets, where there is significant lack of information and estimates, AMR’s team of experts and analyst develop specific analyst tools and industry models to translate qualitative and quantitative industry indicators into exact industry estimates. These models also allow analysts to examine the prospects and opportunities prevailing in the market to accurately forecast the course of the market.

PURCHASE OPTIONS

Call or Email us

U.S.-Canada Toll-free: +1-800-792-5285
Int'l : +1-503-894-6022
Europe : +44-845-528-1300
Email : help@alliedmarketresearch.com

Looking for Customization?

 Customization Request

Have a Question?

 Speak with Analyst

Any Confusion?

 Inquire Before Buying

Have a glance of the Report

  Enquiry Now
RELATED TAGS

Purchase Full Report of
Digital Mortgage Software Market

Start reading.
This Report and over 67,404+ more Reports, Available with Avenue Library. T&C*.

  • Online Only
  • $3,690
  • Online cloud access only
  • Restricted print, copy, paste & download
  • Read only
  • Free industry update
    (Within 180 days)
  • Free report update in next update cycle
  • Data Pack
  • $3,930
  • Restricted to one authorized user
  • One print only
  • Available in
    Excel
  • Free industry update
    (Within 180 days)
  •   Free report update in next update cycle
  • Single User
  • $5,820
  • Restricted to one authorized user
  • One print only
  • Available in
    PDF
  • Free industry update
    (Within 180 days)
  •   Free report update in next update cycle
  • Five Users
  • $6,540
  • Limited to five authorized users
  • Print upto five copies
  • Available in
    PDF
  • Free industry update
    (Within 180 days)
  •   Free report update in next update cycle
  • Enterprise
    License/PDF

  • $9,870
  • Unlimited
    within
    company/enterprise
  • Available in Excel & PDF
  • Free industry update
    (Within 180 days)
  •   Free report update in next update cycle
  • Library
    Membership

  • $999 $ 1,175
    Per User/ Per month/ Billed annually
  • Published Content
    E-access
  • Company Profiles
    E-access
  • Newly Added Content Access
  • 10 PDF
    Downloads
  • 5 Excel Data
    Pack Downloads
  • 250 Company Profiles PDF Downloads
  • Buy Now

*Taxes/Fees, if applicable will be added during checkout. All prices in USD

RELATED REPORTS
 

Why Allied Market Research?


Infallible Methodology

To ensure high-level data integrity, accurate analysis, and impeccable forecasts

Analyst Support

For complete satisfaction

Customization

On-demand customization of scope of the report to exactly meet your needs

TARGETED MARKET VIEW

Targeted market view to provide pertinent information and save time of readers

Get fresh content delivered

Get insights on topics that are crucial for your business. Stay abreast of your interest areas.

Get Industry Data Alerts

Why Allied Market Research?

Infallible Methodology

To ensure high-level data integrity, accurate analysis, and impeccable forecasts

Analyst Support

For complete satisfaction

Customization

On-demand customization of scope of the report to exactly meet your needs

TARGETED MARKET VIEW

Targeted market view to provide pertinent information and save time of readers