
Digital Substation Market Research, 2033
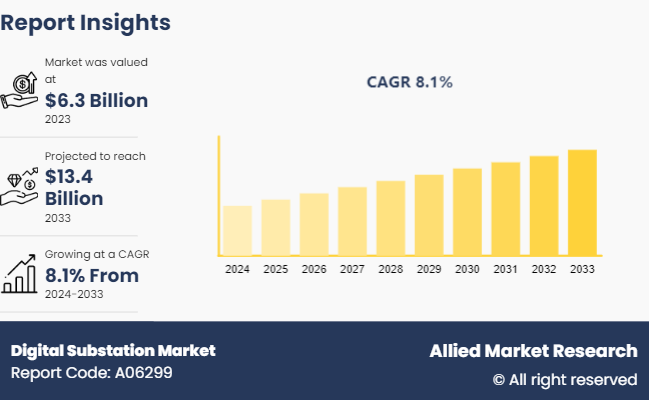
The global digital substation market size was valued at $6.3 billion in 2023, and is projected to reach $13.4 billion by 2033, growing at a CAGR of 8.1% from 2024 to 2033.
Market Definition and Overview
A digital substation is an advanced electrical substation that employs digital technology for the control, protection, automation, and monitoring of the electrical grid. It replaces traditional electromechanical devices with intelligent electronic devices (IEDs) and uses digital communication protocols such as IEC 61850. Digital substations enhance the reliability, efficiency, and safety of power systems by enabling real-time data acquisition, remote monitoring, and automation. They facilitate the integration of renewable energy sources, support smart grid initiatives, and reduce operational and maintenance costs. Key components include digital protection relays, merging units, and process bus systems. Overall, digital substations are a crucial component of modernizing the electrical infrastructure, ensuring more resilient and adaptive power delivery networks.
Key Takeaways
- The digital substation market study covers 20 countries. The research includes a segment analysis of each country in terms of value ($billion) for the projected period from 2024 to 2033.
- More than 1, 500 product literatures, industry releases, annual reports, and other such documents of major digital substation industry participants along with authentic industry journals, trade associations' releases, and government websites have been reviewed for generating high-value industry insights.
- The study integrates high-quality data, professional opinions and analysis, and critical independent perspectives. The research approach intends to provide a balanced view of global markets and assist stakeholders in making informed decisions in order to achieve their most ambitious growth objectives.
Market Dynamics
The digital substation market growth is experiencing significant growth due to the increasing integration of renewable energy sources such as wind and solar power. These renewable sources are characterized by their variable and decentralized nature, necessitating advanced substation technology capable of efficiently managing fluctuations in energy production. Digital substations offer enhanced flexibility, real-time monitoring, and automated controls, which are crucial for maintaining grid stability and optimizing energy flow. As countries worldwide push for greener energy solutions to combat climate change, the demand for digital substations is set to rise, driving innovation and adoption in the sector.
The digital substation market faces a significant restraint due to high initial costs. Implementing digital substations requires substantial investment in advanced equipment, specialized software, and skilled labor. These expenses can be prohibitive, especially for smaller utility companies or those with limited budgets. The high upfront costs can deter adoption despite the long-term benefits, as companies may struggle to justify or secure the necessary funding. This financial barrier can slow the transition from traditional to digital substations in the energy sector.
The digital substation market is poised for significant expansion, driven by the integration of cutting-edge technologies such as the Internet of Things (IoT) , cloud computing, and advanced communication systems. IoT enables real-time monitoring and predictive maintenance, enhancing operational efficiency and reducing downtime. Cloud computing offers scalable storage and processing capabilities, facilitating data analysis and management. Advanced communication technologies ensure seamless and secure data transmission between various substation components and central control units. These technological advancements create opportunities for enhanced grid reliability, improved asset management, and optimized energy distribution. Companies that leverage these innovations can gain a competitive edge, delivering smarter, more resilient power infrastructure solutions in an increasingly digitalized energy landscape.
Parent Market Overview
The digital substation market operates within the global electrical equipment market, which encompasses a wide range of devices and systems used in generation, transmission, distribution, and utilization of electrical power. This market includes equipment such as transformers, switchgear, circuit breakers, transmission towers, and distribution boards, among others. The sector is integral to infrastructure development across residential, commercial, and industrial sectors, driven by the growing need for reliable and efficient electricity supply worldwide. Key trends influencing the market include advancements in smart grid technologies, renewable energy integration, and digitalization of power infrastructure. The electrical equipment market plays a crucial role in supporting modernization efforts in energy networks, enhancing grid stability, and meeting evolving regulatory requirements for safety and environmental sustainability globally.
Market Segmentation
The digital substation market is segmented into type, module, voltage, vertical, and region. On the basis of type, the market is divided into distribution substation and transmission substation. As per module, the market is classified into fiber optic communication network, supervisory control & data acquisition, and hardware. As per voltage, the market is divided into up to 220 kV, 220 kV to 550 kV, and above 550 kV. As per vertical, the market is classified into transportation, mining, metal, and others. Region wise, the market is analyzed across North America, Europe, Asia-Pacific, and LAMEA.
Regional Market Outlook
In North America, the digital substation market share is rapidly evolving due to increasing demand for advanced grid management systems. Key drivers include the need for enhanced reliability, efficiency, and real-time monitoring capabilities in electricity transmission and distribution networks. Technological advancements such as IoT integration, digital sensors, and predictive analytics are transforming traditional substations into intelligent hubs, facilitating smarter energy management and grid optimization. This shift promises greater resilience and operational flexibility across the region's power infrastructure.
- In August 2023, Eaton announced the expansion of its Nacogdoches, Texas manufacturing plant by 200, 000 square feet, doubling production capacity for three-phase transformers and voltage regulators. This expansion aligns with the rising demand for grid modernization solutions, integral to digital substations, which enhance grid reliability, efficiency, and the integration of renewable energy sources.
Competitive Landscape
The major players operating in the digital substation market include General Electric, Siemens, Schneider Electric, Honeywell, ABB, Larsen & Toubro, Emerson, Cisco Systems, Eaton, NR Electric, Cadillac Automation and Controls, and others.
Recent Key Strategies and Developments
- In February 2024, ABB launched SSC600 software, revolutionizing grid management with customizable hardware and advanced protection features. This innovation enhances the reliability of digital substations, transforming power distribution systems through smarter control and monitoring capabilities.
- In January 2020, Siemens launched the SIPROTEC digital substation with EMP technology, implemented at a Center Point Energy site. This innovation bolsters grid resilience against external threats, setting new reliability standards in digital substation technology.
Industry Trends
- In November 2023, Schneider Electric highlighted the importance of digital upgrades for resilient, efficient, sustainable, and flexible grids. The company’s PowerLogic P7 protection relay and EcoStruxure tools support the creation of virtual substation models, enhancing the reliability, efficiency, and management of electrical networks. These innovations are integral to modern digital substations, reducing maintenance costs and optimizing power management throughout their lifespan.
Key Sources Referred
- Annual Reports
- Investor Presentations
- Press Releases
- Research Papers
- D&B Hoovers
- Government websites
- Industry Publications and Journals
- Regulatory Agencies
Key Benefits for Stakeholders
- This report provides a quantitative analysis of the market segments, current trends, estimations, and dynamics of the digital substation market analysis from 2023 to 2033 to identify the prevailing digital substation market opportunities.
- The market research is offered along with information related to key drivers, restraints, and opportunities.
- Porter's five forces analysis highlights the potency of buyers and suppliers to enable stakeholders make profit-oriented business decisions and strengthen their supplier-buyer network.
- In-depth analysis of the digital substation market segmentation assists to determine the prevailing market opportunities.
- Major countries in each region are mapped according to their revenue contribution to the global Digital Substation Market Forecastperiod.
- Market player positioning facilitates benchmarking and provides a clear understanding of the present position of the market players.
Apart from the points mentioned above, the report includes the analysis of the regional as well as global digital substation market trends, key players, market segments, application areas, and market growth strategies.
Digital Substation Market Report Highlights
| Aspects | Details |
| Market Size By 2033 | USD 13.4 Billion |
| Growth Rate | CAGR of 8.1% |
| Forecast period | 2024 - 2033 |
| Report Pages | 300 |
| By Type |
|
| By Module |
|
| By Voltage |
|
| By Vertical |
|
| By Region |
|
| Key Market Players | Cisco Systems, ABB Ltd, NR Electric, Siemens, Emerson, Larsen & Toubro, Honeywell, General Electric, Eaton, Schneider Electric |
Upcoming trends in the global digital substation market include increased adoption of IoT and AI for predictive maintenance, integration with renewable energy sources, and advancements in cybersecurity measures to protect digital infrastructure.
The leading application of digital substation is in transmission substations. These substations benefit most from advanced monitoring, control capabilities, and real-time data exchange, optimizing grid operations for improved reliability, efficiency, and integration of renewable energy sources.
North America is the largest regional market for digital substation.
The digital substation market is estimated to reach $13.3 billion by 2033.
The major players operating in the digital substation market include General Electric, Siemens, Schneider Electric, Honeywell, ABB, Larsen & Toubro, Emerson, Cisco Systems, Eaton, NR Electric, and Cadillac Automation and Controls.
Loading Table Of Content...

