0
2022
Dirt Bike Market

Dirt Bike Market

by Type (Motocross Motorcycle, Enduro Motorcycle, Trail Motorcycle, Track-racing Motorcycle), by Propulsion Type (ICE, Electric), by Application (Commercial, Personal, Industrial, Others), by Price Range (Low to Mid, High): Global Opportunity Analysis and Industry Forecast, 2021-2031

Report Code: A08912
Sep 2022 | Pages: 299
Tables: 199
Charts: 79
  • Formats*:

  • pdf

    Single User License, Five User
    License & Enterprise User License

  • xls

    Data Pack Excel License

  • ppt

    It comes with the additional cost
    of $2500.00 contact sales.


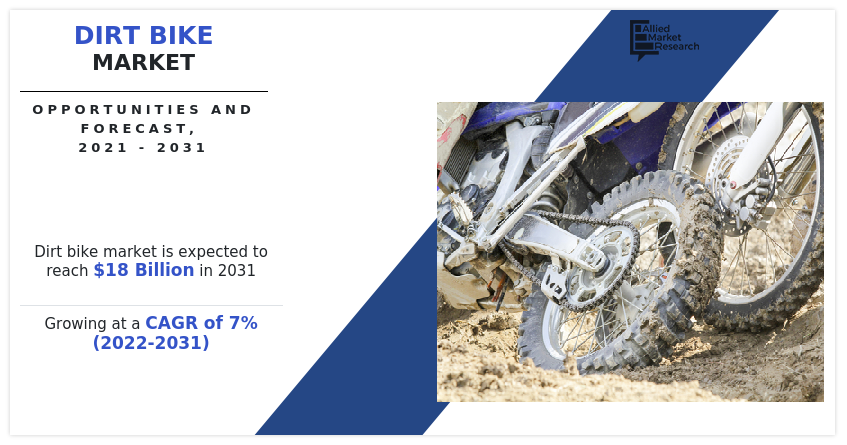
The global dirt bike market was valued at $9.1 billion in 2021, and is projected to reach $18 billion by 2031, growing at a CAGR of 7.0% from 2022 to 2031.

A dirt bike is an off-road motorcycle specialized for riding on rough terrains like rocks, unsurfaced tracks or roads, mud, and dirt. Like regular motorcycles, dirt bikes are two-wheeled but lightweight and have way more rugged suspensions and tires than traditional bikes. Numerous dirt bike types are available for various uses, including racing, touring, and more. Further, the size & functionality of a dirt bike is determined by the rider and the sort of riding. Perhaps the most common type of dirt bike is the motocross bike. A motocross bike is designed primarily for off-road racing; these dirt bikes are built to be fast and robust without adding too much to the bike's overall weight. Currently, motocross has evolved as a major sport worldwide; hence riders or racers are focusing on different aspects of this sporting event.
The COVID-19 outbreak severely impacted the motorcycle sector on a global level, which in turn led to a considerable drop in dirt bike sales. Many small and big players in the motorcycle sector are witnessing issues such as halt of production activities, mandated plant closures by the government, and others. However, various industry leaders in the motorcycle sector are making considerable efforts in restructuring their supply chain and production line for delivery of critical medical supplies. For instance, in 2020, the pandemic is compelling motorcycle makers to skip major motor shows & racing events in the year 2020 and turn towards alternative platforms like digital premieres. It started with Honda organizing, its virtual motorcycle show as the Tokyo Motorcycle Show and Osaka Motorcycle Show was canceled because of COVID-19. However, many dirt bike manufacturers such as KTM AG have assessed their overall strategy for the rest of 2020 and have decided to make several key decisions in the wake of COVID-19 with the withdrawal from global trade shows for the rest of the year, including INTERMOT in Cologne, Germany and the EICMA exhibition in Milan, Italy.

Dirt Bike Market, Dirt Bike Industry

In addition, with the rising trend of motorcycle riding and the growing popularity of dirt bikes, new technologies on dirt bikes have been appearing every day. These bikes are getting more and more advanced every year. For instance, in September 2021, Kawasaki launched two updated dirt motorcycles in India, the Kawasaki KX250 & Kawasaki KX450. Yamaha has not disclosed the power figure of any motorcycles yet but claims to have upped the peak power by 1.2bhp with a hydraulic clutch on both dirt bikes.
Dirt Bike Market

The factors such as rise in popularity & evolution of motocross events, rise in disposable income, and adoption of electric dirt bikes supplement the growth of the dirt bike market. However, high purchase and maintenance cost of dirt bikes and uncomfortable seating structure are the factors expected to hamper the growth of the market. In addition, rising focus by manufacturers in the automobile industry on superior performance & comfort and technology advancement in dirt bikes creates market opportunities for the key players operating in the dirt bike market.

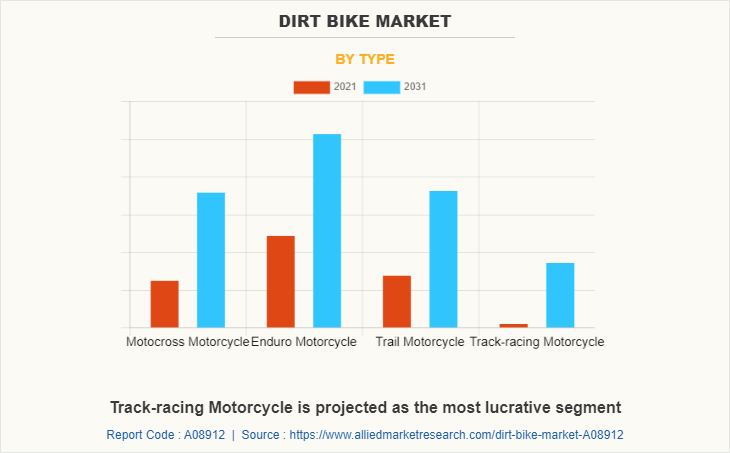
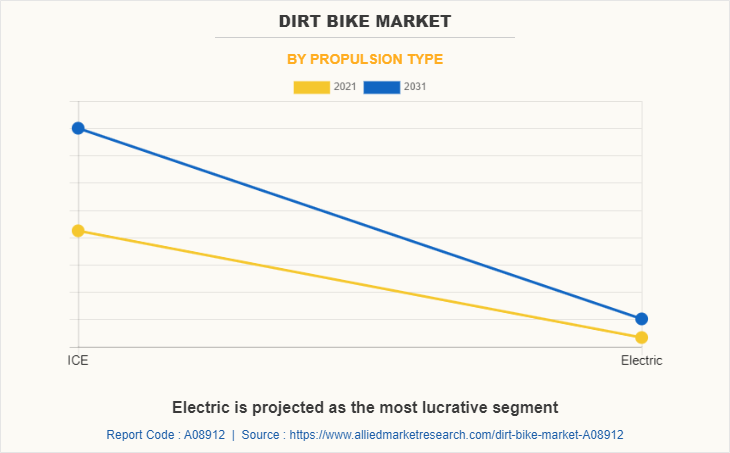
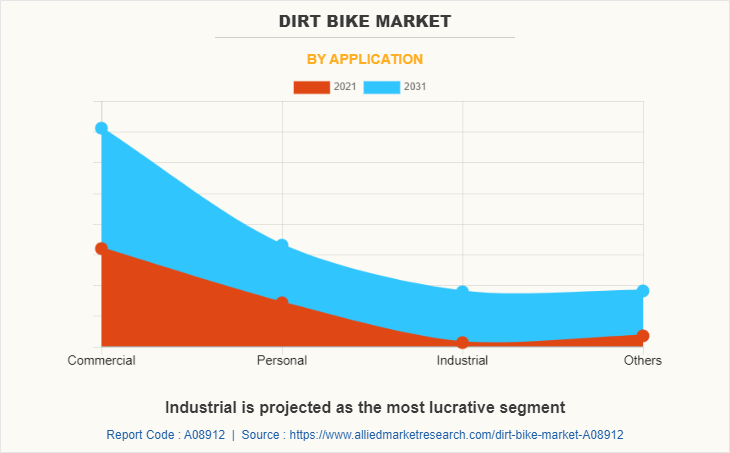
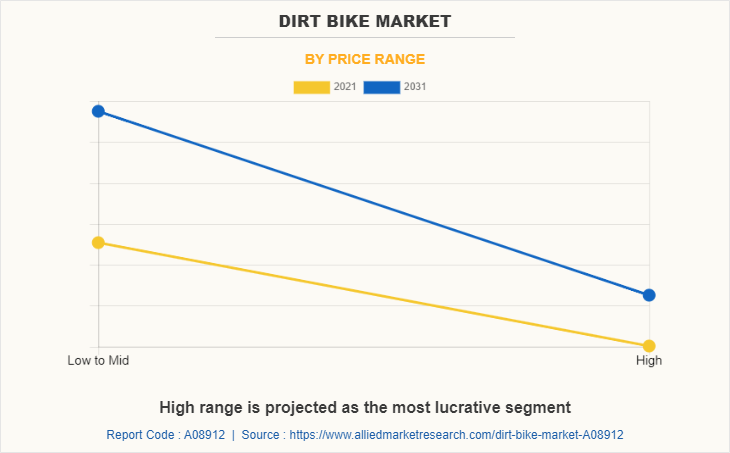
The dirt bike market is segmented into type, propulsion type, application, price range, and region. By type, the market is divided into motocross motorcycle, enduro motorcycle, trail motorcycle, and track-racing motorcycle. By propulsion type, it is fragmented into internal combustion engine (ICE) and electric. By application, it is categorized into commercial, personal, industrial, and others. By price range, it is further classified into low to mid and high. By region, it is analyzed across North America, Europe, Asia-Pacific, and LAMEA.
Dirt Bike Market

The leading players operating in the dirt bike market are Benelli, Betamotor S.p.A., BMW AG, Bultaco Bikes, Cobra Moto, Honda Motor Co., Ltd., Husqvarna motorcycles, Kawasaki Heavy Industries, Ltd., KTM AG, Piaggio & C. SpA (Aprilla), Polini motori, Scorpa, Sherco, SSR Motorsports, Suzuki Motor Corporation, Yamaha Corporation, and Zero Motorcycles, Inc.

Rise in popularity & evolution of motocross events

Motocross racing was first introduced in the UK. This type of motorcycle racing takes place on physically demanding off-road tracks. Motocross racing events are held in almost all-weather conditions making it more difficult for the participants. Currently, motocross has evolved as a major sport worldwide, and riders or racers need to focus on different aspects of this sporting event. For instance, motocross has garnered more fans in China after the Motocross World Championship, the most influential of the sport's events globally, hosted its annual showcase at the China International Import Expo in Shanghai for two consecutive years from 2020 to 2021. The event entered China for the first time in 2019, filling the gap in first-class motocross events in the country. Also, increased focus on R&D in the dirt bikes and their ability to improve their reliability and safety, especially regarding the safety of the riders and the spectators, supported the market’s growth. Hence, the rise in popularity & evolution of motocross events primarily drive the growth of the dirt bike market.
Dirt Bike Market

Adoption of electric dirt bikes

Governments of various countries are taking initiatives to reduce their carbon footprints by encouraging the use of small electric vehicles such as electric dirt bikes, fuel cell bikes, and e-scooters, owing to increased awareness of the hazardous effects of using vehicles running on fossil fuels. Furthermore, governments worldwide support the purchase of electric dirt bikes in terms of tax credits and incentives to encourage the use of these bikes. Besides, the maintenance of the electric dirt bike is also less due to fewer moving parts, as these bikes are extremely quiet. Considering the advantages offered by the electrification of dirt bikes, automakers are investing in producing an electric dirt bikes. For instance, in July 2021, Zero Motorcycles, Inc. launched the Zero FXE electric dirt bike. It featured a 7.2kWh battery pack with a promised range of 161 km with two riding modes, eco, and sport. Hence, the favorable government regulations to reduce carbon footprints lead to the adoption of electric dirt bikes, propelling the market’s growth.   
Dirt Bike Market

High purchase and maintenance cost of dirt bikes

The high cost of dirt bikes is a major factor that restrains the growth of the dirt bike market. Dirt bikes are typically outfitted with high-performance shocks, brakes, and engines that can withstand the demands of off-road riding. As a result, dirt bikes can range in price from a few hundred dollars to several thousand. Also, dirt bikes require regular maintenance to keep them running correctly. Hence, the upsurge in adopting dirt bikes in other than developed countries, such as China and the U.S., is limited by high costs. Therefore, high maintenance, as well as the purchase cost, is a significant factor that restrains the growth of the dirt bike industry.

Technology advancement in dirt bikes

With the growing popularity of dirt bikes, new technologies on dirt bikes have been appearing every day. They are getting more and more advanced every year. The goal is to one-day make a solar-powered dirt bike. Hence, consumers are eager to welcome innovations in the automobile industry regarding rough, strong, and high-speed dirt bikes. Also, female consumers are inclined towards off-road bike riding. Therefore, raising technological innovation in the automobile industry increases the demand for dirt bikes which helps to drive the growth of the market. For instance, in May 2019, Hero launched XPulse 200, XPulse 200T, and Xtreme 200S off-road motorcycles (dirt bikes). This product was found to provide 200cc vehicles at a low price. Furthermore, dirt bike manufacturers are also focusing on new inventions related to frame metals, riding styles, and shapes to make them more advanced. Thus, the continuous focus & improvement in dirt bikes owing to their demand is expected to offer lucrative growth opportunities for the dirt bike market.
Dirt Bike Market

Key Benefits For Stakeholders

  • This study presents analytical depiction of the global dirt bike market analysis along with current trends and future estimations to depict imminent investment pockets.
  • The overall dirt bike market opportunity is determined by understanding profitable trends to gain a stronger foothold.
  • The report presents information related to the key drivers, restraints, and opportunities of the global dirt bike market with a detailed impact analysis.
  • The current dirt bike market is quantitatively analyzed from 2022 to 2031 to benchmark the financial competency.
  • Porter’s five forces analysis illustrates the potency of the buyers and suppliers in the industry.

Dirt Bike Market Report Highlights

Aspects Details
Market Size By 2031 USD 18 billion
Growth Rate CAGR of 7%
Forecast period 2021 - 2031
Report Pages 299
By Type
  • Motocross Motorcycle
  • Enduro Motorcycle
  • Trail Motorcycle
  • Track-racing Motorcycle
By Propulsion Type
  • ICE
  • Electric
By Application
  • Commercial
  • Personal
  • Industrial
  • Others
By Price Range
  • Low to Mid
  • High
By Region
  • North America  (U.S., Canada, Mexico)
  • Europe  (UK, Germany, France, Italy, Rest Of Europe)
  • Asia-Pacific  (China, Japan, India, South Korea, Rest Of Asia-Pacific)
  • LAMEA  (Latin America, Middle East, Africa)
Key Market Players Betamotor S.p.A., Honda Motor Co., Ltd., Zero Motorcycles, Inc., Cobra MOTO, Suzuki Motor Corporation, Benelli, Piaggio & C. SpA, Yamaha Corporation, Husqvarna Motorcycles, KTM AG, POLINI MOTORI, Bultaco Bikes, BMW AG, Scorpa, Sherco, Kawasaki Heavy Industries, Ltd., SSR Motorsports
 
  • CHAPTER 1:INTRODUCTION

    • 1.1.Report description

    • 1.2.Key market segments

    • 1.3.Key benefits to the stakeholders

    • 1.4.Research Methodology

      • 1.4.1.Secondary research

      • 1.4.2.Primary research

      • 1.4.3.Analyst tools and models

  • CHAPTER 2:EXECUTIVE SUMMARY

    • 2.1.Key findings of the study

    • 2.2.CXO Perspective

  • CHAPTER 3:MARKET OVERVIEW

    • 3.1.Market definition and scope

    • 3.2.Key findings

      • 3.2.1.Top investment pockets

    • 3.3.Porter’s five forces analysis

    • 3.4.Top player positioning

    • 3.5.Market dynamics

      • 3.5.1.Drivers

      • 3.5.2.Restraints

      • 3.5.3.Opportunities

    • 3.6.COVID-19 Impact Analysis on the market

  • CHAPTER 4: DIRT BIKE MARKET, BY TYPE

    • 4.1 Overview

      • 4.1.1 Market size and forecast

    • 4.2 Motocross Motorcycle

      • 4.2.1 Key market trends, growth factors and opportunities

      • 4.2.2 Market size and forecast, by region

      • 4.2.3 Market analysis by country

    • 4.3 Enduro Motorcycle

      • 4.3.1 Key market trends, growth factors and opportunities

      • 4.3.2 Market size and forecast, by region

      • 4.3.3 Market analysis by country

    • 4.4 Trail Motorcycle

      • 4.4.1 Key market trends, growth factors and opportunities

      • 4.4.2 Market size and forecast, by region

      • 4.4.3 Market analysis by country

    • 4.5 Track-racing Motorcycle

      • 4.5.1 Key market trends, growth factors and opportunities

      • 4.5.2 Market size and forecast, by region

      • 4.5.3 Market analysis by country

  • CHAPTER 5: DIRT BIKE MARKET, BY PROPULSION TYPE

    • 5.1 Overview

      • 5.1.1 Market size and forecast

    • 5.2 ICE

      • 5.2.1 Key market trends, growth factors and opportunities

      • 5.2.2 Market size and forecast, by region

      • 5.2.3 Market analysis by country

    • 5.3 Electric

      • 5.3.1 Key market trends, growth factors and opportunities

      • 5.3.2 Market size and forecast, by region

      • 5.3.3 Market analysis by country

  • CHAPTER 6: DIRT BIKE MARKET, BY APPLICATION

    • 6.1 Overview

      • 6.1.1 Market size and forecast

    • 6.2 Commercial

      • 6.2.1 Key market trends, growth factors and opportunities

      • 6.2.2 Market size and forecast, by region

      • 6.2.3 Market analysis by country

    • 6.3 Personal

      • 6.3.1 Key market trends, growth factors and opportunities

      • 6.3.2 Market size and forecast, by region

      • 6.3.3 Market analysis by country

    • 6.4 Industrial

      • 6.4.1 Key market trends, growth factors and opportunities

      • 6.4.2 Market size and forecast, by region

      • 6.4.3 Market analysis by country

    • 6.5 Others

      • 6.5.1 Key market trends, growth factors and opportunities

      • 6.5.2 Market size and forecast, by region

      • 6.5.3 Market analysis by country

  • CHAPTER 7: DIRT BIKE MARKET, BY PRICE RANGE

    • 7.1 Overview

      • 7.1.1 Market size and forecast

    • 7.2 Low to Mid

      • 7.2.1 Key market trends, growth factors and opportunities

      • 7.2.2 Market size and forecast, by region

      • 7.2.3 Market analysis by country

    • 7.3 High

      • 7.3.1 Key market trends, growth factors and opportunities

      • 7.3.2 Market size and forecast, by region

      • 7.3.3 Market analysis by country

  • CHAPTER 8: DIRT BIKE MARKET, BY REGION

    • 8.1 Overview

      • 8.1.1 Market size and forecast

    • 8.2 North America

      • 8.2.1 Key trends and opportunities

      • 8.2.2 North America Market size and forecast, by Type

      • 8.2.3 North America Market size and forecast, by Propulsion Type

      • 8.2.4 North America Market size and forecast, by Application

      • 8.2.5 North America Market size and forecast, by Price Range

      • 8.2.6 North America Market size and forecast, by country

        • 8.2.6.1 U.S.
          • 8.2.6.1.1 Market size and forecast, by Type
          • 8.2.6.1.2 Market size and forecast, by Propulsion Type
          • 8.2.6.1.3 Market size and forecast, by Application
          • 8.2.6.1.4 Market size and forecast, by Price Range
        • 8.2.6.2 Canada
          • 8.2.6.2.1 Market size and forecast, by Type
          • 8.2.6.2.2 Market size and forecast, by Propulsion Type
          • 8.2.6.2.3 Market size and forecast, by Application
          • 8.2.6.2.4 Market size and forecast, by Price Range
        • 8.2.6.3 Mexico
          • 8.2.6.3.1 Market size and forecast, by Type
          • 8.2.6.3.2 Market size and forecast, by Propulsion Type
          • 8.2.6.3.3 Market size and forecast, by Application
          • 8.2.6.3.4 Market size and forecast, by Price Range
    • 8.3 Europe

      • 8.3.1 Key trends and opportunities

      • 8.3.2 Europe Market size and forecast, by Type

      • 8.3.3 Europe Market size and forecast, by Propulsion Type

      • 8.3.4 Europe Market size and forecast, by Application

      • 8.3.5 Europe Market size and forecast, by Price Range

      • 8.3.6 Europe Market size and forecast, by country

        • 8.3.6.1 UK
          • 8.3.6.1.1 Market size and forecast, by Type
          • 8.3.6.1.2 Market size and forecast, by Propulsion Type
          • 8.3.6.1.3 Market size and forecast, by Application
          • 8.3.6.1.4 Market size and forecast, by Price Range
        • 8.3.6.2 Germany
          • 8.3.6.2.1 Market size and forecast, by Type
          • 8.3.6.2.2 Market size and forecast, by Propulsion Type
          • 8.3.6.2.3 Market size and forecast, by Application
          • 8.3.6.2.4 Market size and forecast, by Price Range
        • 8.3.6.3 France
          • 8.3.6.3.1 Market size and forecast, by Type
          • 8.3.6.3.2 Market size and forecast, by Propulsion Type
          • 8.3.6.3.3 Market size and forecast, by Application
          • 8.3.6.3.4 Market size and forecast, by Price Range
        • 8.3.6.4 Italy
          • 8.3.6.4.1 Market size and forecast, by Type
          • 8.3.6.4.2 Market size and forecast, by Propulsion Type
          • 8.3.6.4.3 Market size and forecast, by Application
          • 8.3.6.4.4 Market size and forecast, by Price Range
        • 8.3.6.5 Rest of Europe
          • 8.3.6.5.1 Market size and forecast, by Type
          • 8.3.6.5.2 Market size and forecast, by Propulsion Type
          • 8.3.6.5.3 Market size and forecast, by Application
          • 8.3.6.5.4 Market size and forecast, by Price Range
    • 8.4 Asia-Pacific

      • 8.4.1 Key trends and opportunities

      • 8.4.2 Asia-Pacific Market size and forecast, by Type

      • 8.4.3 Asia-Pacific Market size and forecast, by Propulsion Type

      • 8.4.4 Asia-Pacific Market size and forecast, by Application

      • 8.4.5 Asia-Pacific Market size and forecast, by Price Range

      • 8.4.6 Asia-Pacific Market size and forecast, by country

        • 8.4.6.1 China
          • 8.4.6.1.1 Market size and forecast, by Type
          • 8.4.6.1.2 Market size and forecast, by Propulsion Type
          • 8.4.6.1.3 Market size and forecast, by Application
          • 8.4.6.1.4 Market size and forecast, by Price Range
        • 8.4.6.2 Japan
          • 8.4.6.2.1 Market size and forecast, by Type
          • 8.4.6.2.2 Market size and forecast, by Propulsion Type
          • 8.4.6.2.3 Market size and forecast, by Application
          • 8.4.6.2.4 Market size and forecast, by Price Range
        • 8.4.6.3 India
          • 8.4.6.3.1 Market size and forecast, by Type
          • 8.4.6.3.2 Market size and forecast, by Propulsion Type
          • 8.4.6.3.3 Market size and forecast, by Application
          • 8.4.6.3.4 Market size and forecast, by Price Range
        • 8.4.6.4 South Korea
          • 8.4.6.4.1 Market size and forecast, by Type
          • 8.4.6.4.2 Market size and forecast, by Propulsion Type
          • 8.4.6.4.3 Market size and forecast, by Application
          • 8.4.6.4.4 Market size and forecast, by Price Range
        • 8.4.6.5 Rest of Asia-Pacific
          • 8.4.6.5.1 Market size and forecast, by Type
          • 8.4.6.5.2 Market size and forecast, by Propulsion Type
          • 8.4.6.5.3 Market size and forecast, by Application
          • 8.4.6.5.4 Market size and forecast, by Price Range
    • 8.5 LAMEA

      • 8.5.1 Key trends and opportunities

      • 8.5.2 LAMEA Market size and forecast, by Type

      • 8.5.3 LAMEA Market size and forecast, by Propulsion Type

      • 8.5.4 LAMEA Market size and forecast, by Application

      • 8.5.5 LAMEA Market size and forecast, by Price Range

      • 8.5.6 LAMEA Market size and forecast, by country

        • 8.5.6.1 Latin America
          • 8.5.6.1.1 Market size and forecast, by Type
          • 8.5.6.1.2 Market size and forecast, by Propulsion Type
          • 8.5.6.1.3 Market size and forecast, by Application
          • 8.5.6.1.4 Market size and forecast, by Price Range
        • 8.5.6.2 Middle East
          • 8.5.6.2.1 Market size and forecast, by Type
          • 8.5.6.2.2 Market size and forecast, by Propulsion Type
          • 8.5.6.2.3 Market size and forecast, by Application
          • 8.5.6.2.4 Market size and forecast, by Price Range
        • 8.5.6.3 Africa
          • 8.5.6.3.1 Market size and forecast, by Type
          • 8.5.6.3.2 Market size and forecast, by Propulsion Type
          • 8.5.6.3.3 Market size and forecast, by Application
          • 8.5.6.3.4 Market size and forecast, by Price Range
  • CHAPTER 9: COMPANY LANDSCAPE

    • 9.1. Introduction

    • 9.2. Top winning strategies

    • 9.3. Product Mapping of Top 10 Player

    • 9.4. Competitive Dashboard

    • 9.5. Competitive Heatmap

    • 9.6. Key developments

  • CHAPTER 10: COMPANY PROFILES

    • 10.1 Benelli

      • 10.1.1 Company overview

      • 10.1.2 Company snapshot

      • 10.1.3 Operating business segments

      • 10.1.4 Product portfolio

      • 10.1.5 Business performance

      • 10.1.6 Key strategic moves and developments

    • 10.2 Betamotor S.p.A.

      • 10.2.1 Company overview

      • 10.2.2 Company snapshot

      • 10.2.3 Operating business segments

      • 10.2.4 Product portfolio

      • 10.2.5 Business performance

      • 10.2.6 Key strategic moves and developments

    • 10.3 BMW AG

      • 10.3.1 Company overview

      • 10.3.2 Company snapshot

      • 10.3.3 Operating business segments

      • 10.3.4 Product portfolio

      • 10.3.5 Business performance

      • 10.3.6 Key strategic moves and developments

    • 10.4 Bultaco Bikes

      • 10.4.1 Company overview

      • 10.4.2 Company snapshot

      • 10.4.3 Operating business segments

      • 10.4.4 Product portfolio

      • 10.4.5 Business performance

      • 10.4.6 Key strategic moves and developments

    • 10.5 Cobra MOTO

      • 10.5.1 Company overview

      • 10.5.2 Company snapshot

      • 10.5.3 Operating business segments

      • 10.5.4 Product portfolio

      • 10.5.5 Business performance

      • 10.5.6 Key strategic moves and developments

    • 10.6 Honda Motor Co., Ltd.

      • 10.6.1 Company overview

      • 10.6.2 Company snapshot

      • 10.6.3 Operating business segments

      • 10.6.4 Product portfolio

      • 10.6.5 Business performance

      • 10.6.6 Key strategic moves and developments

    • 10.7 Husqvarna Motorcycles

      • 10.7.1 Company overview

      • 10.7.2 Company snapshot

      • 10.7.3 Operating business segments

      • 10.7.4 Product portfolio

      • 10.7.5 Business performance

      • 10.7.6 Key strategic moves and developments

    • 10.8 Kawasaki Heavy Industries, Ltd.

      • 10.8.1 Company overview

      • 10.8.2 Company snapshot

      • 10.8.3 Operating business segments

      • 10.8.4 Product portfolio

      • 10.8.5 Business performance

      • 10.8.6 Key strategic moves and developments

    • 10.9 KTM AG

      • 10.9.1 Company overview

      • 10.9.2 Company snapshot

      • 10.9.3 Operating business segments

      • 10.9.4 Product portfolio

      • 10.9.5 Business performance

      • 10.9.6 Key strategic moves and developments

    • 10.10 Piaggio & C. SpA

      • 10.10.1 Company overview

      • 10.10.2 Company snapshot

      • 10.10.3 Operating business segments

      • 10.10.4 Product portfolio

      • 10.10.5 Business performance

      • 10.10.6 Key strategic moves and developments

    • 10.11 POLINI MOTORI

      • 10.11.1 Company overview

      • 10.11.2 Company snapshot

      • 10.11.3 Operating business segments

      • 10.11.4 Product portfolio

      • 10.11.5 Business performance

      • 10.11.6 Key strategic moves and developments

    • 10.12 Scorpa

      • 10.12.1 Company overview

      • 10.12.2 Company snapshot

      • 10.12.3 Operating business segments

      • 10.12.4 Product portfolio

      • 10.12.5 Business performance

      • 10.12.6 Key strategic moves and developments

    • 10.13 Sherco

      • 10.13.1 Company overview

      • 10.13.2 Company snapshot

      • 10.13.3 Operating business segments

      • 10.13.4 Product portfolio

      • 10.13.5 Business performance

      • 10.13.6 Key strategic moves and developments

    • 10.14 SSR Motorsports

      • 10.14.1 Company overview

      • 10.14.2 Company snapshot

      • 10.14.3 Operating business segments

      • 10.14.4 Product portfolio

      • 10.14.5 Business performance

      • 10.14.6 Key strategic moves and developments

    • 10.15 Suzuki Motor Corporation

      • 10.15.1 Company overview

      • 10.15.2 Company snapshot

      • 10.15.3 Operating business segments

      • 10.15.4 Product portfolio

      • 10.15.5 Business performance

      • 10.15.6 Key strategic moves and developments

    • 10.16 Yamaha Corporation

      • 10.16.1 Company overview

      • 10.16.2 Company snapshot

      • 10.16.3 Operating business segments

      • 10.16.4 Product portfolio

      • 10.16.5 Business performance

      • 10.16.6 Key strategic moves and developments

    • 10.17 Zero Motorcycles, Inc.

      • 10.17.1 Company overview

      • 10.17.2 Company snapshot

      • 10.17.3 Operating business segments

      • 10.17.4 Product portfolio

      • 10.17.5 Business performance

      • 10.17.6 Key strategic moves and developments

  • LIST OF TABLES

  • TABLE 01. DIRT BIKE MARKET, BY TYPE, 2021-2031 ($MILLION)
    TABLE 02. DIRT BIKE MARKET FOR MOTOCROSS MOTORCYCLE, BY REGION, 2021-2031 ($MILLION)
    TABLE 03. DIRT BIKE MARKET FOR ENDURO MOTORCYCLE, BY REGION, 2021-2031 ($MILLION)
    TABLE 04. DIRT BIKE MARKET FOR TRAIL MOTORCYCLE, BY REGION, 2021-2031 ($MILLION)
    TABLE 05. DIRT BIKE MARKET FOR TRACK-RACING MOTORCYCLE, BY REGION, 2021-2031 ($MILLION)
    TABLE 06. DIRT BIKE MARKET, BY PROPULSION TYPE, 2021-2031 ($MILLION)
    TABLE 07. DIRT BIKE MARKET FOR INTERNAL COMBUSTION ENGINE (ICE), BY REGION 2021-2031 ($MILLION)
    TABLE 08. DIRT BIKE MARKET FOR ELECTRIC, BY REGION 2021-2031 ($MILLION)
    TABLE 09. DIRT BIKE MARKET, BY APPLICATION, 2021-2031 ($MILLION)
    TABLE 10. DIRT BIKE MARKET FOR COMMERCIAL, BY REGION 2021-2031 ($MILLION)
    TABLE 11. DIRT BIKE MARKET FOR COMMERCIAL, FOR COMMERCIAL, BY PRICE RANGE, 2021-2031 ($MILLION)
    TABLE 12. DIRT BIKE MARKET FOR PERSONAL, BY REGION 2021-2031 ($MILLION)
    TABLE 13. DIRT BIKE MARKET FOR COMMERCIAL, FOR PERSONAL, BY PRICE RANGE, 2021-2031 ($MILLION)
    TABLE 14. DIRT BIKE MARKET FOR INDUSTRIAL, BY REGION 2021-2031 ($MILLION)
    TABLE 15. DIRT BIKE MARKET FOR COMMERCIAL, FOR INDUSTRIAL, BY PRICE RANGE, 2021-2031 ($MILLION)
    TABLE 16. DIRT BIKE MARKET FOR OTHERS, BY REGION 2021-2031 ($MILLION)
    TABLE 17. DIRT BIKE MARKET FOR COMMERCIAL, FOR OTHERS, BY PRICE RANGE, 2021-2031 ($MILLION)
    TABLE 18. DIRT BIKE MARKET, BY PRICE RANGE, 2021-2031 ($MILLION)
    TABLE 19. DIRT BIKE MARKET FOR LOW TO MID, BY REGION 2021-2031 ($MILLION)
    TABLE 20. DIRT BIKE MARKET FOR HIGH, BY REGION 2021-2031 ($MILLION)
    TABLE 21. DIRT BIKE MARKET, BY REGION, 2021-2031 ($MILLION)
    TABLE 22. NORTH AMERICA DIRT BIKE MARKET, BY COUNTRY, 2021-2031 ($MILLION)
    TABLE 23. NORTH AMERICA DIRT BIKE MARKET, BY TYPE, 2021-2031 ($MILLION)
    TABLE 24. NORTH AMERICA DIRT BIKE MARKET, BY PROPULSION TYPE, 2021-2031 ($MILLION)
    TABLE 25. NORTH AMERICA DIRT BIKE MARKET, BY APPLICATION, 2021-2031 ($MILLION)
    TABLE 26. NORTH AMERICA DIRT BIKE MARKET, FOR COMMERCIAL, BY PRICE RANGE, 2021-2031 ($MILLION)
    TABLE 27. NORTH AMERICA DIRT BIKE MARKET, FOR PERSONAL, BY PRICE RANGE, 2021-2031 ($MILLION)
    TABLE 28. NORTH AMERICA DIRT BIKE MARKET, FOR INDUSTRIAL, BY PRICE RANGE, 2021-2031 ($MILLION)
    TABLE 29. NORTH AMERICA DIRT BIKE MARKET, FOR OTHERS, BY PRICE RANGE, 2021-2031 ($MILLION)
    TABLE 30. NORTH AMERICA DIRT BIKE MARKET, PRICE RANGE, 2021-2031 ($MILLION)
    TABLE 31. U.S. DIRT BIKE MARKET, BY TYPE, 2021-2031 ($MILLION)
    TABLE 32. U.S. DIRT BIKE MARKET, BY PROPULSION TYPE, 2021-2031 ($MILLION)
    TABLE 33. U.S. DIRT BIKE MARKET, BY APPLICATION, 2021-2031 ($MILLION)
    TABLE 34. U.S. DIRT BIKE MARKET, BY PRICE RANGE, 2021-2031 ($MILLION)
    TABLE 35. CANADA DIRT BIKE MARKET, BY TYPE, 2021-2031 ($MILLION)
    TABLE 36. CANADA DIRT BIKE MARKET, BY PROPULSION TYPE, 2021-2031 ($MILLION)
    TABLE 37. CANADA DIRT BIKE MARKET, BY APPLICATION, 2021-2031 ($MILLION)
    TABLE 38. CANADA DIRT BIKE MARKET, BY PRICE RANGE, 2021-2031 ($MILLION)
    TABLE 39. MEXICO DIRT BIKE MARKET, BY TYPE, 2021-2031 ($MILLION)
    TABLE 40. MEXICO DIRT BIKE MARKET, BY PROPULSION TYPE, 2021-2031 ($MILLION)
    TABLE 41. MEXICO DIRT BIKE MARKET, BY APPLICATION, 2021-2031 ($MILLION)
    TABLE 42. MEXICO DIRT BIKE MARKET, BY PRICE RANGE, 2021-2031 ($MILLION)
    TABLE 43. EUROPE DIRT BIKE MARKET, BY COUNTRY, 2021-2031 ($MILLION)
    TABLE 44. EUROPE DIRT BIKE MARKET, BY TYPE, 2021-2031 ($MILLION)
    TABLE 45. EUROPE DIRT BIKE MARKET, BY PROPULSION TYPE, 2021-2031 ($MILLION)
    TABLE 46. EUROPE DIRT BIKE MARKET, BY APPLICATION, 2021-2031 ($MILLION)
    TABLE 47. EUROPE DIRT BIKE MARKET, FOR COMMERCIAL, BY PRICE RANGE, 2021-2031 ($MILLION)
    TABLE 48. EUROPE DIRT BIKE MARKET, FOR PERSONAL, BY PRICE RANGE, 2021-2031 ($MILLION)
    TABLE 49. EUROPE DIRT BIKE MARKET, FOR INDUSTRIAL, BY PRICE RANGE, 2021-2031 ($MILLION)
    TABLE 50. EUROPE DIRT BIKE MARKET, FOR OTHERS, BY PRICE RANGE, 2021-2031 ($MILLION)
    TABLE 51. EUROPE DIRT BIKE MARKET, PRICE RANGE, 2021-2031 ($MILLION)
    TABLE 52. UK DIRT BIKE MARKET, BY TYPE, 2021-2031 ($MILLION)
    TABLE 53. UK DIRT BIKE MARKET, BY PROPULSION TYPE, 2021-2031 ($MILLION)
    TABLE 54. UK DIRT BIKE MARKET, BY APPLICATION, 2021-2031 ($MILLION)
    TABLE 55. UK DIRT BIKE MARKET, BY PRICE RANGE, 2021-2031 ($MILLION)
    TABLE 56. GERMANY DIRT BIKE MARKET, BY TYPE, 2021-2031 ($MILLION)
    TABLE 57. GERMANY DIRT BIKE MARKET, BY PROPULSION TYPE, 2021-2031 ($MILLION)
    TABLE 58. GERMANY DIRT BIKE MARKET, BY APPLICATION, 2021-2031 ($MILLION)
    TABLE 59. GERMANY DIRT BIKE MARKET, BY PRICE RANGE, 2021-2031 ($MILLION)
    TABLE 60. FRANCE DIRT BIKE MARKET, BY TYPE, 2021-2031 ($MILLION)
    TABLE 61. FRANCE DIRT BIKE MARKET, BY PROPULSION TYPE, 2021-2031 ($MILLION)
    TABLE 62. FRANCE DIRT BIKE MARKET, BY APPLICATION, 2021-2031 ($MILLION)
    TABLE 63. FRANCE DIRT BIKE MARKET, BY PRICE RANGE, 2021-2031 ($MILLION)
    TABLE 64. ITALY DIRT BIKE MARKET, BY TYPE, 2021-2031 ($MILLION)
    TABLE 65. ITALY DIRT BIKE MARKET, BY PROPULSION TYPE, 2021-2031 ($MILLION)
    TABLE 66. ITALY DIRT BIKE MARKET, BY APPLICATION, 2021-2031 ($MILLION)
    TABLE 67. ITALY DIRT BIKE MARKET, BY PRICE RANGE, 2021-2031 ($MILLION)
    TABLE 68. REST OF EUROPE DIRT BIKE MARKET, BY TYPE, 2021-2031 ($MILLION)
    TABLE 69. REST OF EUROPE DIRT BIKE MARKET, BY PROPULSION TYPE, 2021-2031 ($MILLION)
    TABLE 70. REST OF EUROPE DIRT BIKE MARKET, BY APPLICATION, 2021-2031 ($MILLION)
    TABLE 71. REST OF EUROPE DIRT BIKE MARKET, BY PRICE RANGE, 2021-2031 ($MILLION)
    TABLE 72. ASIA-PACIFIC DIRT BIKE MARKET, BY COUNTRY, 2021-2031 ($MILLION)
    TABLE 73. ASIA-PACIFIC DIRT BIKE MARKET, BY TYPE, 2021-2031 ($MILLION)
    TABLE 74. ASIA-PACIFIC DIRT BIKE MARKET, BY PROPULSION TYPE, 2021-2031 ($MILLION)
    TABLE 75. ASIA-PACIFIC DIRT BIKE MARKET, BY APPLICATION, 2021-2031 ($MILLION)
    TABLE 76. ASIA-PACIFIC DIRT BIKE MARKET, FOR COMMERCIAL, BY PRICE RANGE, 2021-2031 ($MILLION)
    TABLE 77. ASIA-PACIFIC DIRT BIKE MARKET, FOR PERSONAL, BY PRICE RANGE, 2021-2031 ($MILLION)
    TABLE 78. ASIA-PACIFIC DIRT BIKE MARKET, FOR INDUSTRIAL, BY PRICE RANGE, 2021-2031 ($MILLION)
    TABLE 79. ASIA-PACIFIC DIRT BIKE MARKET, FOR OTHERS, BY PRICE RANGE, 2021-2031 ($MILLION)
    TABLE 80. ASIA-PACIFIC DIRT BIKE MARKET, PRICE RANGE, 2021-2031 ($MILLION)
    TABLE 81. CHINA DIRT BIKE MARKET, BY TYPE, 2021-2031 ($MILLION)
    TABLE 82. CHINA DIRT BIKE MARKET, BY PROPULSION TYPE, 2021-2031 ($MILLION)
    TABLE 83. CHINA DIRT BIKE MARKET, BY APPLICATION, 2021-2031 ($MILLION)
    TABLE 84. CHINA DIRT BIKE MARKET, BY PRICE RANGE, 2021-2031 ($MILLION)
    TABLE 85. JAPAN DIRT BIKE MARKET, BY TYPE, 2021-2031 ($MILLION)
    TABLE 86. JAPAN DIRT BIKE MARKET, BY PROPULSION TYPE, 2021-2031 ($MILLION)
    TABLE 87. JAPAN DIRT BIKE MARKET, BY APPLICATION, 2021-2031 ($MILLION)
    TABLE 88. JAPAN DIRT BIKE MARKET, BY PRICE RANGE, 2021-2031 ($MILLION)
    TABLE 89. INDIA DIRT BIKE MARKET, BY TYPE, 2021-2031 ($MILLION)
    TABLE 90. INDIA DIRT BIKE MARKET, BY PROPULSION TYPE, 2021-2031 ($MILLION)
    TABLE 91. INDIA DIRT BIKE MARKET, BY APPLICATION, 2021-2031 ($MILLION)
    TABLE 92. INDIA DIRT BIKE MARKET, BY PRICE RANGE, 2021-2031 ($MILLION)
    TABLE 93. SOUTH KOREA DIRT BIKE MARKET, BY TYPE, 2021-2031 ($MILLION)
    TABLE 94. SOUTH KOREA DIRT BIKE MARKET, BY PROPULSION TYPE, 2021-2031 ($MILLION)
    TABLE 95. SOUTH KOREA DIRT BIKE MARKET, BY APPLICATION, 2021-2031 ($MILLION)
    TABLE 96. SOUTH KOREA DIRT BIKE MARKET, BY PRICE RANGE, 2021-2031 ($MILLION)
    TABLE 97. REST OF ASIA-PACIFIC DIRT BIKE MARKET, BY TYPE, 2021-2031 ($MILLION)
    TABLE 98. REST OF ASIA-PACIFIC DIRT BIKE MARKET, BY PROPULSION TYPE, 2021-2031 ($MILLION)
    TABLE 99. REST OF ASIA-PACIFIC DIRT BIKE MARKET, BY APPLICATION, 2021-2031 ($MILLION)
    TABLE 100. REST OF ASIA-PACIFIC DIRT BIKE MARKET, BY PRICE RANGE, 2021-2031 ($MILLION)
    TABLE 101. LAMEA DIRT BIKE MARKET, BY COUNTRY, 2021-2031 ($MILLION)
    TABLE 102. LAMEA DIRT BIKE MARKET, BY TYPE, 2021-2031 ($MILLION)
    TABLE 103. LAMEA DIRT BIKE MARKET, BY PROPULSION TYPE, 2021-2031 ($MILLION)
    TABLE 104. LAMEA DIRT BIKE MARKET, BY APPLICATION, 2021-2031 ($MILLION)
    TABLE 105. LAMEA DIRT BIKE MARKET, FOR COMMERCIAL, BY PRICE RANGE, 2021-2031 ($MILLION)
    TABLE 106. LAMEA DIRT BIKE MARKET, FOR PERSONAL, BY PRICE RANGE, 2021-2031 ($MILLION)
    TABLE 107. LAMEA DIRT BIKE MARKET, FOR INDUSTRIAL, BY PRICE RANGE, 2021-2031 ($MILLION)
    TABLE 108. LAMEA DIRT BIKE MARKET, FOR OTHERS, BY PRICE RANGE, 2021-2031 ($MILLION)
    TABLE 109. LAMEA DIRT BIKE MARKET, PRICE RANGE, 2021-2031 ($MILLION)
    TABLE 110. LATIN AMERICA DIRT BIKE MARKET, BY TYPE, 2021-2031 ($MILLION)
    TABLE 111. LATIN AMERICA DIRT BIKE MARKET, BY PROPULSION TYPE, 2021-2031 ($MILLION)
    TABLE 112. LATIN AMERICA DIRT BIKE MARKET, BY APPLICATION, 2021-2031 ($MILLION)
    TABLE 113. LATIN AMERICA DIRT BIKE MARKET, BY PRICE RANGE, 2021-2031 ($MILLION)
    TABLE 114. MIDDLE EAST DIRT BIKE MARKET, BY TYPE, 2021-2031 ($MILLION)
    TABLE 115. MIDDLE EAST DIRT BIKE MARKET, BY PROPULSION TYPE, 2021-2031 ($MILLION)
    TABLE 116. MIDDLE EAST DIRT BIKE MARKET, BY APPLICATION, 2021-2031 ($MILLION)
    TABLE 117. MIDDLE EAST DIRT BIKE MARKET, BY PRICE RANGE, 2021-2031 ($MILLION)
    TABLE 118. AFRICA DIRT BIKE MARKET, BY TYPE, 2021-2031 ($MILLION)
    TABLE 119. AFRICA DIRT BIKE MARKET, BY PROPULSION TYPE, 2021-2031 ($MILLION)
    TABLE 120. AFRICA DIRT BIKE MARKET, BY APPLICATION, 2021-2031 ($MILLION)
    TABLE 121. AFRICA DIRT BIKE MARKET, BY PRICE RANGE, 2021-2031 ($MILLION)
    TABLE 122. BENELLI: KEY EXECUTIVES
    TABLE 123. BENELLI: COMPANY SNAPSHOT
    TABLE 124. BENELLI: PRODUCT PORTFOLIO
    TABLE 125. BETAMOTOR S.P.A.: KEY EXECUTIVES
    TABLE 126. BETAMOTOR S.P.A.: COMPANY SNAPSHOT
    TABLE 127. BETAMOTOR S.P.A.: PRODUCT PORTFOLIO
    TABLE 128. BMW AG: KEY EXECUTIVES
    TABLE 129. BMW AG: COMPANY SNAPSHOT
    TABLE 130. BMW AG: OPERATING SEGMENTS
    TABLE 131. BMW AG: PRODUCT PORTFOLIO
    TABLE 132. BMW AG: R&D EXPENDITURE, 2019–2021 ($MILLION)
    TABLE 133. BMW AG: NET SALES, 2019–2021 ($MILLION)
    TABLE 134. BULTACO BIKES: KEY EXECUTIVES
    TABLE 135. BULTACO BIKES: COMPANY SNAPSHOT
    TABLE 136. BULTACO BIKES: PRODUCT PORTFOLIO
    TABLE 137. COBRA MOTO: COMPANY SNAPSHOT
    TABLE 138. COBRA MOTO: PRODUCT PORTFOLIO
    TABLE 139. HONDA MOTOR CO LTD: KEY EXECUTIVES
    TABLE 140. HONDA MOTOR CO LTD : COMPANY SNAPSHOT
    TABLE 141. HONDA MOTOR CO., LTD: OPERATING SEGMENTS
    TABLE 142. HONDA MOTOR CO LTD : PRODUCT PORTFOLIO
    TABLE 143. HONDA MOTOR CO., LTD: R&D EXPENDITURE, 2020–2022 ($MILLION)
    TABLE 144. HONDA MOTOR CO., LTD: NET SALES, 2020–2022 ($MILLION)
    TABLE 145. HUSQVARNA MOTORCYCLES: COMPANY SNAPSHOT
    TABLE 146. HUSQVARNA MOTORCYCLES: OPERATING SEGMENTS
    TABLE 147. HUSQVARNA MOTORCYCLES: PRODUCT PORTFOLIO
    TABLE 148. HUSQVARNA MOTORCYCLES: NET SALES, 2019–2021 ($MILLION)
    TABLE 149. KAWASAKI HEAVY INDUSTRIES, LTD.: KEY EXECUTIVES
    TABLE 150. KAWASAKI HEAVY INDUSTRIES, LTD.: COMPANY SNAPSHOT
    TABLE 151. KAWASAKI HEAVY INDUSTRIES, LTD.: OPERATING SEGMENTS
    TABLE 152. KAWASAKI HEAVY INDUSTRIES, LTD.: PRODUCT PORTFOLIO
    TABLE 153. KAWASAKI HEAVY INDUSTRIES, LTD.: R&D EXPENDITURE, 2020–2022 ($MILLION)
    TABLE 154. KAWASAKI HEAVY INDUSTRIES, LTD.: NET SALES, 2020–2022 ($MILLION)
    TABLE 155. KAWASAKI HEAVY INDUSTRIES, LTD.: KEY STRATEGIC MOVES AND DEVELOPMENTS
    TABLE 156. KTM AG: KEY EXECUTIVES
    TABLE 157. KTM AG: COMPANY SNAPSHOT
    TABLE 158. PIERER MOBILITY AG.: OPERATING SEGMENTS
    TABLE 159. KTM AG: PRODUCT PORTFOLIO
    TABLE 160. PIERER MOBILITY AG: R&D EXPENDITURE, 2019–2021 ($MILLION)
    TABLE 161. PIERER MOBILITY AG: R&D EXPENDITURE, 2019–2021 ($MILLION)
    TABLE 162. PIAGGIO & C. SPA (APRILLA): KEY EXECUTIVES
    TABLE 163. PIAGGIO & C.SPA (APRILLA): COMPANY SNAPSHOT
    TABLE 164. PIAGGIO & C.SPA (APRILLA): OPERATING SEGMENTS
    TABLE 165. PIAGGIO & C.SPA (APRILLA): PRODUCT PORTFOLIO
    TABLE 166. PIAGGIO & C. SPA (APRILLA): R&D EXPENDITURE, 2019–2021 ($MILLION)
    TABLE 167. PIAGGIO & C. SPA (APRILLA): R&D EXPENDITURE, 2019–2021 ($MILLION)
    TABLE 168. POLINI MOTORI: KEY EXECUTIVES
    TABLE 169. POLINI MOTORI: COMPANY SNAPSHOT
    TABLE 170. POLINI MOTORI: PRODUCT PORTFOLIO
    TABLE 171. SCORPA: COMPANY SNAPSHOT
    TABLE 172. SCORPA: PRODUCT PORTFOLIO
    TABLE 173. SHERCO: KEY EXECUTIVES
    TABLE 174. SHERCO: COMPANY SNAPSHOT
    TABLE 175. SHERCO: PRODUCT PORTFOLIO
    TABLE 176. SUZUKI MOTOR CORPORATION: KEY EXECUTIVES
    TABLE 177. SUZUKI MOTOR CORPORATION: COMPANY SNAPSHOT
    TABLE 178. SUZUKI MOTOR CORPORATION: PRODUCT PORTFOLIO
    TABLE 179. SUZUKI MOTOR CORPORATION: R&D EXPENDITURE, 2019–2021 ($MILLION)
    TABLE 180. SUZUKI MOTOR CORPORATION: NET SALES, 2019–2021 ($MILLION)
    TABLE 181. YAMAHA CORPORATION: KEY EXECUTIVES
    TABLE 182. YAMAHA CORPORATION: COMPANY SNAPSHOT
    TABLE 183. YAMAHA CORPORATION: OPERATING SEGMENTS
    TABLE 184. YAMAHA CORPORATION: PRODUCT PORTFOLIO
    TABLE 185. YAMAHA CORPORATION: R&D EXPENDITURE, 2020–2022 ($MILLION)
    TABLE 186. YAMAHA CORPORATION: NET SALES, 2020–2022 ($MILLION)
    TABLE 187. SSR MOTORSPORTS: KEY EXECUTIVES
    TABLE 188. SSR MOTORSPORTS: COMPANY SNAPSHOT
    TABLE 189. SSR MOTORSPORTS: PRODUCT PORTFOLIO
    TABLE 190. ZERO MOTORCYCLES, INC.: KEY EXECUTIVES
    TABLE 191. ZERO MOTORCYCLES, INC.: COMPANY SNAPSHOT
    TABLE 192. ZERO MOTORCYCLES, INC.: PRODUCT PORTFOLIO
    TABLE 193. ZERO MOTORCYCLES, INC.: KEY STRATEGIC MOVES AND DEVELOPMENT
  • LIST OF FIGURES

  • FIGURE 01. KEY MARKET SEGMENTS
    FIGURE 02. DIRT BIKE MARKET SNAPSHOT, BY SEGMENTATION, 2021-2031
    FIGURE 03. DIRT BIKE MARKET SNAPSHOT, BY REGION, 2021-2031
    FIGURE 04. TOP IMPACTING FACTORS
    FIGURE 05. TOP INVESTMENT POCKETS
    FIGURE 06. MODERATE-TO-HIGH BARGAINING POWER OF SUPPLIERS
    FIGURE 07. LOW-TO-HIGH THREAT OF NEW ENTRANTS
    FIGURE 08. MODERATE-TO-HIGH THREAT OF SUBSTITUTES
    FIGURE 09. MODERATE-TO-HIGH INTENSITY OF COMPETITIVE RIVALRY
    FIGURE 10. LOW-TO-HIGH BARGAINING POWER OF BUYERS
    FIGURE 11. KEY PLAYER POSITIONING (2021)
    FIGURE 12. DIRT BIKE MARKET SHARE, BY TYPE, 2021-2031 (%)
    FIGURE 13. COMPARATIVE SHARE ANALYSIS OF DIRT BIKE MARKET FOR MOTOCROSS MOTORCYCLE, BY COUNTRY, 2021 & 2031 ($MILLION)
    FIGURE 14. COMPARATIVE SHARE ANALYSIS OF DIRT BIKE MARKET FOR ENDURO MOTORCYCLE, BY COUNTRY, 2021 & 2031 ($MILLION)
    FIGURE 15. COMPARATIVE SHARE ANALYSIS OF DIRT BIKE MARKET FOR TRAIL MOTORCYCLE, BY COUNTRY, 2021 & 2031 ($MILLION)
    FIGURE 16. COMPARATIVE SHARE ANALYSIS OF DIRT BIKE MARKET FOR TRACK-RACING MOTORCYCLE, BY COUNTRY, 2021 & 2031 ($MILLION)
    FIGURE 17. DIRT BIKE MARKET SHARE, BY PROPULSION TYPE, 2021-2031 (%)
    FIGURE 18. COMPARATIVE SHARE ANALYSIS OF DIRT BIKE MARKET FOR INTERNAL COMBUSTION ENGINE (ICE), BY COUNTRY, 2021 & 2031 ($MILLION)
    FIGURE 19. COMPARATIVE SHARE ANALYSIS OF DIRT BIKE MARKET FOR ELECTRIC, BY COUNTRY, 2021 & 2031 ($MILLION)
    FIGURE 20. DIRT BIKE MARKET SHARE, BY APPLICATION, 2021-2031 (%)
    FIGURE 21. COMPARATIVE SHARE ANALYSIS OF DIRT BIKE MARKET FOR COMMERCIAL, BY COUNTRY, 2021 & 2031 ($MILLION)
    FIGURE 22. COMPARATIVE SHARE ANALYSIS OF DIRT BIKE MARKET FOR PERSONAL, BY COUNTRY, 2021 & 2031 ($MILLION)
    FIGURE 23. COMPARATIVE SHARE ANALYSIS OF DIRT BIKE MARKET FOR INDUSTRIAL, BY COUNTRY, 2021 & 2031 ($MILLION)
    FIGURE 24. COMPARATIVE SHARE ANALYSIS OF DIRT BIKE MARKET FOR OTHERS, BY COUNTRY, 2021 & 2031 ($MILLION)
    FIGURE 25. DIRT BIKE MARKET SHARE, BY PRICE RANGE, 2021-2031 (%)
    FIGURE 26. COMPARATIVE SHARE ANALYSIS OF DIRT BIKE MARKET FOR LOW TO MID, BY COUNTRY, 2021 & 2031 ($MILLION)
    FIGURE 27. COMPARATIVE SHARE ANALYSIS OF DIRT BIKE MARKET FOR HIGH, BY COUNTRY, 2021 & 2031 ($MILLION)
    FIGURE 28. DIRT BIKE MARKET, BY REGION, 2021-2031 (%)
    FIGURE 29. COMPARATIVE SHARE ANALYSIS OF DIRT BIKE MARKET, BY COUNTRY, 2021-2031 (%)
    FIGURE 30. U.S. DIRT BIKE MARKET, 2021-2031 ($MILLION)
    FIGURE 31. CANADA DIRT BIKE MARKET, 2021-2031 ($MILLION)
    FIGURE 32. MEXICO DIRT BIKE MARKET, 2021-2031 ($MILLION)
    FIGURE 33. COMPARATIVE SHARE ANALYSIS OF DIRT BIKE MARKET, BY COUNTRY, 2021-2031 (%)
    FIGURE 34. UK DIRT BIKE MARKET, 2021-2031 ($MILLION)
    FIGURE 35. GERMANY DIRT BIKE MARKET, 2021-2031 ($MILLION)
    FIGURE 36. FRANCE DIRT BIKE MARKET, 2021-2031 ($MILLION)
    FIGURE 37. ITALY DIRT BIKE MARKET, 2021-2031 ($MILLION)
    FIGURE 38. REST OF EUROPE DIRT BIKE MARKET, 2021-2031 ($MILLION)
    FIGURE 39. COMPARATIVE SHARE ANALYSIS OF DIRT BIKE MARKET, BY COUNTRY, 2021-2031 (%)
    FIGURE 40. CHINA DIRT BIKE MARKET, 2021-2031 ($MILLION)
    FIGURE 41. JAPAN DIRT BIKE MARKET, 2021-2031 ($MILLION)
    FIGURE 42. INDIA DIRT BIKE MARKET, 2021-2031 ($MILLION)
    FIGURE 43. SOUTH KOREA DIRT BIKE MARKET, 2021-2031 ($MILLION)
    FIGURE 44. REST OF ASIA-PACIFIC DIRT BIKE MARKET, 2021-2031 ($MILLION)
    FIGURE 45. COMPARATIVE SHARE ANALYSIS OF DIRT BIKE MARKET, BY COUNTRY, 2021-2031 (%)
    FIGURE 46. LATIN AMERICA DIRT BIKE MARKET, 2021-2031 ($MILLION)
    FIGURE 47. MIDDLE EAST DIRT BIKE MARKET, 2021-2031 ($MILLION)
    FIGURE 48. AFRICA DIRT BIKE MARKET, 2021-2031 ($MILLION)
    FIGURE 49. BMW AG: R&D EXPENDITURE, 2019–2021 ($MILLION)
    FIGURE 50. BMW AG: NET SALES, 2019–2021 ($MILLION)
    FIGURE 51. BMW AG: REVENUE SHARE BY SEGMENT, 2021 (%)
    FIGURE 52. BMW AG: REVENUE SHARE BY REGION, 2021 (%)
    FIGURE 53. HONDA MOTOR CO., LTD: R&D EXPENDITURE, 2020–2022 ($MILLION)
    FIGURE 54. HONDA MOTOR CO., LTD, 2020–2022 ($MILLION)
    FIGURE 55. HONDA MOTOR CO., LTD: REVENUE SHARE BY SEGMENT, 2022 (%)
    FIGURE 56. HONDA MOTOR CO., LTD: REVENUE SHARE BY REGION, 2022 (%)
    FIGURE 57. HUSQVARNA MOTORCYCLES 2019–2021 ($MILLION)
    FIGURE 58. HUSQVARNA MOTORCYCLES: REVENUE SHARE BY SEGMENT, 2021 (%)
    FIGURE 59. HUSQVARNA MOTORCYCLES: REVENUE SHARE BY REGION, 2021(%)
    FIGURE 60. KAWASAKI HEAVY INDUSTRIES, LTD.: R&D EXPENDITURE, 2020–2022 ($MILLION)
    FIGURE 61. KAWASAKI HEAVY INDUSTRIES, LTD.: NET SALES, 2020–2022 ($MILLION)
    FIGURE 62. KAWASAKI HEAVY INDUSTRIES, LTD.: REVENUE SHARE BY SEGMENT, 2022 (%)
    FIGURE 63. KAWASAKI HEAVY INDUSTRIES, LTD.: REVENUE SHARE BY REGION, 2020 (%)
    FIGURE 64. PIERER MOBILITY AG: R&D EXPENDITURE, 2019–2021 ($MILLION)
    FIGURE 65. PIERER MOBILITY AG: NET SALES, 2019–2021 ($MILLION)
    FIGURE 66. PIERER MOBILITY AG: REVENUE SHARE BY SEGMENT, 2021 (%)
    FIGURE 67. PIERER MOBILITY AG: REVENUE SHARE BY REGION, 2021 (%)
    FIGURE 68. PIAGGIO & C. SPA(APRILLA): R&D EXPENDITURE, 2019–2021 ($MILLION)
    FIGURE 69. PIAGGIO & C.SPA (APRILLA): NET SALES, 2019–2019 ($MILLION)
    FIGURE 70. PIAGGIO & C.SPA (APRILLA): REVENUE SHARE BY SEGMENT, 2021 (%)
    FIGURE 71. PIAGGIO & C.SPA (APRILLA): REVENUE SHARE BY REGION, 2021 (%)
    FIGURE 72. SUZUKI MOTOR CORPORATION: R&D EXPENDITURE, 2019–2021 ($MILLION)
    FIGURE 73. SUZUKI MOTOR CORPORATION: NET SALES, 2019–2021 ($MILLION)
    FIGURE 74. SUZUKI MOTOR CORPORATION: REVENUE SHARE BY SEGMENT, 2021 (%)
    FIGURE 75. SUZUKI MOTOR CORPORATION: REVENUE SHARE BY REGION, 2020 (%)
    FIGURE 76. YAMAHA CORPORATION: R&D EXPENDITURE, 2020–2022 ($MILLION)
    FIGURE 77. YAMAHA CORPORATION: NET SALES, 2020–2022 ($MILLION)
    FIGURE 78. YAMAHA CORPORATION: REVENUE SHARE BY SEGMENT, 2022 (%)
    FIGURE 79. YAMAHA CORPORATION: REVENUE SHARE BY REGION, 2022 (%)


This section provides the opinions of various top-level CXOs in the global dirt bike market. The rise in popularity of motocross events and rise in number of motocross enthusiasts along with growing media influence for the viewers has proliferated the events which, in turn, increases the demand for dirt bikes. Meanwhile, the dirt bike industry is witnessing significant growth in demand for advanced dirt bikes, intensifying competition among bike manufacturers. For instance, according to leading global professional services firm Aon's 26th salary increase survey in India, organizations across industries project a 9.9% salary increase in 2022, compared to 9.3% in 2021. As per the survey, salary increments in Brazil will be 5.0%, in Russia at 6.1%, and in China at 6.0%. Thus, the improving financial conditions across developing regions lead to higher demand for dirt bikes, which is presumed to benefit the global dirt bike market in the forecast period.

Furthermore, improving living standards encourage consumers to take part in adventure activities, supporting the growth of the market. Also, growth in off road motorcycling events and initiatives by private organizations to promote biking activities has accelerated the adoption of dirt bikes across the globe. For instance, in 2022, GASGAS, a Spanish dirt bike manufacturer is making plans for the participants of 2022 ISDE in Le Puy en Valley, France to offer rental and race service packages to riders of all abilities from all nations.

The market growth is supplemented by factors such as rise in popularity & evolution of motocross events, rise in disposable income, and adoption of electric dirt bikes supplement the growth of the dirt bike market. However, high purchase and maintenance cost of dirt bikes and uncomfortable seating structure are the factors expected to hamper the growth of the dirt bike market. In addition, rising focus by manufacturers in the automobile industry on superior performance & comfort and technology advancement in dirt bikes creates market opportunities for the key players operating in the dirt bike market.

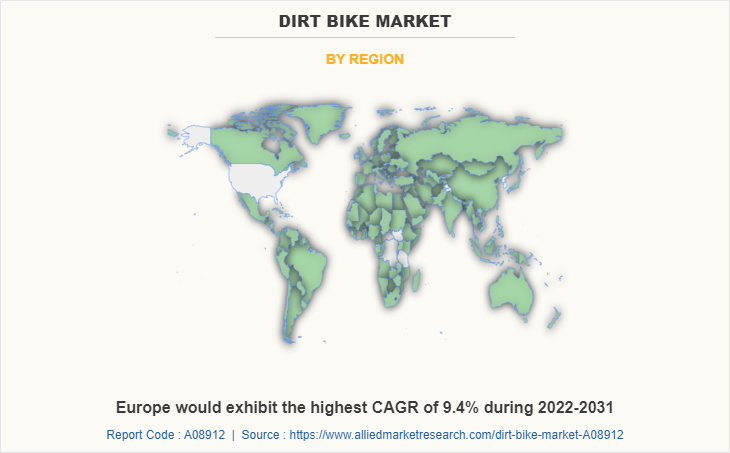
Among the analyzed regions, North America is the highest revenue contributor, followed by Asia-Pacific, Europe, and LAMEA. On the basis of forecast analysis, Europe is expected to lead during the forecast period, due to the growing popularity of motocross and off-road racing in countries such as France, Germany, and Italy and increasing demand for electric motorcycles, and rising tourism activities.

PURCHASE OPTIONS

Call or Email us

U.S.-Canada Toll-free: +1-800-792-5285
Int'l : +1-503-894-6022
Europe : +44-845-528-1300
Email : help@alliedmarketresearch.com
 
FREQUENTLY ASKED QUESTIONS?

A. The global dirt bike market was valued at $9.10 billion in 2021, and is projected to reach $18.01 billion by 2031, registering a CAGR of 7.0% from 2022 to 2031.

A. The leading players operating in the dirt bike market are Benelli, Betamotor S.p.A., BMW AG, Bultaco Bikes, Cobra Moto, Honda Motor Co., Ltd., Husqvarna motorcycles, Kawasaki Heavy Industries, Ltd., KTM AG, Piaggio & C. SpA (Aprilla), Polini motori, Scorpa, Sherco, SSR Motorsports, Suzuki Motor Corporation, Yamaha Corporation, and Zero Motorcycles, Inc.

A. North America is the largest regional market for dirt bike

A. Increased usage of dirt bikes in racing are the upcoming trends of dirt bike market in the world

A. Commercial usage is the leading application of dirt bike market

Looking for Customization?

 Customization Request

Have a Question?

 Speak with Analyst

Any Confusion?

 Inquire Before Buying

Have a glance of the Report

  Request Sample
RELATED TAGS

Purchase Full Report of
Dirt Bike Market

Start reading instantly.
This Report and over 66,905+ more Reports, Available with Avenue Library. T&C*.

  • Online Only
  • $3,570
  • Online cloud access only
  • Restricted print, copy, paste & download
  • Read only
  • Free industry update
    (Within 180 days)
  • Free report update in next update cycle
    (Sep 2023 - Sep 2024)
  • Data Pack
  • $3,840
  • Restricted to one authorized user
  • One print only
  • Available in
    Excel
  • Free industry update
    (Within 180 days)
  •   Free report update in next update cycle
    (Sep 2023 - Sep 2024)
  • Single User
  • $5,730
  • Restricted to one authorized user
  • One print only
  • Available in
    PDF
  • Free industry update
    (Within 180 days)
  •   Free report update in next update cycle
    (Sep 2023 - Sep 2024)
  • Five Users
  • $6,450
  • Limited to five authorized users
  • Print upto five copies
  • Available in
    PDF
  • Free industry update
    (Within 180 days)
  •   Free report update in next update cycle
    (Sep 2023 - Sep 2024)
  • Enterprise
    License/PDF

  • $9,600
  • Unlimited
    within
    company/enterprise
  • Available in Excel & PDF
  • Free industry update
    (Within 180 days)
  •   Free report update in next update cycle
    (Sep 2023 - Sep 2024)
  • Library
    Membership

  • $999 $ 1,175
    Per User/ Per month/ Billed annually
  • Published Content
    E-access
  • Company Profiles
    E-access
  • Newly Added Content Access
  • 10 PDF
    Downloads
  • 5 Excel Data
    Pack Downloads
  • 250 Company Profiles PDF Downloads
  • Buy Now

*Taxes/Fees, if applicable will be added during checkout. All prices in USD

RELATED REPORTS
 

Why Allied Market Research?


Infallible Methodology

To ensure high-level data integrity, accurate analysis, and impeccable forecasts

Analyst Support

For complete satisfaction

Customization

On-demand customization of scope of the report to exactly meet your needs

TARGETED MARKET VIEW

Targeted market view to provide pertinent information and save time of readers

Get fresh content delivered

Get insights on topics that are crucial for your business. Stay abreast of your interest areas.

Get Industry Data Alerts

Why Allied Market Research?

Infallible Methodology

To ensure high-level data integrity, accurate analysis, and impeccable forecasts

Analyst Support

For complete satisfaction

Customization

On-demand customization of scope of the report to exactly meet your needs

TARGETED MARKET VIEW

Targeted market view to provide pertinent information and save time of readers