0
2017
Disabled & Elderly Assistive Technologies Market

Disabled & Elderly Assistive Technologies Market

by Product [Mobility Assistance Aids {Wheelchairs, Mobility Scooters, Crutches & Canes, Patient Mechanical Lift Handling, and Walkers & Rollators}, Assistive Furniture {Medical Beds, Riser Reclining Chairs, Railings & Bar, and Door Openers}, Bathroom Safety & Assistive Products {Commode Chairs, Shower Chairs, and Ostomy Products}, and Communication Aids {Speech & Writing Therapy Devices, Hearing Aids (Canal Hearing Aids, Receiver-In-The-Ear (RITE) Aids, Cochlear Implants, Behind-The-Ear (BTE) Aids, Bone Anchored Hearing Aids (BAHA), and In-The-Ear (ITE) Aids), and Vision & Reading Aids (Reading Machines, Video Magnifiers, and Braille Translators)}, and End User {Hospitals, Elderly Nursing Home, and Homecare} - Global Opportunity Analysis and Industry Forecast, 2017-2023

Report Code: A02139
Jul 2017 | Pages: 210
Tables: 75
Charts: 55
  • Formats*:

  • pdf

    Single User License, Five User
    License & Enterprise User License

  • xls

    Data Pack Excel License

  • ppt

    It comes with the additional cost
    of $2500.00 contact sales.


COVID-19

Pandemic disrupted the entire world and affected many industries.

Get detailed COVID-19 impact analysis on the Disabled & Elderly Assistive Technologies Market

Request Now !

Disabled & Elderly Assistive Technologies Market Overview:

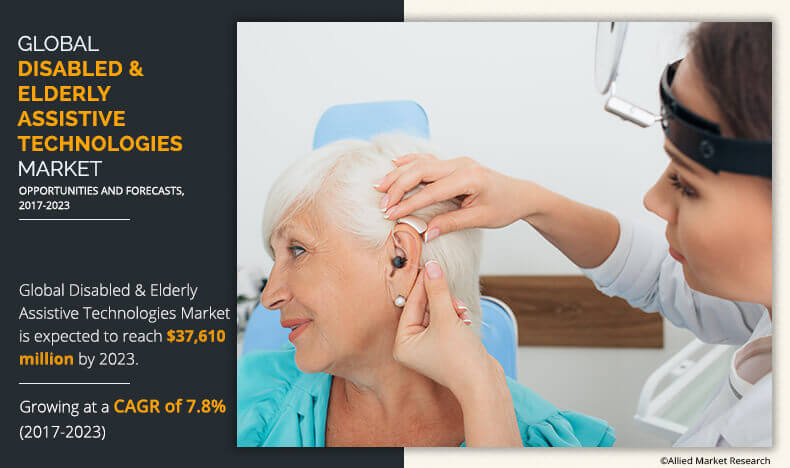
Global Disabled & Elderly Assistive Technologies Market was valued at $22,466 million in 2016, and is anticipated to reach at $37,610 million by 2023, registering a CAGR of 7.8% from 2017 to 2023. The disabled & elderly assistive technologies comprise several devices that aims to provide improved quality of life and enhanced accessibility to disabled & geriatric patients. Moreover, these technologies include devices that could be utilized by the population who are not self-dependant. This technology aids the aged population to listen, read, move, and conduct other day-to-day activities.

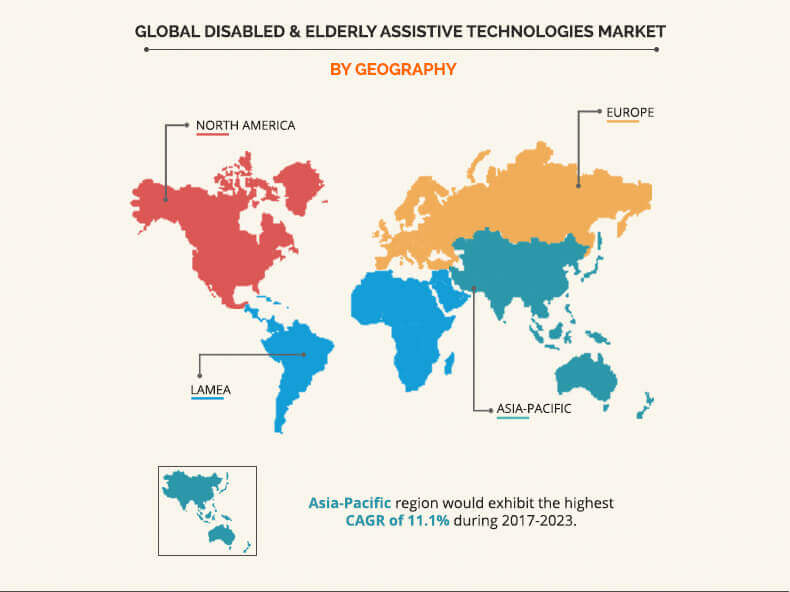
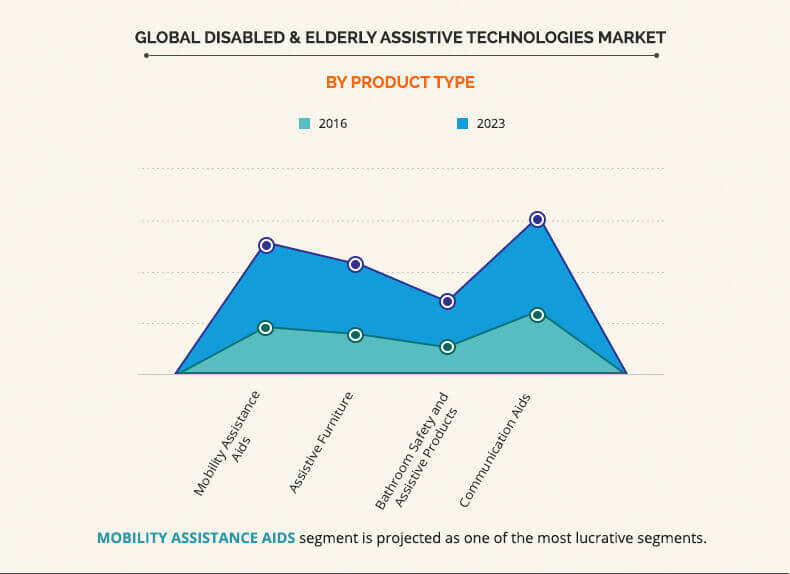
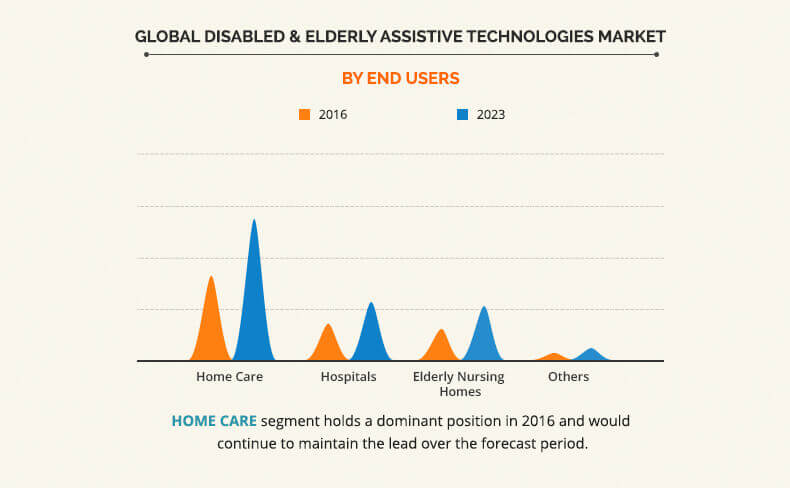
The global disabled & elderly assistive technologies market is seglmented based on product, end user, and region. On the basis of product type, it is classified into mobility assistance aids (wheelchairs, mobility scooters, crutches & canes, patient mechanical lift handling, walkers & rollators, and others), assistive furniture (medical beds, riser reclining chairs, railings & bar, door openers, and others), bathroom safety & assistive products (commode chairs, shower chairs, ostomy products, and others), and communication aids (speech & writing therapy devices, hearing aids {canal hearing aids, receiver-in-the-ear (RITE) aids, cochlear implants, behind-the-ear (BTE) aids, bone anchored hearing aids (BAHA), and in-the-ear (ITE) aids}, and vision & reading aids {reading machines, video magnifiers, braille translators, and others}). Based on end user, the market is categorized into hospitals, elderly nursing homes, homecare, and others. Region wise, it is analysed in North America, Europe, Asia-Pacific, and LAMEA.

Drivers, Restraints, and Opportunities

The global disabled & elderly assistive technologies market is driven by rise in geriatric & disabled population, lifestyle changes, availability of disabled & elderly assistive products, and increase in demand for assistive technologies due to the growth in trend of independent lifestyle. In addition, increase in number of assistive devices manufacturers investing in R&D activities of these technologies fuels the market growth. However, high cost of few sophisticated products, low level of acceptance for these products in the emerging economies, and low reimbursement from medical insurers restrain the market growth. Conversely, increase in proactiveness of people and rise in value to better health conditions are anticipated to provide lucrative growth opportunities for the market growth.

India Disabled & Elderly Assistive Technologies Market

The rise in adoption of modern & novel assistive technologies, increase in number of players in the country, and expansion of medical electronics sector drive the market growth in India. In addition, robust government initiatives toward improvement of healthcare facilities through insurance schemes is anticipated to provide lucrative growth opportunities in the country. Furthermore, the disabled & elderly assistive technologies market in India is expected to exhibit the highest CAGR of 12.6% from 2016 to 2023.

The key players operating in the market include Sunrise Medical LLC., GN ReSound Group, Sonova Holding AG, Starkey Hearing Technologies, William Demant Holding A/S, Wintriss Engineering Corporation, Drive Medical Design and Manufacturing, Ai Squared, Invacare Corporation, Siemens Ltd., and Widex Ltd.

The other key players in the value chain include Blue Chip Medical Products, Inc., Inclusive Technology Ltd., Liberator Ltd., and Permobil AB, Exact Dynamics B.V., Tobii Dynavox, Jabbla B.V.B.A., Bausch & Lomb, Inc., Medline Industries, Inc., Whirlpool Corporation, and others.

Key Benefits for Stakeholders

  • The study provides an in-depth analysis of the global disabled & elderly assistive technologies market along with current trends and future estimations to elucidate the imminent investment pockets.
  • A quantitative analysis from 2016 to 2023 is provided to enable the stakeholders to capitalize on the prevailing market opportunities.
  • Key market players are profiled and their strategies are analyzed thoroughly to understand the competitive outlook of the market.
  • Porters five forces model is expected to interpret the bargaining power of suppliers & buyers, threat of new entrants & substitutes, and competition among the key players.

Disabled & Elderly Assistive Technologies Market Key Segments:

Product

  • Mobility Assistance Aids
    • Wheelchairs
    • Mobility Scooters
    • Crutches & Canes
    • Patient Mechanical Lift Handling
    • Walkers & Rollators
    • Others
  • Assistive Furniture
    • Medical Beds
    • Riser Reclining Chairs
    • Railings & Bar
    • Door Openers
    • Others
  • Bathroom Safety & Assistive Products
    • Commodes Chairs
    • Shower Chairs
    • Ostomy Products
    • Others
  • Communication Aids
    • Speech & Writing Therapy Devices
    • Hearing Aids
      • Canal Hearing Aids
      • Receiver-in-the-Ear (RITE) Aids
      • Cochlear Implants
      • Behind-the-Ear (BTE) Aids
      • Bone Anchored Hearing Aids (BAHA)
      • In-the-Ear (ITE) Aids
    • Vision & Reading Aids
      • Reading Machines
      • Video Magnifiers
      • Braille Translators
      • Others

End User

  • Hospitals
  • Elderly Nursing Homes
  • Homecare
  • Others

Region

  • North America
    • U.S.
    • Canada
    • Mexico
  • Europe
    • Germany
    • France
    • UK
    • Italy
    • Spain
    • Rest of Europe
  • Asia-Pacific
    • Japan
    • China
    • India
    • Australia
    • Rest of Asia-Pacific
  • LAMEA
    • Brazil
    • Turkey
    • Saudi Arabia
    • South Africa
    • Rest of LAMEA

Disabled & Elderly Assistive Technologies Market Report Highlights

Aspects Details
By Product
  • Mobility Assistance Aids
    • Wheelchairs
    • Mobility Scooters
    • Crutches & Canes
    • Mobility Scooters
    • Patient Mechanical Lift Handling
    • Walkers & Rollators
    • Others
  • Assistive Furniture
    • Medical Beds
    • Riser Reclining Chairs
    • Railings & Bar
    • Door Openers
    • Others
  • Bathroom Safety & Assistive Products
    • Commodes Chairs
    • Shower Chairs
    • Ostomy Products
    • Others
  • Communication Aids
    • Speech & Writing Therapy Devices
    • Hearing Aids
      • Canal Hearing Aids
      • Receiver-in-the-Ear (RITE) Aids
      • Cochlear Implants
      • Behind-the-Ear (BTE) Aids
      • Bone Anchored Hearing Aids (BAHA)
      • In-the-Ear (ITE) Aids
    • Vision & Reading Aids
      • Reading Machines
      • Video Magnifiers
      • Braille Translators
      • Others
By End User
  • Hospitals
  • Elderly Nursing Homes
  • Homecare
  • Others End User
By Geography
  • North America
    • U.S.
    • Canada
    • Mexico
  • Europe
    • France
    • Germany
    • Italy
    • Spain
    • UK
    • Russia
    • Rest of Europe
  • Asia-Pacific
    • China
    • Japan
    • India
    • South Korea
    • Australia
    • Thailand
    • Malaysia
    • Indonesia
    • Rest of Asia-Pacific
  • LAMEA
    • Brazil
    • South Africa
    • Saudi Arabia
    • UAE
    • Argentina
    • Rest of LAMEA
Key Market Players INVACARE CORPORATION, STARKEY HEARING TECHNOLOGIES, AI SQUARED, WINTRISS ENGINEERING CORPORATION, WILLIAM DEMANT HOLDING A/S, SONOVA HOLDING AG, SUNRISE MEDICAL LLC, GN RESOUND GROUP, SIEMENS LTD., DRIVE MEDICAL
 

CHAPTER 1 INTRODUCTION

1.1. REPORT DESCRIPTION
1.2. KEY BENEFITS
1.3. KEY MARKET SEGMENTS
1.4. RESEARCH METHODOLOGY

1.4.1. Secondary research
1.4.2. Primary research
1.4.3. Analyst tools & models

CHAPTER 2 EXECUTIVE SUMMARY

2.1. CXO PERSPECTIVE

CHAPTER 3 MARKET OVERVIEW

3.1. MARKET DEFINITION AND SCOPE
3.2. KEY FINDINGS

3.2.1. Top investment pockets
3.2.2. Top winning strategies

3.3. PORTER’S FIVE FORCES ANALYSIS
3.4. REGULATORY FRAMEWORK

3.4.1. FDA
3.4.2. Health Canada
3.4.3. CE Mark

3.5. TOP PLAYER POSITIONING, 2016
3.6. MARKET DYNAMICS

3.6.1. Drivers

3.6.1.1. Growing geriatric and disabled population
3.6.1.2. High disposable income of baby boomers
3.6.1.3. Rise in demand for assistive technologies
3.6.1.4. Increase in number of interdisciplinary players moving into the healthcare sector

3.6.2. Restraints

3.6.2.1. High cost of assistive devices and their low availability
3.6.2.2. Low reimbursement from medical insurers

3.6.3. Opportunities

3.6.3.1. Emerging untapped economies in the assistive technologies market

CHAPTER 4 DISABLED AND ELDERLY ASSISTIVE TECHNOLOGIES MARKET, BY PRODUCT

4.1. OVERVIEW

4.1.1. Market size and forecast

4.2. MOBILITY ASSISTIVE AIDS

4.2.1. Key market trends
4.2.2. Growth factors and opportunities
4.2.3. Market size and forecast
4.2.4. Wheelchairs

4.2.4.1. Market size and forecast

4.2.5. Mobility Scooters

4.2.5.1. Market size and forecast

4.2.6. Crutches and Canes

4.2.6.1. Market size and forecast

4.2.7. Patient Mechanical Lift Handling

4.2.7.1. Market size and forecast

4.2.8. Walkers and Rollators

4.2.8.1. Market size and forecast

4.2.9. Other Mobility Assistive Devices

4.2.9.1. Market size and forecast

4.3. ASSISTIVE FURNITURE

4.3.1. Key market trends
4.3.2. Growth factors and opportunities
4.3.3. Market size and forecast
4.3.4. Medical Beds

4.3.4.1. Market size and forecast

4.3.5. Riser Reclining Chairs

4.3.5.1. Market size and forecast

4.3.6. Railings and Bars

4.3.6.1. Market size and forecast

4.3.7. Door Openers

4.3.7.1. Market size and forecast

4.3.8. Other Assistive Furniture Devices

4.3.8.1. Market size and forecast

4.4. BATHROOM SAFETY AND ASSISTIVE PRODUCTS

4.4.1. Key market trends
4.4.2. Growth factors and opportunities
4.4.3. Market size and forecast
4.4.4. Commode Chairs

4.4.4.1. Market size and forecast

4.4.5. Shower Chairs

4.4.5.1. Market size and forecast

4.4.6. Ostomy Products

4.4.6.1. Market size and forecast

4.4.7. Other Bathroom Safety and Assistive Devices

4.4.7.1. Market size and forecast

4.5. COMMUNICATION AIDS

4.5.1. Key market trends
4.5.2. Growth factors and opportunities
4.5.3. Market size and forecast
4.5.4. Speech & Writing Therapy Devices

4.5.4.1. Market size and forecast

4.5.5. Hearing Aids

4.5.5.1. Market size and forecast
4.5.5.2. Canal Hearing Aids

4.5.5.2.1. Market size and forecast

4.5.5.3. Receiver-in-the-Ear (RITE) Aids

4.5.5.3.1. Market size and forecast

4.5.5.4. Cochlear Implants

4.5.5.4.1. Market size and forecast

4.5.5.5. Behind-the-Ear (BTE) Aids

4.5.5.5.1. Market size and forecast

4.5.5.6. Bone Anchored Hearing Aids (BAHA)

4.5.5.6.1. Market size and forecast

4.5.5.7. In-the–Ear (ITE) Aids

4.5.5.7.1. Market size and forecast

4.5.6. Vision & Reading Aids

4.5.6.1. Market size and forecast
4.5.6.2. Reading Machines

4.5.6.2.1. Market size and forecast

4.5.6.3. Video Magnifiers

4.5.6.3.1. Market size and forecast

4.5.6.4. Braille Translators

4.5.6.4.1. Market size and forecast

4.5.6.5. Others Vision and Reading Aids

4.5.6.5.1. Market size and forecast

CHAPTER 5 DISABLED AND ELDERLY ASSISTIVE TECHNOLOGIES MARKET, BY END-USER

5.1. OVERVIEW

5.1.1. Market size and forecast

5.2. HOSPITALS

5.2.1. Market size and forecast

5.3. ELDERLY NURSING HOMES

5.3.1. Market size and forecast

5.4. HOME CARE

5.4.1. Market size and forecast

5.5. OTHER END-USERS

5.5.1. Market size and forecast

CHAPTER 6 DISABLED AND ELDERLY ASSISTIVE TECHNOLOGIES MARKET, BY GEOGRAPHY

6.1. OVERVIEW

6.1.1. Market size and forecast

6.2. NORTH AMERICA

6.2.1. Key market trends
6.2.2. Key growth factors and opportunities
6.2.3. Market size and forecast

6.2.3.1. U.S. market size and forecast
6.2.3.2. Mexico market size and forecast
6.2.3.3. Canada market size and forecast

6.3. EUROPE

6.3.1. Key market trends
6.3.2. Key growth factors and opportunities
6.3.3. Market size and forecast

6.3.3.1. UK market size and forecast
6.3.3.2. France market size and forecast
6.3.3.3. Germany market size and forecast
6.3.3.4. Italy market size and forecast
6.3.3.5. Spain market size and forecast
6.3.3.6. Rest of Europe market size and forecast

6.4. ASIA-PACIFIC

6.4.1. Key market trends
6.4.2. Key growth factors and opportunities
6.4.3. Market size and forecast

6.4.3.1. Japan market size and forecast
6.4.3.2. China market size and forecast
6.4.3.3. India market size and forecast
6.4.3.4. Australia market size and forecast
6.4.3.5. Rest of Asia-Pacific market size and forecast

6.5. LAMEA

6.5.1. Key market trends
6.5.2. Key growth factors and opportunities
6.5.3. Market size and forecast

6.5.3.1. Brazil market size and forecast
6.5.3.2. South Africa market size and forecast
6.5.3.3. Saudi Arabia market size and forecast
6.5.3.4. Rest of LAMEA market size and forecast

CHAPTER 7 COMPANY PROFILES

7.1. AI SQUARED

7.1.1. Company overview
7.1.2. Operating business segments

7.2. DRIVE MEDICAL

7.2.1. Company overview
7.2.2. Company snapshot
7.2.3. Operating business segments
7.2.4. Key strategic moves and developments

7.3. GN RESOUND GROUP

7.3.1. Company overview
7.3.2. Company snapshot
7.3.3. Operating business segments
7.3.4. Business performance
7.3.5. Key strategic moves and developments

7.4. INVACARE CORPORATION

7.4.1. Company overview
7.4.2. Company snapshot
7.4.3. Operating business segments
7.4.4. Business performance

7.5. SUNRISE MEDICAL LLC

7.5.1. Company overview
7.5.2. Company snapshot
7.5.3. Operating business segments
7.5.4. Key strategic moves and developments

7.6. SONOVA HOLDING AG

7.6.1. Company overview
7.6.2. Company snapshot
7.6.3. Operating business segments
7.6.4. Business performance
7.6.5. Key strategic moves and developments

7.7. STARKEY HEARING TECHNOLOGIES

7.7.1. Company overview
7.7.2. Company snapshot
7.7.3. Operating business segments
7.7.4. Business performance
7.7.5. Key strategic moves and developments

7.8. SIEMENS LTD.

7.8.1. Company overview
7.8.2. Company snapshot
7.8.3. Operating business segments
7.8.4. Business performance
7.8.5. Key strategic moves and developments

7.9. WILLIAM DEMANT HOLDING A/S

7.9.1. Company overview
7.9.2. Company snapshot
7.9.3. Operating business segments
7.9.4. Business performance

7.10. WINTRISS ENGINEERING CORPORATION

7.10.1. Company overview
7.10.2. Company snapshot

LIST OF TABLES

TABLE 1. FEW PRODUCTS UNDER DIFFERENT CLASSES OF HEALTH CANADA
TABLE 2. PRODUCTS DEVELOPED BY DIFFERENT KEY PLAYERS
TABLE 3. GLOBAL DISABLED AND ELDERLY ASSISTIVE TECHNOLOGIES MARKET,  BY PRODUCTS, 2016–2023 ($MILLION)
TABLE 4. GLOBAL MOBILITY ASSISTANCE DEVICES MARKET, BY TYPE, 2016–2023 ($MILLION)
TABLE 5. GLOBAL WHEELCHAIRS MARKET FOR MOBILITY ASSISTANCE, BY REGION, 2016–2023 ($MILLION)
TABLE 6. GLOBAL MOBILITY SCOOTERS MARKET FOR MOBILITY ASSISTANCE,  BY REGION, 2016–2023 ($MILLION)
TABLE 7. GLOBAL CRUTCHES AND CANES MARKET FOR MOBILITY ASSISTANCE,  BY REGION, 2016–2023 ($MILLION)
TABLE 8. GLOBAL PATIENT MECHANICAL LIFT HANDLING MARKET FOR MOBILITY ASSISTANCE, BY REGION, 2016–2023 ($MILLION)
TABLE 9. GLOBAL WALKERS AND ROLLATORS MARKET FOR MOBILITY ASSISTANCE,  BY REGION, 2016–2023 ($MILLION)
TABLE 10. GLOBAL OTHER MOBILITY ASSISTIVE DEVICES, BY REGION, 2016–2023 ($MILLION)
TABLE 11. GLOBAL ASSISTIVE FURNITURE MARKET, BY TYPE 2016–2023 ($MILLION)
TABLE 12. GLOBAL MEDICAL BEDS MARKET FOR ASSISTIVE FURNITURE, BY REGION, 2016–2023 ($MILLION)
TABLE 13. GLOBAL RISER RECLINING CHAIRS FOR ASSISTIVE FURNITURE, BY REGION, 2016–2023 ($MILLION)
TABLE 14. GLOBAL RAILINGS AND BARS MARKET FOR ASSISTIVE FURNITURE, BY REGION, 2016–2023 ($MILLION)
TABLE 15. GLOBAL DOOR OPENERS MARKET FOR ASSISTIVE FURNITURE, BY REGION, 2016–2023 ($MILLION)
TABLE 16. GLOBAL OTHER ASSISTIVE FURNITURE DEVICES MARKET, BY REGION, 2016–2023 ($MILLION)
TABLE 17. GLOBAL BATHROOM SAFETY AND ASSISTIVE PRODUCTS MARKET, BY TYPE, 2016–2023 ($MILLION)
TABLE 18. GLOBAL COMMODE CHAIRS MARKET FOR BATHROOM SAFETY AND ASSISTIVE PRODUCTS, BY REGION, 2016–2023 ($MILLION)
TABLE 19. GLOBAL SHOWER CHAIRS MARKET FOR BATHROOM SAFETY AND ASSISTIVE PRODUCTS, BY REGION, 2016–2023 ($MILLION)
TABLE 20. GLOBAL OSTOMY PRODUCTS MARKET FOR BATHROOM SAFETY AND ASSISTIVE PRODUCTS, BY REGION, 2016–2023 ($MILLION)
TABLE 21. GLOBAL OTHERS MARKET FOR BATHROOM SAFETY AND ASSISTIVE PRODUCTS, BY REGION, 2016–2023 ($MILLION)
TABLE 22. GLOBAL COMMUNICATION AIDS MARKET, BY TYPE, 2016–2023 ($MILLION)
TABLE 23. GLOBAL SPEECH & WRITING THERAPY DEVICES MARKET FOR COMMUNICATION AIDS, BY REGION, 2016–2023 ($MILLION)
TABLE 24. GLOBAL HEARING AIDS MARKET FOR COMMUNICATION AIDS, BY TYPE,  2016–2023 ($MILLION)
TABLE 25. GLOBAL VISION & READING AIDS MARKET FOR COMMUNICATION AIDS,  BY TYPE, 2016–2023 ($MILLION)
TABLE 26. GLOBAL DISABLED AND ELDERLY ASSISTIVE TECHNOLOGIES MARKET,  BY END-USER, 2016–2023 ($MILLION)
TABLE 27. GLOBAL DISABLED AND ELDERLY ASSISTIVE TECHNOLOGIES MARKET FOR HOSPITALS, BY REGION, 2016–2023 ($MILLION)
TABLE 28. GLOBAL DISABLED AND ELDERLY ASSISTIVE TECHNOLOGIES MARKET FOR ELDERLY NURSING HOMES, BY REGION, 2016–2023 ($MILLION)
TABLE 29. GLOBAL DISABLED AND ELDERLY ASSISTIVE TECHNOLOGIES MARKET FOR HOME CARE, BY REGION, 2016–2023 ($MILLION)
TABLE 30. GLOBAL DISABLED AND ELDERLY ASSISTIVE TECHNOLOGIES MARKET FOR OTHER END-USERS, BY REGION, 2016–2023 ($MILLION)
TABLE 31. DISABLED AND ELDERLY ASSISTIVE TECHNOLOGIES MARKET, BY REGION, 2016–2023 ($MILLION)
TABLE 32. NORTH AMERICA DISABLED AND ELDERLY ASSISTIVE TECHNOLOGIES MARKET, BY COUNTRY, 2016–2023 ($MILLION)
TABLE 33. NORTH AMERICA DISABLED AND ELDERLY ASSISTIVE TECHNOLOGIES MARKET, BY PRODUCT, 2016–2023 ($MILLION)
TABLE 34. NORTH AMERICA DISABLED AND ELDERLY ASSISTIVE TECHNOLOGIES MARKET, BY END-USER, 2016–2023 ($MILLION)
TABLE 35. EUROPE DISABLED AND ELDERLY ASSISTIVE TECHNOLOGIES MARKET,  BY COUNTRY, 2016–2023 ($MILLION)
TABLE 36. EUROPE DISABLED AND ELDERLY ASSISTIVE TECHNOLOGIES MARKET,  BY PRODUCT, 2016–2023 ($MILLION)
TABLE 37. EUROPE DISABLED AND ELDERLY ASSISTIVE TECHNOLOGIES MARKET,  BY END-USER, 2016–2023 ($MILLION)
TABLE 38. ASIA-PACIFIC DISABLED AND ELDERLY ASSISTIVE TECHNOLOGIES MARKET,  BY COUNTRY, 2016–2023 ($MILLION)
TABLE 39. ASIA-PACIFIC DISABLED AND ELDERLY ASSISTIVE TECHNOLOGIES MARKET,  BY PRODUCT, 2016–2023 ($MILLION)
TABLE 40. ASIA-PACIFIC DISABLED AND ELDERLY ASSISTIVE TECHNOLOGIES MARKET,  BY END-USER, 2016–2023 ($MILLION)
TABLE 41. LAMEA DISABLED AND ELDERLY ASSISTIVE TECHNOLOGIES MARKET,  BY COUNTRY, 2016–2023 ($MILLION)
TABLE 42. LAMEA DISABLED AND ELDERLY ASSISTIVE TECHNOLOGIES MARKET,  BY PRODUCT, 2016–2023 ($MILLION)
TABLE 43. LAMEA DISABLED AND ELDERLY ASSISTIVE TECHNOLOGIES MARKET,  BY END-USER, 2016–2023 ($MILLION)
TABLE 44. AI: COMPANY SNAPSHOT
TABLE 45. AI: OPERATING SEGMENTS
TABLE 46. DRIVE MEDICAL: COMPANY SNAPSHOT
TABLE 47. DRIVE MEDICAL: OPERATING SEGMENTS
TABLE 48. GN RESOUND: COMPANY SNAPSHOT
TABLE 49. GN RESOUND: OPERATING SEGMENTS
TABLE 50. INVACARE: COMPANY SNAPSHOT
TABLE 51. INVACARE: OPERATING SEGMENTS
TABLE 52. SUNRISE: COMPANY SNAPSHOT
TABLE 53. SUNRISE: OPERATING SEGMENTS
TABLE 54. SONOVA: COMPANY SNAPSHOT
TABLE 55. SONOVA: OPERATING SEGMENTS
TABLE 56. STARKEY HEARING TECHNOLOGIES: COMPANY SNAPSHOT
TABLE 57. STARKEY: OPERATING SEGMENTS
TABLE 58. SIEMENS: COMPANY SNAPSHOT
TABLE 59. SIEMENS: OPERATING SEGMENTS
TABLE 60. WILLIAM DEMANT: COMPANY SNAPSHOT
TABLE 61. WILLIAM: OPERATING SEGMENTS
TABLE 62. WINTRISS: COMPANY SNAPSHOT

LIST OF FIGURES

FIGURE 1. GLOBAL DISABLED AND ELDERLY ASSISTIVE TECHNOLOGIES MARKET,  2016–2023
FIGURE 2. SEGMENTATION OF DISABLED AND ELDERLY ASSISTIVE TECHNOLOGIES MARKET
FIGURE 3. TOP INVESTMENT POCKETS IN GLOBAL DISABLED AND ELDERLY ASSISTIVE TECHNOLOGIES MARKET, 2016
FIGURE 1. TOP WINNING STRATEGIES: PERCENTAGE DISTRIBUTION (2014–2016)
FIGURE 2. TOTAL NUMBER OF STRATEGIES: DISABLED AND ELDERLY ASSISTIVE TECHNOLOGIES MARKET
FIGURE 3. TOP WINNING STRATEGIES: NATURE AND COMPANY
FIGURE 4. BARGAINING POWER OF BUYERS
FIGURE 5. BARGAINING POWER OF SUPPLIERS
FIGURE 6. THREAT OF NEW ENTRANTS
FIGURE 7. THREAT OF SUBSTITUTES
FIGURE 8. INTENSITY OF COMPETITIVE RIVALRY
FIGURE 9. TOP PLAYER POSITIONING, 2016
FIGURE 10. DRIVERS AND RESTRAINTS: GLOBAL DISABLED AND ELDERLY ASSISTIVE TECHNOLOGIES MARKET
FIGURE 11. GLOBAL DISABLED AND ELDERLY ASSISTIVE TECHNOLOGIES MARKET  BY PRODUCT SEGMENTATION
FIGURE 12. GLOBAL CANAL HEARING AIDS MARKET FOR COMMUNICATION AIDS,  BY REGION, 2016–2023 ($MILLION)
FIGURE 13. GLOBAL RECEIVER-IN-THE-EAR (RITE) AIDS MARKET FOR COMMUNICATION AIDS, BY REGION, 2016–2023 ($MILLION)
FIGURE 14. GLOBAL COCHLEAR IMPLANTS MARKET FOR COMMUNICATION AIDS, BY REGION, 2016–2023 ($MILLION)
FIGURE 15. GLOBAL BEHIND-THE-EAR (BTE) AIDS MARKET FOR COMMUNICATION AIDS, BY REGION, 2016–2023 ($MILLION)
FIGURE 16. GLOBAL BONE ANCHORED HEARING AIDS (BAHA) MARKET FOR COMMUNICATION AIDS, BY REGION, 2016–2023 ($MILLION)
FIGURE 17. GLOBAL IN-THE–EAR (ITE) AIDS MARKET FOR COMMUNICATION AIDS,  BY REGION, 2016–2023 ($MILLION)
FIGURE 18. GLOBAL READING MACHINES MARKET FOR COMMUNICATION AIDS,  BY REGION, 2016–2023 ($MILLION)
FIGURE 19. GLOBAL VIDEO MAGNIFIERS MARKET FOR COMMUNICATION AIDS, BY REGION, 2016–2023 ($MILLION)
FIGURE 20. GLOBAL BRAILLE TRANSLATORS MARKET FOR COMMUNICATION AIDS,  BY REGION, 2016–2023 ($MILLION)
FIGURE 21. GLOBAL OTHER VISION AND READING AIDS MARKET, BY REGION, 2016–2023 ($MILLION)
FIGURE 22. GLOBAL DISABLED AND ELDERLY ASSISTIVE TECHNOLOGIES MARKET,  BY END-USER: SEGMENTATION
FIGURE 23. U.S. DISABLED AND ELDERLY ASSISTIVE TECHNOLOGIES, 2016-2023 ($MILLION)
FIGURE 24. MEXICO DISABLED AND ELDERLY ASSISTIVE TECHNOLOGIES MARKET,  2016-2023 ($MILLION)
FIGURE 25. CANADA DISABLED AND ELDERLY ASSISTIVE TECHNOLOGIES MARKET,  2016-2023 ($MILLION)
FIGURE 26. UK DISABLED AND ELDERLY ASSISTIVE TECHNOLOGIES MARKET, 2016-2023 ($MILLION)
FIGURE 27. FRANCE DISABLED AND ELDERLY ASSISTIVE TECHNOLOGIES MARKET,  2016-2023 ($MILLION)
FIGURE 28. GERMANY DISABLED AND ELDERLY ASSISTIVE TECHNOLOGIES MARKET,  2016-2023 ($MILLION)
FIGURE 29. ITALY DISABLED AND ELDERLY ASSISTIVE TECHNOLOGIES MARKET,  2016-2023 ($MILLION)
FIGURE 30. SPAIN DISABLED AND ELDERLY ASSISTIVE TECHNOLOGIES MARKET,  2016-2023 ($MILLION)
FIGURE 31. REST OF EUROPE DISABLED AND ELDERLY ASSISTIVE TECHNOLOGIES MARKET, 2016-2023 ($MILLION)
FIGURE 32. JAPAN DISABLED AND ELDERLY ASSISTIVE TECHNOLOGIES MARKET,  2016-2023 ($MILLION)
FIGURE 33. CHINA DISABLED AND ELDERLY ASSISTIVE TECHNOLOGIES MARKET,  2016-2023 ($MILLION)
FIGURE 34. INDIA DISABLED AND ELDERLY ASSISTIVE TECHNOLOGIES MARKET,  2016-2023 ($MILLION)
FIGURE 35. AUSTRALIA DISABLED AND ELDERLY ASSISTIVE TECHNOLOGIES MARKET, 2016-2023 ($MILLION)
FIGURE 36. REST OF ASIA-PACIFIC DISABLED AND ELDERLY ASSISTIVE TECHNOLOGIES MARKET, 2016-2023 ($MILLION)
FIGURE 37. BRAZIL DISABLED AND ELDERLY ASSISTIVE TECHNOLOGIES MARKET,  2016-2023 ($MILLION)
FIGURE 38. SOUTH AFRICA DISABLED AND ELDERLY ASSISTIVE TECHNOLOGIES MARKET, 2016-2023 ($MILLION)
FIGURE 39. SAUDI ARABIA DISABLED AND ELDERLY ASSISTIVE TECHNOLOGIES MARKET, 2016-2023 ($MILLION)
FIGURE 40. REST OF LAMEA DISABLED AND ELDERLY ASSISTIVE TECHNOLOGIES MARKET, 2016-2023 ($MILLION)
FIGURE 41. GN RESOUND: NET SALES, 2014–2016 ($MILLION)
FIGURE 42. GN RESOUND: REVENUE SHARE BY SEGMENT, 2016 (%)
FIGURE 43. GN RESOUND: REVENUE SHARE BY GEOGRAPHY, 2016 (%)
FIGURE 44. INVACARE: NET SALES, 2014–2016 ($MILLION)
FIGURE 45. INVACARE: REVENUE SHARE BY SEGMENT, 2016 (%)
FIGURE 46. INVACARE: REVENUE SHARE BY GEOGRAPHY, 2016 (%)
FIGURE 47. SONOVA: NET SALES, 2014–2016 ($MILLION)
FIGURE 48. SONOVA: REVENUE SHARE BY PRODUCT, 2016 (%)
FIGURE 49. SONOVA: REVENUE BY GEOGRAPHY, 2016 (%)
FIGURE 50. STARKEY: NET SALES, 2014–2015 ($MILLION)
FIGURE 51. SIEMENS: NET SALES, 2014–2016 ($MILLION)
FIGURE 52. SIEMENS: REVENUE SHARE BY GEOGRAPHY, 2016 (%)
FIGURE 53. WILLIAM DEMANT: NET SALES, 2014–2016 ($MILLION)
FIGURE 54. WILLIAM DEMANT: REVENUE SHARE BY SEGMENT, 2016 (%)
FIGURE 55. WILLIAM DEMANT: REVENUE SHARE BY GEOGRAPHY, 2016 (%)


The disabled & elderly assistive technologies market aims to facilitate healthy independent living, improve quality of life, and limit healthcare costs by providing innovative & cost-effective solutions. This leads to increase in demand of these assistive technologies in the market. The development of novel assistive technologies such as motility scooters and patient mechanical lifts further fuel the demand.

The healthcare market is changing and many external players are seeking opportunity to enter the assistive technologies industry. Moreover, key players contribute significantly to the market growth by leveraging product diversification and combining innovations that are cost-effective with improved long-term health outcomes.

Over the years, the market has witnessed tremendous development in the assistive technologies. Emerging innovative & cost-effective assistive technologies drive the disabled & elderly assistive technologies market. These assistive technologies have evolved in terms of both performance and characteristics. Furthermore, interdisciplinary approaches, combining biotechnology, nanotechnology, information & communications technologies, and cognitive sciences, have revolutionized the medical devices sector. This leads to easy availability of several effective assistive technologies with greater accuracy, advanced control, and low power consumption.

PURCHASE OPTIONS

Call or Email us

U.S.-Canada Toll-free: +1-800-792-5285
Int'l : +1-503-894-6022
Europe : +44-845-528-1300
Email : help@alliedmarketresearch.com

Looking for Customization?

 Customization Request

Have a Question?

 Speak with Analyst

Any Confusion?

 Inquire Before Buying

Have a glance of the Report

  Request Sample

Purchase Full Report of
Disabled & Elderly Assistive Technologies Market

Start reading instantly.
This Report and over 68,131+ more Reports, Available with Avenue Library. T&C*.

  • Online Only
  • $3,565
  • Online cloud access only
  • Restricted print, copy, paste & download
  • Read only
  • Free industry update
    (Within 180 days)
  • Free report update in next update cycle
    (Jul 2018 - Jul 2019)
  • Data Pack
  • $3,961
  • Restricted to one authorized user
  • One print only
  • Available in
    Excel
  • Free industry update
    (Within 180 days)
  •   Free report update in next update cycle
    (Jul 2018 - Jul 2019)
  • Single User
  • $5,540
  • Restricted to one authorized user
  • One print only
  • Available in
    PDF
  • Free industry update
    (Within 180 days)
  •   Free report update in next update cycle
    (Jul 2018 - Jul 2019)
  • Five Users
  • $6,654
  • Limited to five authorized users
  • Print upto five copies
  • Available in
    PDF
  • Free industry update
    (Within 180 days)
  •   Free report update in next update cycle
    (Jul 2018 - Jul 2019)
  • Enterprise
    License/PDF

  • $10,280
  • Unlimited
    within
    company/enterprise
  • Available in Excel & PDF
  • Free industry update
    (Within 180 days)
  •   Free report update in next update cycle
    (Jul 2018 - Jul 2019)
  • Library
    Membership

  • $999 $ 1,175
    Per User/ Per month/ Billed annually
  • Published Content
    E-access
  • Company Profiles
    E-access
  • Newly Added Content Access
  • 10 PDF
    Downloads
  • 5 Excel Data
    Pack Downloads
  • 250 Company Profiles PDF Downloads
  • Buy Now

*Taxes/Fees, if applicable will be added during checkout. All prices in USD

RELATED REPORTS
 

Why Allied Market Research?


Infallible Methodology

To ensure high-level data integrity, accurate analysis, and impeccable forecasts

Analyst Support

For complete satisfaction

Customization

On-demand customization of scope of the report to exactly meet your needs

TARGETED MARKET VIEW

Targeted market view to provide pertinent information and save time of readers

Get fresh content delivered

Get insights on topics that are crucial for your business. Stay abreast of your interest areas.

Get Industry Data Alerts

Why Allied Market Research?

Infallible Methodology

To ensure high-level data integrity, accurate analysis, and impeccable forecasts

Analyst Support

For complete satisfaction

Customization

On-demand customization of scope of the report to exactly meet your needs

TARGETED MARKET VIEW

Targeted market view to provide pertinent information and save time of readers