Report Code: A15680 | Sep 2022 | Pages: 250 | ||
Tables: 99 | Charts: 69 |
|
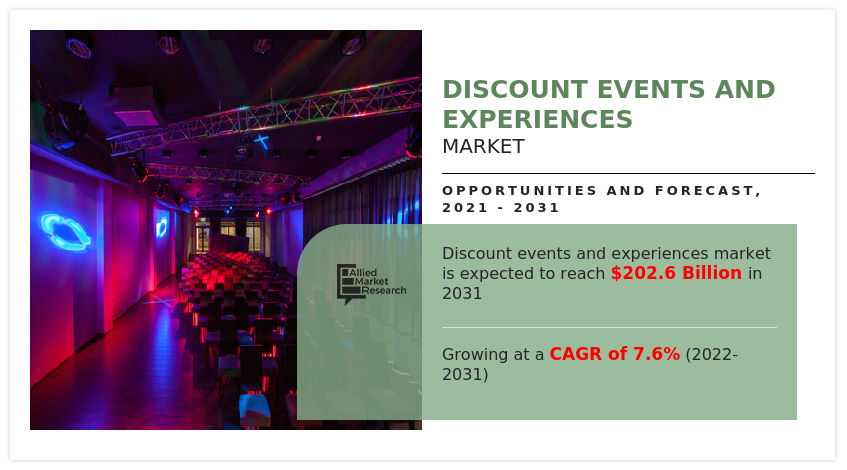
The global discount events and experiences market size was valued at $77.4 billion in 2021, and is projected to reach $202.6 billion by 2031, growing at a CAGR of 7.6% from 2022 to 2031.
The COVID-19 had negatively impacted the global discount events and experiences market owing to a decline in the employment and income levels of the population in the major economical regions like Europe, North America, and Asia-Pacific.
The discount events and experiences market is segmented into and Service Type.
Discount events and experiences refer to various events and experiences services that are offered to consumers at discounted prices through various organizers and discount sellers, such as Zouton, Bookmyshow, Eventbrite, Groupon, Clarion Events Ltd., and other similar players in the market.
The demand for the discount events and experiences is significantly driven by rise in disposable income, rise in consumer spending on leisure activities, and increasing indulgence of people in various adventure and recreational activities. The demand for the leisure, entertainment, adventure, and recreational activities is significantly higher in the developed regions like Europe and North America. The strong economic growth coupled with rise in employment levels, and improving standards of living are a major driver behind the surging the discount events and experiences market demand across the globe. In the modern world, experiences have become more crucial than products. According to the Centre for Agriculture and Bioscience International (CABI), an average UK household spends around $60.65 per week on leisure and culture. Recreation spending in the U.S. has witnessed an increase of 24% from 2012 to 2017, while that of UK has increased by 17% in the same time frame. With the rise in economic growth and rise in disposable income of the consumers, consumers are spending more on upgrading their lifestyle. It is estimated that the expenditure on travel and entertainment increased from 5.5% in 2011 to 11% in 2017, in China. Therefore, the rise in consumer expenditure on recreational and leisure activities is expected to boost the global discount events and experiences market growth during the forecast period.
To increase awareness about products and services offered by various companies, the leading players operating in myriad industry sponsor events, such as music concerts, arts & crafts, theaters, exhibitions, and sports events. Sponsorship is done to provide material support to an event or an organization. In addition, sponsorship enables the leading players to advertise their products and reach to a wide range of consumer base, thereby fueling the adoption of their products. Moreover, it helps to focus on consumer preference and to foster brand loyalty. Furthermore, it draws attention of the existing and potential customers of a brand or company and creates a positive impact on them, thereby leading to increase brand loyalty. Sponsors further check the past proven records of a particular event as well as the probability of success of the event before they sponsor an event, as they invest in a plan, and expect positive return on the investment. The most common sponsorship can be seen in the field of sports and entertainment, ranging from local to regional events.
The huge adoption of digital devices like smartphones and laptops along with the rise in penetration of internet across the globe has led to the democratization of information. Moreover, there are several platforms and service providers that offer customers’ reviews on various experiential products or experiences that might help people to gain more insights and information regarding the different experiential products and services, such as trips, driving, restaurants for food, and art and crafts. For instance, TripAdvisor provides over 730 million reviews of more than 8 million hotels, vacation homes, restaurants, and tourist attractions and it also hosts more than 160 million photos of travelers. With the establishment of various efficient digital business models and rise in penetration of internet, the democratization of information has evolved rapidly. According to the International Telecommunication Union (ITU), around 4.9 billion people across the globe had access to the internet in 2021. Thus, the democratization of the information is expected to play a crucial role in the further growth of the discount events and experiences market in the foreseeable future.
According to the discount events and experiences market analysis, the market is segmented on the basis of service type and region. By service type, the market is segmented into driving, food and drink, spa and beauty, tour and travel, sports, sightseeing, theater and events, arts and crafts, and others. Region-wise, the discount events and experiences market is analyzed across North America (the U.S., Canada, and Mexico), Europe (Germany, France, UK, Italy, Spain, Russia, Netherlands, Sweden, Belgium, Denmark, Finland, Poland, and rest of Europe), Asia-Pacific (China, Japan, Australia, India, Singapore, Thailand, Malaysia and rest of Asia-Pacific), and LAMEA (Brazil, Argentina, Saudi Arabia, South Africa, UAE, rest of LAMEA).
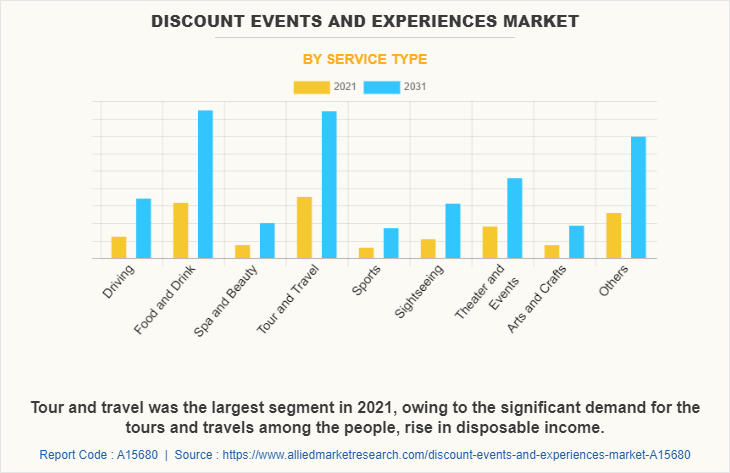
As per the discount events and experiences market forecast, by service type, the tour and travel segment dominated the market, accounting for 22.7% of the discount events and experiences market share in 2021. The significant demand for the tours and travels among the people, rise in disposable income, and rise in desire for exploring new places among the millennials are some of the major drivers of the tour and travel segment.
The global tourism industry has witnessed a significant and rapid downfall during the COVID-19 pandemic and it has become very tough for this sector to grow and stand again. Airlines sector as well as the hotel industry suffered a major downfall during pandemic period. According to World Travel and Tour Council latest Annual Economic Benefits Report (EIR), spending by foreign visitors in 2021 increased by only 1.4% to $40.3 billion, to $190.9 billion in 2019. It remained far short. The report predicts that the travel and tourism sector in many countries will return to pre-pandemic figures by 2021. The tour & travel industry is bouncing back to new heights with proper strategies in the market. The need and importance the consumers are feeling to maintain personal time and wellbeing is driving the industry with a faster growth rate. The growth in technology has helped the industry to lure more and more customers. Having control of everything, from experience of journey purchase, lodging & maintaining facilities like room service and dinning at their fingertips with the help of proper AI and app had definitely earned a star for the tour & travel industry. So, discount events and experiences can be a bonus point to attract the consumers as it will lure the consumers towards the players.
Further, as per the discount events and experiences market trends, by service type, sightseeing is expected to witness the highest CAGR of 8.7% from 2022 to 2031. Discounts can be offered for a variety of reasons, including to promote a new destination, to encourage repeat visits, or to entice customers to book during off-peak times. The market is driven by a number of factors, including economic growth, increased air travel, and a growing desire for unique experiences. Economic growth is a major driver of the sightseeing segment. As economies around the globe expand, more people have disposable income to spend on leisure travel. This increase in disposable income has led to a boom in sightseeing, as more people are able to afford to travel to see new and interesting places. Similarly, the increased availability of air travel has made it easier for people to travel to different parts of the world. This has led to a growth in the number of people taking sightseeing trips, as it is now easier than ever to visit new and exciting places. Finally, a growing desire for unique experiences has also contributed to the growth of the market.
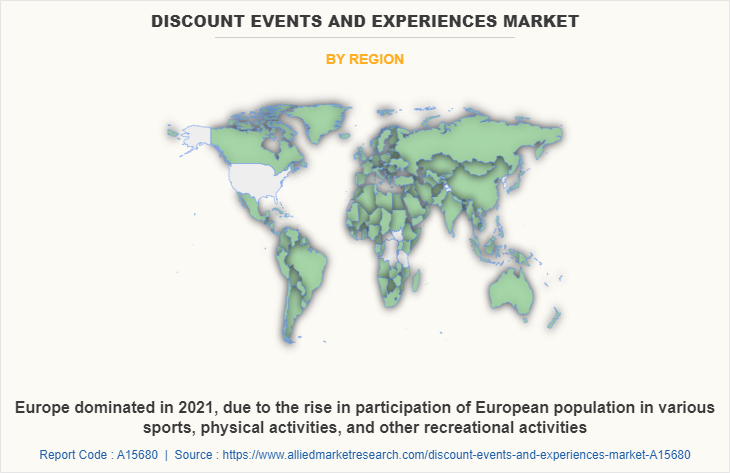
Region-wise, Europe dominated the global market in 2021, garnering a market share of 36.9%, followed by North America with 29.8% and Asia-Pacific with 28.0%. Asia-Pacific is estimated to be the fastest-growing market during the forecast period, owing to the upsurge in the frequency various exhibitions, concerts, and sports events.
The rise in participation of European population in various sports, physical activities, and other recreational activities has significantly fostered the growth of the discount events and experiences market in the past few years. According to the Eurostat, in 2019, around 44% of the European Union population participated in sports, physical, and recreational activities at least once a week. Furthermore, the rise in trend of online ticket bookings for events and experiences in Europe is playing a crucial role in the growth of the market. The surging adoption of internet, rise in usage of social media, developments in the tourism industry, increasing inclination of population towards exotic and unique experiences, and higher personal disposable income of the consumers are the major factors that has led to the dominance of Europe in the discount events and experiences market. Moreover, the rise in interests of the people towards sports is expected to boost the growth of the sports segment in the European discount events and experiences market in the forthcoming future.
The demand for the discount events and experiences in Asia-Pacific is expected to grow significantly owing to the rise in participation of people in numerous recreational and leisure activities. The growing disposable income of the consumers due to strong economic growth in the past few years, improving standards of living, growing penetration of internet, rise in adoption of social media, presence of huge number of middle income consumers, and presence of huge number of millennial and Gen Z population are the major factors that are expected to foster the growth of the discount events and experiences market. The increasing number of exotic spa, unique theme based restaurants, rise in government initiatives to promote domestic and international tourism, and surge in the number of leisure trips in the region is expected to further drive the market growth in this region. According to the Centre for Agriculture and Bioscience International (CABI), the expenditure on travel and entertainment increased from 5.5% in 2011 to 11% in 2017, in China. This rise in expenditure on travel and entertainment in the developing nations like China is presenting a lucrative growth opportunities to the players operating in the global discount events and experiences market.
Groupon, Inc., Eventbrite, Zoutons, GrabOn, Virgin Experience Days, Activity Superstore, Buyagift, Red Letter Days, GFM ClearComms, Anschutz Entertainment Group, CL Events, Clarion Events Ltd., DRPG Group, and Entertaining Asia are some of the leading players in the global discount events and experiences industry. These market players are constantly engaged in various developmental strategies such as partnerships, acquisitions & mergers, agreement, and joint ventures to gain competitive edge over others and exploit the prevailing discount events and experiences market opportunities.
Discount Events And Experiences Market Report Highlights
Aspects | Details |
---|---|
By Service Type |
|
By Region |
|
Key Market Players | red letter days, buyagift, CL Events, activity superstore, DRPG Group, virgin experience days, Eventbrite, Inc., Zoutons, Groupon, Inc., Clarion Events Limited, ANSCHUTZ ENTERTAINMENT GROUP, GrabOn, gfm clearcomms, ENTERTAINING ASIA, vagaro inc |
CHAPTER 1:INTRODUCTION
1.1.Report description
1.2.Key benefits for stakeholders
1.3.Key market segments
1.4.Research methodology
1.4.1.Primary research
1.4.2.Secondary research
1.4.3.Analyst tools and models
CHAPTER 2:EXECUTIVE SUMMARY
2.1.Key findings of the study
2.2.CXO perspective
CHAPTER 3:MARKET OVERVIEW
3.1.Market definition and scope
3.2.Key findings
3.2.1.Top investment pockets
3.3.Porter's five force analysis
3.4.Market player positioning, 2021
3.5.Market dynamics
3.5.1.Drivers
3.5.1.1.Rising consumer expenditure on leisure and recreational activities
3.5.1.2.Rise in disposable income
3.5.1.3.Increase in sponsorship for events
3.5.2.Restraints
3.5.2.1.High operational cost involved in organizing events
3.5.2.2.Entry barriers due to presence of existing giant players
3.5.3.Opportunities
3.5.3.1.Technological advancements
3.5.3.2.Democratization of information to play a significant role
3.6.Parent-peer market outlook
3.6.1.Parent : Peer Market Overview, 2021
3.7.Market share analysis (2021 and 2031)
3.7.1.By  Service type
3.7.2.Region
3.8.Top Impacting factors
3.9.COVID-19 impact on the discount events and experiences market
CHAPTER 4:DISCOUNT EVENTS AND EXPERIENCES MARKET, BY SERVICE TYPE
4.1.Overview
4.1.1.Market size and forecast by  Service Type
4.2.Driving
4.2.1.Key market trends, growth factors, and opportunities
4.2.2.Market size and forecast, by region
4.3.Food and Drink
4.3.1.Key market trends, growth factors, and opportunities
4.3.2.Market size and forecast, by region
4.4.Spa and Beauty
4.4.1.Key market trends, growth factors, and opportunities
4.4.2.Market size and forecast, by region
4.5.Tour and Travel
4.5.1.Key market trends, growth factors, and opportunities
4.5.2.Market size and forecast, by region
4.6.Sports
4.6.1.Key market trends, growth factors, and opportunities
4.6.2.Market size and forecast, by region
4.7.Sightseeing
4.7.1.Key market trends, growth factors, and opportunities
4.7.2.Market size and forecast, by region
4.8.Theater and Events
4.8.1.Key market trends, growth factors, and opportunities
4.8.2.Market size and forecast, by region
4.9.Arts and Crafts
4.9.1.Key market trends, growth factors, and opportunities
4.9.2.Market size and forecast, by region
4.10.Others
4.10.1.Key market trends, growth factors, and opportunities
4.10.2.Market size and forecast, by region
CHAPTER 5:DISCOUNT EVENTS AND EXPERIENCES MARKET, BY REGION
5.1.Overview
5.1.1.Market size and forecast by region
5.2.North America
5.2.1.Key market trends, growth factors, and opportunities
5.2.2.Market size and forecast, by Service Types
5.2.3.Market size and forecast, by country
5.2.3.1.U.S.
5.2.3.1.1.Market size and forecast, by  Service Types
5.2.3.2.Canada
5.2.3.2.1.Market size and forecast, by Service Types
5.2.3.3.Mexico
5.2.3.3.1.Market size and forecast, by Service Types
5.3.Europe
5.3.1.Key market trends, growth factors, and opportunities
5.3.2.Market size and forecast, by  Service Types
5.3.3.Market size and forecast, by country
5.3.3.1.Germany
5.3.3.1.1.Market size and forecast, by Service Types
5.3.3.2.France
5.3.3.2.1.Market size and forecast, by Service Types
5.3.3.3.UK
5.3.3.3.1.Market size and forecast, by  Service Types
5.3.3.4.Italy
5.3.3.4.1.Market size and forecast, by  Service Types
5.3.3.5.Spain
5.3.3.5.1.Market size and forecast, by  Service Types
5.3.3.6.Russia
5.3.3.6.1.Market size and forecast, by  Service Types
5.3.3.7.Netherlands
5.3.3.7.1.Market size and forecast, by Service Types
5.3.3.8.Sweden
5.3.3.8.1.Market size and forecast, by Service Types
5.3.3.9.Belgium
5.3.3.9.1.Market size and forecast, by Service Types
5.3.3.10.Denmark
5.3.3.10.1.Market size and forecast, by Service Types
5.3.3.11.Finland
5.3.3.11.1.Market size and forecast, by Service Types
5.3.3.12.Poland
5.3.3.12.1.Market size and forecast, by Service Types
5.3.3.13.Rest of Europe
5.3.3.13.1.Market size and forecast, by Service Types
5.4.Asia-Pacific
5.4.1.Key market trends, growth factors, and opportunities
5.4.2.Market size and forecast, by Service Types
5.4.3.Market size and forecast, by country
5.4.3.1.China
5.4.3.1.1.Market size and forecast, by  Service Types
5.4.3.2.Japan
5.4.3.2.1.Market size and forecast, by Service Types
5.4.3.3.Australia
5.4.3.3.1.Market size and forecast, by  Service Types
5.4.3.4.India
5.4.3.4.1.Market size and forecast, by Service Types
5.4.3.5.Singapore
5.4.3.5.1.Market size and forecast, by Service Types
5.4.3.6.Thailand
5.4.3.6.1.Market size and forecast, by Service Types
5.4.3.7.Malaysia
5.4.3.7.1.Market size and forecast, by Service Types
5.4.3.8.Rest of Asia-Pacific
5.4.3.8.1.Market size and forecast, by Service  Types
5.5.LAMEA
5.5.1.Key market trends, growth factors, and opportunities
5.5.2.Market size and forecast, by Service Types
5.5.3.Market size and forecast, by country
5.5.3.1.Brazil
5.5.3.1.1.Market size and forecast, by Service  Types
5.5.3.2.Argentina
5.5.3.2.1.Market size and forecast, by  Service  Types
5.5.3.3.Saudi Arabia
5.5.3.3.1.Market size and forecast, by Service  Types
5.5.3.4.South Africa
5.5.3.4.1.Market size and forecast, by Service  Types
5.5.3.5.UAE
5.5.3.5.1.Market size and forecast, by Service  Types
5.5.3.6.Rest of LAMEA
5.5.3.6.1.Market size and forecast, by Service Types
CHAPTER 6:COMPETITIVE LANDSCAPE
6.1.Top winning strategies
6.2.Product mapping
6.3.Competitive dashboard
6.4.Competitive heat map
6.5.Key developments
6.5.1.Acquisition
CHAPTER 7:COMPANY PROFILES
7.1.ACTIVITY SUPERSTORE
7.1.1.Company overview
7.1.2.Key executives
7.1.3.Company snapshot
7.1.4.Product portfolio
7.2.ANSCHUTZ ENTERTAINMENT GROUP
7.2.1.Company overview
7.2.2.Key Executive
7.2.3.Company snapshot
7.2.4.Product portfolio
7.3.BUYAGIFT
7.3.1.Company overview
7.3.2.Key executives
7.3.3.Company snapshot
7.3.4.Operating business segments
7.3.5.Product portfolio
7.4.CL EVENTS
7.4.1.Company overview
7.4.2.Company snapshot
7.4.3.Product portfolio
7.5.CLARION EVENTS LTD.
7.5.1.Company overview
7.5.2.Key Executives
7.5.3.Company snapshot
7.5.4.Product portfolio
7.5.5.Key strategic moves and developments
7.6.DRPG GROUP
7.6.1.Company overview
7.6.2.Key Executive
7.6.3.Company snapshot
7.6.4.Product portfolio
7.7.ENTERTAINING ASIA
7.7.1.Company overview
7.7.2.Key Executive
7.7.3.Company snapshot
7.7.4.Product portfolio
7.8.EVENTBRITE, INC.
7.8.1.Company overview
7.8.2.Key executives
7.8.3.Company snapshot
7.8.4.Operating business segments
7.8.5.Product portfolio
7.8.6.Business performance
7.8.7.Key strategic moves and developments
7.9.GFM HOLDINGS LTD.
7.9.1.Company overview
7.9.2.Key executives
7.9.3.Company snapshot
7.9.4.Product portfolio
7.10.GRABON
7.10.1.Company overview
7.10.2.Key executives
7.10.3.Company snapshot
7.10.4.Product portfolio
7.11.GROUPON, INC.
7.11.1.Company overview
7.11.2.Key executives
7.11.3.Company snapshot
7.11.4.Operating business segments
7.11.5.Product portfolio
7.11.6.Business performance
7.12.RED LETTER DAYS
7.12.1.Company overview
7.12.2.Key executives
7.12.3.Company snapshot
7.12.4.Product portfolio
7.13.VAGARO
7.13.1.Company overview
7.13.2.Key executives
7.13.3.Company snapshot
7.13.4.Product portfolio
7.14.VIRGIN EXPERIENCE DAYS
7.14.1.Company overview
7.14.2.Key executives
7.14.3.Company snapshot
7.14.4.Product portfolio
7.15.ZOUTONS
7.15.1.Company overview
7.15.2.Key executives
7.15.3.Company snapshot
7.15.4.Product portfolio
LIST OF TABLES
TABLE 01.DISCOUNT EVENTS AND EXPERIENCES MARKET, BY  SERVICE TYPE, 2021–2031 ($MILLION)
TABLE 02.DRIVING DISCOUNT EVENTS AND EXPERIENCES  MARKET, BY REGION, 2021–2031 ($MILLION)
TABLE 03.FOOD AND DRINK DISCOUNT EVENTS AND EXPERIENCES MARKET, BY REGION, 2021–2031 ($MILLION)
TABLE 04.SPA AND BEAUTY DISCOUNT EVENTS AND EXPERIENCES MARKET, BY REGION, 2021–2031 ($MILLION)
TABLE 05.TOUR AND TRAVEL DISCOUNT EVENTS AND EXPERIENCES MARKET, BY REGION, 2021–2031 ($MILLION)
TABLE 06.SPORTS DISCOUNT EVENTS AND EXPERIENCES MARKET, BY REGION, 2021–2031 ($MILLION)
TABLE 07.SIGHTSEEING DISCOUNT EVENTS AND EXPERIENCES MARKET, BY REGION, 2021–2031 ($MILLION)
TABLE 08.THEATER AND EVENTS DISCOUNT EVENTS AND EXPERIENCES MARKET, BY REGION, 2021–2031 ($MILLION)
TABLE 09.AIR AND CRAFT DISCOUNT EVENTS AND EXPERIENCES MARKET, BY REGION, 2021–2031 ($MILLION)
TABLE 10.OTHERS DISCOUNT EVENTS AND EXPERIENCES MARKET, BY REGION, 2021–2031 ($MILLION)
TABLE 11.DISCOUNT EVENTS AND EXPERIENCES MARKET, BY REGION, 2021–2031 ($MILLION)
TABLE 12.NORTH AMERICA DISCOUNT EVENTS AND EXPERIENCES MARKET, BY SERVICE TYPES, 2021–2031 ($MILLION)
TABLE 13.NORTH AMERICA DISCOUNT EVENTS AND EXPERIENCES MARKET, BY COUNTRY, 2021–2031 ($MILLION)
TABLE 14.U.S. DISCOUNT EVENTS AND EXPERIENCES MARKET, BY SERVICE TYPES, 2021–2031 ($MILLION)
TABLE 15.CANADA DISCOUNT EVENTS AND EXPERIENCES MARKET, BY SERVICE TYPES, 2021–2031 ($MILLION)
TABLE 16.MEXICO DISCOUNT EVENTS AND EXPERIENCES MARKET, BY SERVICE TYPES, 2021–2031 ($MILLION)
TABLE 17.DISCOUNT EVENTS AND EXPERIENCES MARKET, BY SERVICE TYPES, 2021–2031 ($MILLION)
TABLE 18.DISCOUNT EVENTS AND EXPERIENCES MARKET, BY COUNTRY, 2021–2031 ($MILLION)
TABLE 19.GERMANY DISCOUNT EVENTS AND EXPERIENCES MARKET, BY SERVICE TYPES, 2021–2031 ($MILLION)
TABLE 20.FRANCE DISCOUNT EVENTS AND EXPERIENCES MARKET, BY SERVICE TYPES, 2021–2031 ($MILLION)
TABLE 21.UK DISCOUNT EVENTS AND EXPERIENCES MARKET, BY  SERVICE TYPES, 2021–2031 ($MILLION)
TABLE 22.ITALY DISCOUNT EVENTS AND EXPERIENCES MARKET, BY SERVICE TYPES, 2021–2031 ($MILLION)
TABLE 23.SPAIN DISCOUNT EVENTS AND EXPERIENCES MARKET, BY SERVICE TYPES, 2021–2031 ($MILLION)
TABLE 24.RUSSIA DISCOUNT EVENTS AND EXPERIENCES MARKET, BY SERVICE TYPES, 2021–2031 ($MILLION)
TABLE 25.NETHERLANDS DISCOUNT EVENTS AND EXPERIENCES MARKET, BY SERVICE TYPES, 2021–2031 ($MILLION)
TABLE 26.SWEDEN DISCOUNT EVENTS AND EXPERIENCES MARKET, BY SERVICE TYPES, 2021–2031 ($MILLION)
TABLE 27.BELGIUM DISCOUNT EVENTS AND EXPERIENCES MARKET, BY SERVICE TYPES, 2021–2031 ($MILLION)
TABLE 28.DENMARK DISCOUNT EVENTS AND EXPERIENCES MARKET, BY SERVICE TYPES, 2021–2031 ($MILLION)
TABLE 29.FINLAND DISCOUNT EVENTS AND EXPERIENCES MARKET, BY SERVICE TYPES, 2021–2031 ($MILLION)
TABLE 30.POLAND DISCOUNT EVENTS AND EXPERIENCES MARKET, BY SERVICE TYPES, 2021–2031 ($MILLION)
TABLE 31.REST OF EUROPE DISCOUNT EVENTS AND EXPERIENCES MARKET, BY SERVICE TYPES, 2021–2031 ($MILLION)
TABLE 32.ASIA-PACIFIC DISCOUNT EVENTS AND EXPERIENCES MARKET, BY SERVICE TYPES, 2021–2031 ($MILLION)
TABLE 33.ASIA-PACIFIC DISCOUNT EVENTS AND EXPERIENCES MARKET, BY COUNTRY, 2021–2031 ($MILLION)
TABLE 34.CHINA DISCOUNT EVENTS AND EXPERIENCES MARKET, BY SERVICE TYPES, 2021–2031 ($MILLION)
TABLE 35.JAPAN DISCOUNT EVENTS AND EXPERIENCES MARKET, BY SERVICE TYPES, 2021–2031 ($MILLION)
TABLE 36.AUSTRALIA DISCOUNT EVENTS AND EXPERIENCES MARKET, BY SERVICE TYPES, 2021–2031 ($MILLION)
TABLE 37.INDIA DISCOUNT EVENTS AND EXPERIENCES MARKET, BY SERVICE TYPES, 2021–2031 ($MILLION)
TABLE 38.SINGAPORE DISCOUNT EVENTS AND EXPERIENCES MARKET, BY SERVICE TYPES, 2021–2031 ($MILLION)
TABLE 39.THAILAND DISCOUNT EVENTS AND EXPERIENCES MARKET, BY V TYPES, 2021–2031 ($MILLION)
TABLE 40.MALAYSIA DISCOUNT EVENTS AND EXPERIENCES MARKET, BY V TYPES, 2021–2031 ($MILLION)
TABLE 41.REST OF AISA PACIFIC DISCOUNT EVENTS AND EXPERIENCES MARKET, BY SERVICE  TYPES, 2021–2031 ($MILLION)
TABLE 42.LAMEA DISCOUNT EVENTS AND EXPERIENCES MARKET, BY SERVICE  TYPES, 2021–2031 ($MILLION)
TABLE 43.LAMEA DISCOUNT EVENTS AND EXPERIENCES MARKET, BY COUNTRY, 2021–2031 ($MILLION)
TABLE 44.BRAZIL DISCOUNT EVENTS AND EXPERIENCES MARKET, BY SERVICE  TYPES, 2021–2031 ($MILLION)
TABLE 45.ARGENTINA  DISCOUNT EVENTS AND EXPERIENCES MARKET, BY SERVICE  TYPES, 2021–2031 ($MILLION)
TABLE 46.SAUDI ARABIA DISCOUNT EVENTS AND EXPERIENCES MARKET, BY SERVICE  TYPES, 2021–2031 ($MILLION)
TABLE 47.SOUTH AFRICA DISCOUNT EVENTS AND EXPERIENCES MARKET, BY SERVICE  TYPES, 2021–2031 ($MILLION)
TABLE 48.UAE DISCOUNT EVENTS AND EXPERIENCES MARKET, BY SERVICE  TYPES, 2021–2031 ($MILLION)
TABLE 49.REST OF LAMEA DISCOUNT EVENTS AND EXPERIENCES MARKET, BY SERVICE TYPES, 2021–2031 ($MILLION)
TABLE 50.ACTIVITY SUPERSTORE: KEY EXECUTIVES -
TABLE 51.ACTIVITY SUPERSTORE: COMPANY SNAPSHOT
TABLE 52.ACTIVITY SUPERSTORE: PRODUCT PORTFOLIO
TABLE 53.ANSCHUTZ ENTERTAINMENT GROUP : KEY EXECUTIVE
TABLE 54.ANSCHUTZ ENTERTAINMENT GROUP : COMPANY SNAPSHOT
TABLE 55.ANSCHUTZ ENTERTAINMENT GROUP : PRODUCT PORTFOLIO
TABLE 56.BUYAGIFT: KEY EXECUTIVES -
TABLE 57.BUYAGIFT: COMPANY SNAPSHOT
TABLE 58.BUYAGIFT: OPERATING BUSINESS SEGMENTS
TABLE 59.BUYAGIFT:PRODUCT PORTFOLIO
TABLE 60.CL EVENTS: COMPANY SNAPSHOT
TABLE 61.CL EVENTS: PRODUCT PORTFOLIO
TABLE 62.CLARION EVENTS LTD: KEY EXECUTIVES
TABLE 63.CLARION EVENTS LTD: COMPANY SNAPSHOT
TABLE 64.CLARION EVENTS LTD: PRODUCT PORTFOLIO
TABLE 65.DRPG GROUP: KEY EXECUTIVE
TABLE 66.DRPG GROUP: COMPANY SNAPSHOT
TABLE 67.DRPG GROUP: PRODUCT PORTFOLIO
TABLE 68.ENTERTAINING ASIA: KEY EXECUTIVE
TABLE 69.ENTERTAINING ASIA: COMPANY SNAPSHOT
TABLE 70.ENTERTAINING ASIA: PRODUCT PORTFOLIO
TABLE 71.EVENTBRITE, INC.: KEY EXECUTIVES -
TABLE 72.EVENTBRITE, INC.: COMPANY SNAPSHOT
TABLE 73.EVENTBRITE, INC.: OPERATING BUSINESS SEGMENTS
TABLE 74.EVENTBRITE, INC.: PRODUCT PORTFOLIO
TABLE 75.EVENTBRITE, INC.: BUSINESS PERFORMANCE, 2019-2021 ($MILLION)
TABLE 76.EVENTBRITE, INC.: KEY STRATEGIC AND DEVELOPMENTS
TABLE 77.GFM HOLDINGS LTD: KEY EXECUTIVES -
TABLE 78.GFM HOLDINGS LTD: COMPANY SNAPSHOT
TABLE 79.GFM HOLDINGS LTD: PRODUCT PORTFOLIO
TABLE 80.GRABON: KEY EXECUTIVES -
TABLE 81.GRABON: COMPANY SNAPSHOT
TABLE 82.GRABON: PRODUCT PORTFOLIO
TABLE 83.GROUPON, INC.: KEY EXECUTIVES -
TABLE 84.GROUPON, INC.: COMPANY SNAPSHOT
TABLE 85.GROUPON, INC.: OPERATING BUSINESS SEGMENTS
TABLE 86.GROUPON, INC.: PRODUCT PORTFOLIO
TABLE 87.GROUPON, INC.: BUSINESS PERFORMANCE, 2019-2021 ($THOUSANDS)
TABLE 88.RED LETTER DAYS: KEY EXECUTIVES -
TABLE 89.TABLE 2. RED LETTER DAYS: COMPANY SNAPSHOT
TABLE 90.RED LETTER DAYS: PRODUCT PORTFOLIO
TABLE 91.VAGARO: KEY EXECUTIVES -
TABLE 92.VAGARO: COMPANY SNAPSHOT
TABLE 93.VAGARO: PRODUCT PORTFOLIO
TABLE 94.VIRGIN EXPERIENCE DAYS: KEY EXECUTIVES -
TABLE 95.VIRGIN EXPERIENCE DAYS: COMPANY SNAPSHOT
TABLE 96.VIRGIN EXPERIENCE DAYS: PRODUCT PORTFOLIO
TABLE 97.ZOUTONS: KEY EXECUTIVES -
TABLE 98.ZOUTONS: COMPANY SNAPSHOT
TABLE 99.ZOUTONS: PRODUCT PORTFOLIO
LIST OF FIGURES
FIGURE 01.DISCOUNT EVENTS AND EXPERIENCES MARKET SNAPSHOT
FIGURE 02.GLOBAL DISCOUNT EVENTS AND EXPERIENCES MARKET SEGMENTATION
FIGURE 03.TOP INVESTMENT POCKETS, 2021–2031
FIGURE 04.MODERATE BARGAINING POWER OF SUPPLIERS
FIGURE 05.LOW BARGAINING POWER OF BUYERS
FIGURE 06.MODERATE THREAT OF NEW ENTRANTS
FIGURE 07.LOW THREAT OF SUBSTITUTION
FIGURE 08.MODERATE INTENSITY OF COMITIVE RIVALRY
FIGURE 09.MARKET PLAYER POSITIONING, 2021
FIGURE 10.DISCOUNT EVENTS AND EXPERIENCES MARKET: DRIVERS, RESTRAINTS, AND OPPORTUNITIES, 2021–2031
FIGURE 11.U.S. CONSUMER EXPENDITURE, BY CATEGORY, 2000 TO 2030
FIGURE 12.DISCOUNT EVENTS AND EXPERIENCE MARKET: PARENT-PEER MARKET OUTLOOK, 2021
FIGURE 13.MARKET SHARE ANALYSIS, BY SERVICE TYPE, 2021 AND 2031 (%)
FIGURE 14.MARKET SHARE ANALYSIS, BY REGION, 2021 AND 2031 (%)
FIGURE 15.DISCOUNT EVENTS AND EXPERIENCES MARKET: TOP IMPACTING FACTORS, 2021 & 2031
FIGURE 16.GRAPHICAL REPRESENTATION OF INTERNATIONAL TOURIST ARRIVALS, 2010 TO 2020
FIGURE 17.DISCOUNT EVENTS AND EXPERIENCES MARKET, BY SERVICE TYPE, 2021 (%)
FIGURE 18.COMPARATIVE SHARE ANALYSIS OF MUMMY DISCOUNT EVENTS AND EXPERIENCES MARKET REVENUE, BY COUNTRY, 2021 & 2031 (%)
FIGURE 19.COMPARATIVE SHARE ANALYSIS OF RECTANGULAR DISCOUNT EVENTS AND EXPERIENCES MARKET REVENUE, BY COUNTRY, 2021 & 2031 (%)
FIGURE 20.COMPARATIVE SHARE ANALYSIS OF OTHERS MARKET REVENUE, BY COUNTRY, 2021 & 2031 (%)
FIGURE 21.COMPARATIVE SHARE ANALYSIS OF OTHERS MARKET REVENUE, BY COUNTRY, 2021 & 2031 (%)
FIGURE 22.COMPARATIVE SHARE ANALYSIS OF OTHERS MARKET REVENUE, BY COUNTRY, 2021 & 2031 (%)
FIGURE 23.COMPARATIVE SHARE ANALYSIS OF OTHERS MARKET REVENUE, BY COUNTRY, 2021 & 2031 (%)
FIGURE 24.COMPARATIVE SHARE ANALYSIS OF OTHERS MARKET REVENUE, BY COUNTRY, 2021 & 2031 (%)
FIGURE 25.COMPARATIVE SHARE ANALYSIS OF OTHERS MARKET REVENUE, BY COUNTRY, 2021 & 2031 (%)
FIGURE 26.COMPARATIVE SHARE ANALYSIS OF OTHERS MARKET REVENUE, BY COUNTRY, 2021 & 2031 (%)
FIGURE 27.DISCOUNT EVENTS AND EXPERIENCES MARKET, BY REGION, 2021 (%)
FIGURE 28.U.S. POPULATION, BY GENERATION, 2019
FIGURE 29.U.S. DISCOUNT EVENTS AND EXPERIENCES MARKET, 2021–2031 ($MILLION)
FIGURE 30.CANADA DISCOUNT EVENTS AND EXPERIENCES MARKET, 2021–2031 ($MILLION)
FIGURE 31.MEXICO DISCOUNT EVENTS AND EXPERIENCES MARKET, 2021–2031 ($MILLION)
FIGURE 32.GERMANY DISCOUNT EVENTS AND EXPERIENCES MARKET, 2021–2031 ($MILLION)
FIGURE 33.FRANCE DISCOUNT EVENTS AND EXPERIENCES MARKET, 2021–2031 ($MILLION)
FIGURE 34.UK DISCOUNT EVENTS AND EXPERIENCES MARKET, 2021–2031 ($MILLION)
FIGURE 35.ITALY DISCOUNT EVENTS AND EXPERIENCES MARKET, 2021–2031 ($MILLION)
FIGURE 36.SPAIN DISCOUNT EVENTS AND EXPERIENCES MARKET, 2021–2031 ($MILLION)
FIGURE 37.RUSSIA DISCOUNT EVENTS AND EXPERIENCES MARKET, 2021–2031 ($MILLION)
FIGURE 38.NETHERLANDS DISCOUNT EVENTS AND EXPERIENCES MARKET, 2021–2031 ($MILLION)
FIGURE 39.SWEDEN DISCOUNT EVENTS AND EXPERIENCES MARKET, 2021–2031 ($MILLION)
FIGURE 40.BELGIUM DISCOUNT EVENTS AND EXPERIENCES MARKET, 2021–2031 ($MILLION)
FIGURE 41.DENMARK DISCOUNT EVENTS AND EXPERIENCES MARKET, 2021–2031 ($MILLION)
FIGURE 42.FINLAND DISCOUNT EVENTS AND EXPERIENCES MARKET, 2021–2031 ($MILLION)
FIGURE 43.POLAND DISCOUNT EVENTS AND EXPERIENCES MARKET, 2021–2031 ($MILLION)
FIGURE 44.REST OF EUROPE DISCOUNT EVENTS AND EXPERIENCES MARKET, 2021–2031 ($MILLION)
FIGURE 45.CHINA DISCOUNT EVENTS AND EXPERIENCES MARKET, 2021–2031 ($MILLION)
FIGURE 46.JAPAN DISCOUNT EVENTS AND EXPERIENCES MARKET, 2021–2031 ($MILLION)
FIGURE 47.AUSTRALIA DISCOUNT EVENTS AND EXPERIENCES MARKET, 2021–2031 ($MILLION)
FIGURE 48.INDIA DISCOUNT EVENTS AND EXPERIENCES MARKET, 2021–2031 ($MILLION)
FIGURE 49.SINGAPORE DISCOUNT EVENTS AND EXPERIENCES MARKET, 2021–2031 ($MILLION)
FIGURE 50.THAILAND DISCOUNT EVENTS AND EXPERIENCES MARKET, 2021–2031 ($MILLION)
FIGURE 51.MALAYSIA DISCOUNT EVENTS AND EXPERIENCES MARKET, 2021–2031 ($MILLION)
FIGURE 52.REST OF AISA-PACIFIC DISCOUNT EVENTS AND EXPERIENCES MARKET, 2021–2031 ($MILLION)
FIGURE 53.BRAZIL DISCOUNT EVENTS AND EXPERIENCES MARKET, 2021–2031 ($MILLION)
FIGURE 54.ARGENTINA DISCOUNT EVENTS AND EXPERIENCES MARKET, 2021–2031 ($MILLION)
FIGURE 55.SAUDI ARABIA DISCOUNT EVENTS AND EXPERIENCES MARKET, 2021–2031 ($MILLION)
FIGURE 56.SOUTH AFRICA DISCOUNT EVENTS AND EXPERIENCES MARKET, 2021–2031 ($MILLION)
FIGURE 57.UAE DISCOUNT EVENTS AND EXPERIENCES MARKET, 2021–2031 ($MILLION)
FIGURE 58.REST OF LAMEA DISCOUNT EVENTS AND EXPERIENCES MARKET, 2021–2031 ($MILLION)
FIGURE 59.TOP WINNING STRATEGIES, BY YEAR, 2019–2021*
FIGURE 60.TOP WINNING STRATEGIES, BY DEVELOPMENT, 2019–2021* (%)
FIGURE 61.TOP WINNING STRATEGIES, BY COMPANY, 2019–2021*
FIGURE 62.PRODUCT MAPPING OF TOP 15 KEY PLAYERS
FIGURE 63.COMPETITIVE DASHBOARD OF TOP 15 KEY PLAYERS
FIGURE 64.COMPETITIVE HEATMAP OF TOP 10 KEY PLAYERS
FIGURE 65.EVENTBRITE, INC.: BUSINESS PERFORMANCE, 2019-2021 ($MILLION)
FIGURE 66.EVENTBRITE, INC.: FOR REGION
FIGURE 67.GROUPON, INC.: BUSINESS PERFORMANCE, 2019-2021 ($THOUSANDS)
FIGURE 68.GROUPON, INC.: REVENUE SHARE BY REGION, 2021 (%)
FIGURE 69.GROUPON, INC.: REVENUE SHARE BY SEGMENT, 2021 (%)
The discount events and experiences market is growing at a significant pace, and is anticipated to continue this trend in the coming years. It has been witnessed that the Gen X and millennials are significantly spending on the experiential products and services, owing to the rise in disposable income and improvement in the standards of living. The rise in employment rate and gradual rise of the middle class is expected to be a key growth factor for the market, especially in the developing economies like China, India, and Brazil. The rise in consumer expenditure on experiential services is boosting the demand for the discount events and experiences significantly. Furthermore, the increasing indulgences of consumers in developed economies like Canada, the U.S., Germany, and UK in leisure and recreational activities owing to the rise in disposable income and improving living standards is expected to further fuel the growth of the market during the forecast period. The presence of huge millennials and gen z population in the U.S. is presenting a lucrative growth opportunity for the market players, as these generations spend more on experiences and recreational activities. According to The Brookings Institution, a non-profit public policy organization in the U.S., around 50.7% of the U.S. population consisted of millennials, Gen Z, and younger (post Gen Z) generations in 2019.
A. The global discount events and experiences market size was valued at $77,374.5 million in 2021, and is estimated to reach $202,563.2 million by 2031, registering a CAGR of 7.6% from 2022 to 2031.The demand for the discount events and experiences is significantly driven by rise in disposable income, rise in consumer spending on leisure activities, and increasing indulgence of people in various adventure and recreational activities. The demand for the leisure, entertainment, adventure, and recreational activities is significantly higher in the developed regions like Europe and North America.
A. The report is available on request on the website of Allied Market Research.
A. The forecast period considered in the global discount events and experiences market report is from 2022 to 2031. The report analyzes the market sizes from 2022 to 2031 along with the upcoming market trends and opportunities. The report also covers the key strategies adopted by the key players operating in the market.
A. Groupon, Inc., Eventbrite, Zoutons, GrabOn, Virgin Experience Days, Activity Superstore, Buyagift, Red Letter Days, GFM ClearComms, Anschutz Entertainment Group, CL Events, Clarion Events Ltd., DRPG Group, and Entertaining Asia are some of the leading players in the global discount events and experiences industry.
A. The market is segmented on the basis of service type and region. By service type, the market is segmented into driving, food and drink, spa and beauty, tour and travel, sports, sightseeing, theater and events, arts and crafts, and others. Region-wise, the discount events and experiences market is analyzed across North America, Europe, Asia-Pacific, and LAMEA.
A. The demand for the discount events and experiences in Asia-Pacific is expected to grow significantly owing to the rise in participation of people in numerous recreational and leisure activities. The growing disposable income of the consumers due to strong economic growth in the past few years, improving standards of living, growing penetration of internet, rise in adoption of social media, presence of huge number of middle income consumers, and presence of huge number of millennial and Gen Z population are the major factors that are expected to foster the growth of the discount events and experiences market.
A. The global tourism industry has witnessed a significant and rapid downfall during the COVID-19 pandemic and it has become very tough for this sector to grow and stand again. The tour & travel industry is bouncing back to new heights with proper strategies in the market. The need and importance the consumers are feeling to maintain personal time and wellbeing is driving the industry with a faster growth rate.
Start reading instantly.
This Report and over 66,905+ more Reports, Available with Avenue Library. T&C*.
Enterprise
License/PDF
Library
Membership
*Taxes/Fees, if applicable will be added during checkout. All prices in USD
To ensure high-level data integrity, accurate analysis, and impeccable forecasts
For complete satisfaction
On-demand customization of scope of the report to exactly meet your needs
Targeted market view to provide pertinent information and save time of readers
Get insights on topics that are crucial for your business. Stay abreast of your interest areas.
Get Industry Data AlertsTo ensure high-level data integrity, accurate analysis, and impeccable forecasts
For complete satisfaction
On-demand customization of scope of the report to exactly meet your needs
Targeted market view to provide pertinent information and save time of readers