0
2019
Dishwasher Tablets Market

Dishwasher Tablets Market

by Product (Branded and Private Label), End User (Commercial and Residential), and Distribution Channel (Online Sales Channels, Supermarket & Hypermarket, Departmental & Convenience Stores, and Independent Grocery Stores): Global Opportunity Analysis and Industry Forecast, 2019-2026

Report Code: A05812
Nov 2019 | Pages: 245
Tables: 132
Charts: 68
  • Formats*:

  • pdf

    Single User License, Five User
    License & Enterprise User License

  • xls

    Data Pack Excel License

  • ppt

    It comes with the additional cost
    of $2500.00 contact sales.


COVID-19

Pandemic disrupted the entire world and affected many industries.

Get detailed COVID-19 impact analysis on the Dishwasher Tablets Market

Request Now !

Dishwasher Tablets Market Outlook: 2026

The term domestic dishwasher can be used interchangeably with household dishwasher. Dishwasher tablets are sold in two forms, small bricks, which include concentrated dishwashing powder, and dishwashing gel instead of powder. Dishwasher tablets precisely deliver detergent dosages and are less prone to spill over. 
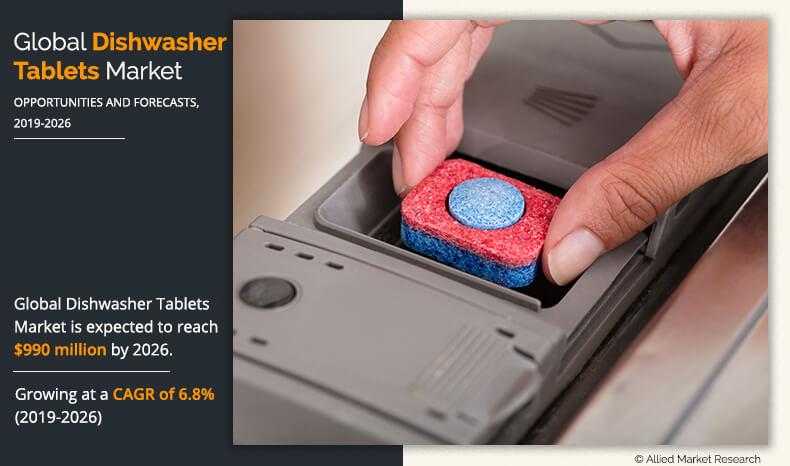
According to AMR, the global dishwasher tablets market size was valued at $596.1 million in 2018, and is anticipated to reach $990 million by 2026, registering a CAGR of 6.8% during the forecast period.

The use of dishwasher tablets eliminates the issue of excess foam generation inside the dishwasher. This further helps users to extend the average service life of their dishwasher, thereby saving the overall maintenance cost.

Dishwasher Tablets Market

Dishwasher tablets are sold through various channels, including online sales channels, supermarket & hypermarket, departmental & convenience stores, independent grocery stores. Thus, the penetration of dishwashers in regions such as North America and Europe is around 50%. Moreover, the consumer base in these regions are well aware about the availability of dishwasher detergents such as liquid, powder, and tablets.

However, the scenario in completely different in the Asian countries such as China and India, where the penetration of dishwasher is limited due to premium pricing as compared to developed regions. On the contrary, companies operating in the Asia region are now focusing more toward designing effective sales channel by offering cross-border sales through e-distribution. Moreover, consumers in Asian regions are now inclined toward the purchases of dishwasher and other white goods, due to upsurge in disposable income and increase in spending on home & hygiene needs. Furthermore, improvement in residential infrastructure such as deployment of effective sanitation systems is expected to boost the revenue growth of dishwasher tablets market.

Dishwasher Tablets Market
By Product Type

Your browser does not support the canvas element.

Branded segment dominates the global dishwasher tablets market and is expected to retain its dominance throughout the forecast period.

Get more information on this report : Request Sample Pages

The price war between global and private label brands in the dishwasher detergent market has triggered the need to introduce differentiated products in the market. For instance, Bosch original dishwasher tablet is a “5-in-1 tab bursts,” which include detergent, salt, rinse-aid, glass protection, and power clean action in one tablet. Majority of the private label brands are competing based on price and supply chain over global brands. Hence, the global brands are introducing innovative product offerings in the dishwasher tablets market. In addition, global brands are adopting various models of distribution channel such as subscription e-commerce and mobile models to penetrate in untapped regions/countries. Moreover, these companies are majorly focusing on offering wide variety of dishwasher tablets due to limited competition by private label brands.

Dishwasher Tablets Market
By End User

Your browser does not support the canvas element.

Residential segment is projected to grow with fastest CAGR during the forecast period

Get more information on this report : Request Sample Pages

Dishwasher tablets are sold in various packages through discount stores, e-commerce, and other retailers. In addition, different sizes of dishwasher tablets packages are offered by manufacturers due to increase in ownership of compact table top dishwashers. Such innovative product offerings in the market by global brands are anticipated to provide lucrative opportunities for market expansion during the forecast period.

The dishwasher detergent market is highly price-sensitive, and only a limited number of customers spend on environmental-friendly products, especially in the European and North American regions. Thus, global brands are constantly focusing on promotional activities to gain green credentials. For example, in the UK, significant amount of product launches in dishwasher tablets market were promoted with the claims of environmentally friendly packaging, which considerably fueled the dishwasher tablet market growth. Thus, extensive focus on adopting recycled packaging and sustainable cleaning logos on product packing is driving the sales dishwasher tablets market.

Dishwasher Tablets Market
By Distribution Channel

Your browser does not support the canvas element.

Online Sales Channels segment is expected to grow at a highest CAGR of 8.6% during the forecast period.

Get more information on this report : Request Sample Pages

Furthermore, increase in environmental awareness among consumers has created the need for green raw materials in the dishwashing detergent market. This is projected to offer new opportunities for companies competing on the basis of environment-friendly detergent products. For example, in 2014, Reckitt Benckiser launched Finish Power & Free, a new line of detergent and rinse product, which is manufactured by using hydrogen peroxide. This product uses limited amount of harsh chemicals, thereby protecting delicate utensils during washing. The product does have chlorine bleach in it, and the use of fragrances and dyes has been reduced significantly.

Regional detergent manufacturers are competing on the basis of price to garner maximum share in global dishwasher tablets market demand. Thus, manufacturers often provide their products at economical pricing, which is one of the major factor influencing consumers’ purchase decision. Low product cost from regional brands is majorly attributed to limited expenditure on channel management, branding, and promotion. Procurement of raw materials from the regional market at much lower price helps them to further reduce the overall cost of production.

Dishwasher Tablets Market
By Region

2026
North America 
Europe
Asia Pacific
LAMEA

North America dominates the Global Dishwasher Tablets market and is expected to grow with a CAGR of 5.5% during the forecast period

Get more information on this report : Request Sample Pages

However, global brands are following product differentiation strategy to penetrate in the market. These brands are continuously focusing on strategies such as product launch, packaging, and usability of sustainable raw materials. However, this has led to increase in the overall price of products for global brands. Furthermore, global brands are facing challenges in terms of product distribution. As a result, these companies are targeting to reduce the overall price of product, which has led to price war between regional brands and global brands. The initiation of such price wars are expected to hamper the overall dishwasher tablets market share and growth.

The global market is segmented into product, end user, distribution channel, and region. On the basis of product, the market is bifurcated into private label dishwasher tablets and branded dishwasher tablets. Depending on end user, the market is categorized into commercial end user and residential end user. By distribution channel, the market is segregated into online sales channels, supermarket and hypermarket, departmental and convenience stores, and independent grocery stores. Region wise, the market is analyzed across North America (U.S., Canada, and Mexico), Europe (Germany, France, Spain, Italy, and rest of Europe), Asia-Pacific (China, India, Japan, Australia, South-East Asia, and rest of Asia-Pacific), and LAMEA (Middle East, Latin America, and Africa).

The key players profiled in global dishwasher tablets industry report include Eurotab, IFB, Reckitt Benckiser, Unilever, LIBY Group, Nopa Nordic A/S, McBride plc, Henkel, Church & Dwight Co., Inc., and Method Products, Pbc.

Key Benefits for Dishwasher Tablets Market:

  • The report provides detailed qualitative and quantitative analysis of the current dishwasher tablets market trends and future estimations that help evaluate the dishwasher tablets market opportunities.
  • The key drivers, restraints, opportunities, and detailed dishwasher tablets market analysis are elucidated in the study.
  • The market analysis is conducted by following key product positioning and monitoring the top competitors within the industry.
  • The report provides extensive qualitative insights on the potential and dishwasher tablets market segments or regions exhibiting favorable growth.
  • Industry player positioning segment facilitates benchmarking and provides a clear understanding of the present position of players along with the dishwasher tablets market forecast.

Dishwasher Tablets Market Report Highlights

Aspects Details
By Product Type
  • Branded
  • Private Label
By End User
  • Commercial
  • Residential
By Distribution Channel
  • Online Sales Channels
  • Supermarket & Hypermarket
  • Departmental & Convenience Stores
  • Independent Grocery Stores
By Region
  • North America  (U.S., Canada, Mexico)
  • Europe  (Germany, UK, France, Italy, Spain, Rest of Europe)
  • Asia-Pacific  (China, India, Japan, Australia, South Korea, Rest of APAC)
  • LAMEA  (Middle East, Latin America, Africa)
Key Market Players Henkel, Method products, pbc, LIBY Group, Reckitt Benckiser, IFB, Nopa Nordic A/S, Unilever, Eurotab, McBride plc., Church & Dwight Co., Inc.
 

CHAPTER 1:    INTRODUCTION

1.1.    Key benefits for stakeholders
1.2.    Key market segments
1.3.    Research methodology

1.3.1.    Secondary research
1.3.2.    Primary research
1.3.3.    Analyst tools and models

CHAPTER 2:    EXECUTIVE SUMMARY

2.1.    CXO perspective

CHAPTER 3:    MARKET OVERVIEW

3.1.    Market definition and scope
3.2.    Parent Market Overview: Global Dishwasher Detergent Market (2018)
3.3.    Key findings

3.3.1.    Top investment pockets
3.3.2.    Value chain analysis

3.4.    Porter’s five forces analysis

3.4.1.    Moderate Bargaining Power of Suppliers
3.4.2.    High Bargaining Power of Buyers
3.4.3.    Moderate Threat of Substitution
3.4.4.    High Threat of New Entrants
3.4.5.    Moderate Bargaining Power of Suppliers

3.5.    Market positioning, 2015
3.6.    Market dynamics

3.6.1.    Drivers

3.6.1.1.    Adoption of Compact Dishwasher
3.6.1.2.    Innovative product offerings
3.6.1.3.    Reduced environmental impacts

3.6.2.    Restraint

3.6.2.1.    Strong Competition pressuring detergent prices
3.6.2.2.    Availability of alternatives

3.6.3.    Opportunities

3.6.3.1.    Purchasing of table top dishwasher across India and China

CHAPTER 4:    DISHWASHER TABLETS MARKET, BY PRODUCT TYPE

4.1.    Overview

4.1.1.    Market size and forecast

4.2.    Private Label

4.2.1.    Key market trends, growth factors and opportunities
4.2.2.    Market size and forecast

4.3.    Branded

4.3.1.    Key market trends, growth factors and opportunities
4.3.2.    Market size and forecast

CHAPTER 5:    DISHWASHER TABLETS MARKET, BY END USER

5.1.    Overview

5.1.1.    Market size and forecast

5.2.    Commercial

5.2.1.    Key market trends, growth factors and opportunities
5.2.2.    Market size and forecast

5.3.    Residential

5.3.1.    Key market trends, growth factors and opportunities
5.3.2.    Market size and forecast

CHAPTER 6:    DISHWASHER TABLETS MARKET, BY DISTRIBUTION CHANNEL

6.1.    Overview

6.1.1.    Market size and forecast

6.2.    Online Sales Channels

6.2.1.    Key market trends, growth factors and opportunities
6.2.2.    Market size and forecast

6.3.    Supermarket and Hypermarket

6.3.1.    Key market trends, growth factors and opportunities
6.3.2.    Market size and forecast

6.4.    Departmental and Convenience stores

6.4.1.    Key market trends, growth factors and opportunities
6.4.2.    Market size and forecast

6.5.    Independent Grocery Stores

6.5.1.    Key market trends, growth factors and opportunities
6.5.2.    Market size and forecast

CHAPTER 7:    DISHWASHER TABLETS MARKET BY REGION

7.1.    Overview

7.1.1.    Market size and forecast, by region

7.2.    North America

7.2.1.    Key market trends, growth factors and opportunities
7.2.2.    Market size and forecast, by product type
7.2.3.    Market size and forecast, by end user
7.2.4.    Market size and forecast, by distribution channel
7.2.5.    Market size and forecast, by country

7.2.5.1.    United States

7.2.5.1.1.    Market size and forecast by Product Type
7.2.5.1.2.    Market size and forecast by End User
7.2.5.1.3.    Market size and forecast by Distribution Channel

7.2.5.2.    Canada

7.2.5.2.1.    Market size and forecast by Product Type
7.2.5.2.2.    Market size and forecast by End User
7.2.5.2.3.    Market size and forecast by Distribution Channel

7.2.5.3.    Mexico

7.2.5.3.1.    Market size and forecast by Product Type
7.2.5.3.2.    Market size and forecast by End User
7.2.5.3.3.    Market size and forecast by Distribution Channel

7.3.    Europe

7.3.1.    Key market trends, growth factors and opportunities
7.3.2.    Market size and forecast, by product type
7.3.3.    Market size and forecast, by end user
7.3.4.    Market size and forecast, by distribution channel
7.3.5.    Market size and forecast, by country

7.3.5.1.    Germany

7.3.5.1.1.    Market size and forecast by Product Type
7.3.5.1.2.    Market size and forecast by End User
7.3.5.1.3.    Market size and forecast by Distribution Channel

7.3.5.2.    UK

7.3.5.2.1.    Market size and forecast by Product Type
7.3.5.2.2.    Market size and forecast by End User
7.3.5.2.3.    Market size and forecast by Distribution Channel

7.3.5.3.    France

7.3.5.3.1.    Market size and forecast by Product Type
7.3.5.3.2.    Market size and forecast by End User
7.3.5.3.3.    Market size and forecast by Distribution Channel

7.3.5.4.    Italy

7.3.5.4.1.    Market size and forecast by Product Type
7.3.5.4.2.    Market size and forecast by End User
7.3.5.4.3.    Market size and forecast by Distribution Channel

7.3.5.5.    Spain

7.3.5.5.1.    Market size and forecast by Product Type
7.3.5.5.2.    Market size and forecast by End User
7.3.5.5.3.    Market size and forecast by Distribution Channel

7.3.5.6.    Rest of Europe

7.3.5.6.1.    Market size and forecast by Product Type
7.3.5.6.2.    Market size and forecast by End User
7.3.5.6.3.    Market size and forecast by Distribution Channel

7.4.    Asia-Pacific

7.4.1.    Key market trends, growth factors and opportunities
7.4.2.    Market size and forecast, by product type
7.4.3.    Market size and forecast, by end user
7.4.4.    Market size and forecast, by distribution channel
7.4.5.    Market size and forecast, by country

7.4.5.1.    China

7.4.5.1.1.    Market size and forecast by Product Type
7.4.5.1.2.    Market size and forecast by End User
7.4.5.1.3.    Market size and forecast by Distribution Channel

7.4.5.2.    India

7.4.5.2.1.    Market size and forecast by Product Type
7.4.5.2.2.    Market size and forecast by End User
7.4.5.2.3.    Market size and forecast by Distribution Channel

7.4.5.3.    Japan

7.4.5.3.1.    Market size and forecast by Product Type
7.4.5.3.2.    Market size and forecast by End User
7.4.5.3.3.    Market size and forecast by Distribution Channel

7.4.5.4.    Australia

7.4.5.4.1.    Market size and forecast by Product Type
7.4.5.4.2.    Market size and forecast by End User
7.4.5.4.3.    Market size and forecast by Distribution Channel

7.4.5.5.    South Korea

7.4.5.5.1.    Market size and forecast by Product Type
7.4.5.5.2.    Market size and forecast by End User
7.4.5.5.3.    Market size and forecast by Distribution Channel

7.4.5.6.    Rest of APAC

7.4.5.6.1.    Market size and forecast by Product Type
7.4.5.6.2.    Market size and forecast by End User
7.4.5.6.3.    Market size and forecast by Distribution Channel

7.5.    LAMEA

7.5.1.    Key market trends, growth factors and opportunities
7.5.2.    Market size and forecast, by product type
7.5.3.    Market size and forecast, by end user
7.5.4.    Market size and forecast, by distribution channel
7.5.5.    Market size and forecast, by country

7.5.5.1.    Latin America

7.5.5.1.1.    Market size and forecast by Product Type
7.5.5.1.2.    Market size and forecast by End User
7.5.5.1.3.    Market size and forecast by Distribution Channel

7.5.5.2.    Middle East

7.5.5.2.1.    Market size and forecast by Product Type
7.5.5.2.2.    Market size and forecast by End User
7.5.5.2.3.    Market size and forecast by Distribution Channel

7.5.5.3.    Africa

7.5.5.3.1.    Market size and forecast by Product Type
7.5.5.3.2.    Market size and forecast by End User
7.5.5.3.3.    Market size and forecast by Distribution Channel

CHAPTER 8:    COMPANY PROFILES

8.1.    Eurotab

8.1.1.    Company overview
8.1.2.    Key Executive
8.1.3.    Company snapshot
8.1.4.    Operating business segments
8.1.5.    Product portfolio
8.1.6.    Business performance
8.1.7.    Key strategic moves and developments

8.2.    IFB

8.2.1.    Company overview
8.2.2.    Key Executive
8.2.3.    Company snapshot
8.2.4.    Operating business segments
8.2.5.    Product portfolio
8.2.6.    Business performance
8.2.7.    Key strategic moves and developments

8.3.    Reckitt Benckiser

8.3.1.    Company overview
8.3.2.    Key Executive
8.3.3.    Company snapshot
8.3.4.    Operating business segments
8.3.5.    Product portfolio
8.3.6.    Business performance
8.3.7.    Key strategic moves and developments

8.4.    Method products, pbc

8.4.1.    Company overview
8.4.2.    Key Executive
8.4.3.    Company snapshot
8.4.4.    Operating business segments
8.4.5.    Product portfolio
8.4.6.    Business performance
8.4.7.    Key strategic moves and developments

8.5.    Church & Dwight Co., Inc.

8.5.1.    Company overview
8.5.2.    Key Executive
8.5.3.    Company snapshot
8.5.4.    Operating business segments
8.5.5.    Product portfolio
8.5.6.    Business performance
8.5.7.    Key strategic moves and developments

8.6.    Nopa Nordic A/S

8.6.1.    Company overview
8.6.2.    Key Executive
8.6.3.    Company snapshot
8.6.4.    Operating business segments
8.6.5.    Product portfolio
8.6.6.    Business performance
8.6.7.    Key strategic moves and developments

8.7.    McBride plc.

8.7.1.    Company overview
8.7.2.    Key Executive
8.7.3.    Company snapshot
8.7.4.    Operating business segments
8.7.5.    Product portfolio
8.7.6.    Business performance
8.7.7.    Key strategic moves and developments

8.8.    Henkel

8.8.1.    Company overview
8.8.2.    Key Executive
8.8.3.    Company snapshot
8.8.4.    Operating business segments
8.8.5.    Product portfolio
8.8.6.    Business performance
8.8.7.    Key strategic moves and developments

8.9.    Unilever

8.9.1.    Company overview
8.9.2.    Key Executive
8.9.3.    Company snapshot
8.9.4.    Operating business segments
8.9.5.    Product portfolio
8.9.6.    Business performance
8.9.7.    Key strategic moves and developments

8.10.    LIBY Group

8.10.1.    Company overview
8.10.2.    Key Executive
8.10.3.    Company snapshot
8.10.4.    Operating business segments
8.10.5.    Product portfolio
8.10.6.    Business performance
8.10.7.    Key strategic moves and developments

8.11.    DISCLAIMER

LIST OF TABLES

TABLE 01.    GLOBAL DISHWASHER TABLETS MARKET REVENUE, BY PRODUCT TYPE, 2018–2026 ($MILLION)
TABLE 02.    GLOBAL PRIVATE LABEL DISHWASHER TABLETS MARKET REVENUE, BY REGION, 2018–2026 ($MILLION)
TABLE 03.    GLOBAL BRANDED DISHWASHER TABLETS MARKET REVENUE, BY REGION, 2018–2026 ($MILLION)
TABLE 04.    GLOBAL DISHWASHER TABLETS MARKET REVENUE, BY END USER 2018–2026 ($MILLION)
TABLE 05.    GLOBAL COMMERCIAL DISHWASHER TABLETS MARKET REVENUE, BY REGION, 2018–2026 ($MILLION)
TABLE 06.    GLOBAL RESIDENTIAL DISHWASHER TABLETS MARKET REVENUE, BY REGION, 2018–2026 ($MILLION)
TABLE 07.    GLOBAL DISHWASHER TABLETS MARKET REVENUE, BY DISTRIBUTION CHANNEL 2018–2026 ($MILLION)
TABLE 08.    GLOBAL ONLINE SALES CHANNELS DISHWASHER TABLETS MARKET REVENUE, BY REGION, 2018–2026 ($MILLION)
TABLE 09.    GLOBAL SUPERMARKET AND HYPERMARKET DISHWASHER TABLETS PRODUCTS MARKET REVENUE, BY REGION, 2018–2026 ($MILLION)
TABLE 10.    GLOBAL DEPARTMENTAL AND CONVENIENCE STORES DISHWASHER TABLETS PRODUCTS MARKET REVENUE, BY REGION, 2018–2026 ($MILLION)
TABLE 11.    GLOBAL INDEPENDENT GROCERY STORES DISHWASHER TABLETS PRODUCTS MARKET REVENUE, BY REGION, 2018–2026 ($MILLION)
TABLE 12.    GLOBAL DISHWASHER TABLETS MARKET REVENUE, BY REGION, 2018–2026 ($MILLION)
TABLE 13.    NORTH AMERICA DISHWASHER TABLETS MARKET REVENUE, BY PRODUCT TYPE, 2018–2026 ($MILLION)
TABLE 14.    NORTH AMERICA DISHWASHER TABLETS MARKET REVENUE, BY END USER, 2018–2026 ($MILLION)
TABLE 15.    NORTH AMERICA DISHWASHER TABLETS MARKET REVENUE, BY DISTRIBUTION CHANNEL, 2018–2026 ($MILLION)
TABLE 16.    NORTH AMERICA DISHWASHER TABLETS MARKET REVENUE, BY COUNTRY, 2018–2026 ($MILLION)
TABLE 17.    UNITED STATES DISHWASHER TABLETS MARKET REVENUE, BY PRODUCT TYPE, 2018–2026 ($MILLION)
TABLE 18.    UNITED STATES DISHWASHER TABLETS MARKET REVENUE, BY END USER, 2018–2026 ($MILLION)
TABLE 19.    UNITED STATES DISHWASHER TABLETS MARKET REVENUE, BY DISTRIBUTION CHANNEL, 2018–2026 ($MILLION)
TABLE 20.    CANADA DISHWASHER TABLETS MARKET REVENUE, BY PRODUCT TYPE, 2018–2026 ($MILLION)
TABLE 21.    CANADA DISHWASHER TABLETS MARKET REVENUE, BY END USER, 2018–2026 ($MILLION)
TABLE 22.    CANADA DISHWASHER TABLETS MARKET REVENUE, BY DISTRIBUTION CHANNEL, 2018–2026 ($MILLION)
TABLE 23.    MEXICO DISHWASHER TABLETS MARKET REVENUE, BY PRODUCT TYPE, 2018–2026 ($MILLION)
TABLE 24.    MEXICO DISHWASHER TABLETS MARKET REVENUE, BY END USER, 2018–2026 ($MILLION)
TABLE 25.    MEXICO DISHWASHER TABLETS MARKET REVENUE, BY DISTRIBUTION CHANNEL, 2018–2026 ($MILLION)
TABLE 26.    EUROPE DISHWASHER TABLETS MARKET REVENUE, BY PRODUCT TYPE, 2018–2026 ($MILLION)
TABLE 27.    EUROPE DISHWASHER TABLETS MARKET REVENUE, BY END USER, 2018–2026 ($MILLION)
TABLE 28.    EUROPE DISHWASHER TABLETS MARKET REVENUE, BY DISTRIBUTION CHANNEL, 2018–2026 ($MILLION)
TABLE 29.    EUROPE DISHWASHER TABLETS MARKET REVENUE, BY COUNTRY, 2018–2026 ($MILLION)
TABLE 30.    GERMANY DISHWASHER TABLETS MARKET REVENUE, BY PRODUCT TYPE, 2018–2026 ($MILLION)
TABLE 31.    GERMANY DISHWASHER TABLETS MARKET REVENUE, BY END USER, 2018–2026 ($MILLION)
TABLE 32.    GERMANY DISHWASHER TABLETS MARKET REVENUE, BY DISTRIBUTION CHANNEL, 2018–2026 ($MILLION)
TABLE 33.    UK DISHWASHER TABLETS MARKET REVENUE, BY PRODUCT TYPE, 2018–2026 ($MILLION)
TABLE 34.    UK DISHWASHER TABLETS MARKET REVENUE, BY END USER, 2018–2026 ($MILLION)
TABLE 35.    UK DISHWASHER TABLETS MARKET REVENUE, BY DISTRIBUTION CHANNEL, 2018–2026 ($MILLION)
TABLE 36.    FRANCE DISHWASHER TABLETS MARKET REVENUE, BY PRODUCT TYPE, 2018–2026 ($MILLION)
TABLE 37.    FRANCE DISHWASHER TABLETS MARKET REVENUE, BY END USER, 2018–2026 ($MILLION)
TABLE 38.    FRANCE DISHWASHER TABLETS MARKET REVENUE, BY DISTRIBUTION CHANNEL, 2018–2026 ($MILLION)
TABLE 39.    ITALY DISHWASHER TABLETS MARKET REVENUE, BY PRODUCT TYPE, 2018–2026 ($MILLION)
TABLE 40.    ITALY DISHWASHER TABLETS MARKET REVENUE, BY END USER, 2018–2026 ($MILLION)
TABLE 41.    ITALY DISHWASHER TABLETS MARKET REVENUE, BY DISTRIBUTION CHANNEL, 2018–2026 ($MILLION)
TABLE 42.    SPAIN DISHWASHER TABLETS MARKET REVENUE, BY PRODUCT TYPE, 2018–2026 ($MILLION)
TABLE 43.    SPAIN DISHWASHER TABLETS MARKET REVENUE, BY END USER, 2018–2026 ($MILLION)
TABLE 44.    SPAIN DISHWASHER TABLETS MARKET REVENUE, BY DISTRIBUTION CHANNEL, 2018–2026 ($MILLION)
TABLE 45.    REST OF EUROPE DISHWASHER TABLETS MARKET REVENUE, BY PRODUCT TYPE, 2018–2026 ($MILLION)
TABLE 46.    REST OF EUROPE DISHWASHER TABLETS MARKET REVENUE, BY END USER, 2018–2026 ($MILLION)
TABLE 47.    REST OF EUROPE DISHWASHER TABLETS MARKET REVENUE, BY DISTRIBUTION CHANNEL, 2018–2026 ($MILLION)
TABLE 48.    ASIA-PACIFIC DISHWASHER TABLETS MARKET REVENUE, BY PRODUCT TYPE, 2018–2026 ($MILLION)
TABLE 49.    ASIA-PACIFIC DISHWASHER TABLETS MARKET REVENUE, BY END USER, 2018–2026 ($MILLION)
TABLE 50.    ASIA-PACIFIC DISHWASHER TABLETS MARKET REVENUE, BY DISTRIBUTION CHANNEL, 2018–2026 ($MILLION)
TABLE 51.    ASIA-PACIFIC DISHWASHER TABLETS MARKET REVENUE, BY COUNTRY, 2018–2026 ($MILLION)
TABLE 52.    CHINA DISHWASHER TABLETS MARKET REVENUE, BY PRODUCT TYPE, 2018–2026 ($MILLION)
TABLE 53.    CHINA DISHWASHER TABLETS MARKET REVENUE, BY END USER, 2018–2026 ($MILLION)
TABLE 54.    CHINA DISHWASHER TABLETS MARKET REVENUE, BY DISTRIBUTION CHANNEL, 2018–2026 ($MILLION)
TABLE 55.    INDIA DISHWASHER TABLETS MARKET REVENUE, BY PRODUCT TYPE, 2018–2026 ($MILLION)
TABLE 56.    INDIA DISHWASHER TABLETS MARKET REVENUE, BY END USER, 2018–2026 ($MILLION)
TABLE 57.    INDIA DISHWASHER TABLETS MARKET REVENUE, BY DISTRIBUTION CHANNEL, 2018–2026 ($MILLION)
TABLE 58.    JAPAN DISHWASHER TABLETS MARKET REVENUE, BY PRODUCT TYPE, 2018–2026 ($MILLION)
TABLE 59.    JAPAN DISHWASHER TABLETS MARKET REVENUE, BY END USER, 2018–2026 ($MILLION)
TABLE 60.    JAPAN DISHWASHER TABLETS MARKET REVENUE, BY DISTRIBUTION CHANNEL, 2018–2026 ($MILLION)
TABLE 61.    AUSTRALIA DISHWASHER TABLETS MARKET REVENUE, BY PRODUCT TYPE, 2018–2026 ($MILLION)
TABLE 62.    AUSTRALIA DISHWASHER TABLETS MARKET REVENUE, BY END USER, 2018–2026 ($MILLION)
TABLE 63.    AUSTRALIA DISHWASHER TABLETS MARKET REVENUE, BY DISTRIBUTION CHANNEL, 2018–2026 ($MILLION)
TABLE 64.    SOUTH KOREA DISHWASHER TABLETS MARKET REVENUE, BY PRODUCT TYPE, 2018–2026 ($MILLION)
TABLE 65.    SOUTH KOREA DISHWASHER TABLETS MARKET REVENUE, BY END USER, 2018–2026 ($MILLION)
TABLE 66.    SOUTH KOREA DISHWASHER TABLETS MARKET REVENUE, BY DISTRIBUTION CHANNEL, 2018–2026 ($MILLION)
TABLE 67.    REST OF APAC DISHWASHER TABLETS MARKET REVENUE, BY PRODUCT TYPE, 2018–2026 ($MILLION)
TABLE 68.    REST OF APAC DISHWASHER TABLETS MARKET REVENUE, BY END USER, 2018–2026 ($MILLION)
TABLE 69.    REST OF APAC DISHWASHER TABLETS MARKET REVENUE, BY DISTRIBUTION CHANNEL, 2018–2026 ($MILLION)
TABLE 70.    LAMEA DISHWASHER TABLETS MARKET REVENUE, BY PRODUCT TYPE, 2018–2026 ($MILLION)
TABLE 71.    LAMEA DISHWASHER TABLETS MARKET REVENUE, BY END USER, 2018–2026 ($MILLION)
TABLE 72.    LAMEA DISHWASHER TABLETS MARKET REVENUE, BY DISTRIBUTION CHANNEL, 2018–2026 ($MILLION)
TABLE 73.    LAMEA DISHWASHER TABLETS MARKET REVENUE, BY COUNTRY, 2018–2026 ($MILLION)
TABLE 74.    LATIN AMERICA DISHWASHER TABLETS MARKET REVENUE, BY PRODUCT TYPE, 2018–2026 ($MILLION)
TABLE 75.    LATIN AMERICA DISHWASHER TABLETS MARKET REVENUE, BY END USER, 2018–2026 ($MILLION)
TABLE 76.    LATIN AMERICA DISHWASHER TABLETS MARKET REVENUE, BY DISTRIBUTION CHANNEL, 2018–2026 ($MILLION)
TABLE 77.    MIDDLE EAST DISHWASHER TABLETS MARKET REVENUE, BY PRODUCT TYPE, 2018–2026 ($MILLION)
TABLE 78.    MIDDLE EAST DISHWASHER TABLETS MARKET REVENUE, BY END USER, 2018–2026 ($MILLION)
TABLE 79.    MIDDLE EAST DISHWASHER TABLETS MARKET REVENUE, BY DISTRIBUTION CHANNEL, 2018–2026 ($MILLION)
TABLE 80.    AFRICA DISHWASHER TABLETS MARKET REVENUE, BY PRODUCT TYPE, 2018–2026 ($MILLION)
TABLE 81.    AFRICA DISHWASHER TABLETS MARKET REVENUE, BY END USER, 2018–2026 ($MILLION)
TABLE 82.    AFRICA DISHWASHER TABLETS MARKET REVENUE, BY DISTRIBUTION CHANNEL, 2018–2026 ($MILLION)
TABLE 83.    EUROTAB: KEY EXECUTIVES
TABLE 84.    EUROTAB: COMPANY SNAPSHOT
TABLE 85.    EUROTAB: OPERATING SEGMENTS
TABLE 86.    EUROTAB: PRODUCT PORTFOLIO
TABLE 87.    EUROTAB: NET SALES, 2016–2018 ($MILLION)
TABLE 88.    IFB: KEY EXECUTIVES
TABLE 89.    IFB: COMPANY SNAPSHOT
TABLE 90.    IFB: OPERATING SEGMENTS
TABLE 91.    IFB: PRODUCT PORTFOLIO
TABLE 92.    IFB: NET SALES, 2016–2018 ($MILLION)
TABLE 93.    RECKITT BENCKISER: KEY EXECUTIVES
TABLE 94.    RECKITT BENCKISER: COMPANY SNAPSHOT
TABLE 95.    RECKITT BENCKISER: OPERATING SEGMENTS
TABLE 96.    RECKITT BENCKISER: PRODUCT PORTFOLIO
TABLE 97.    RECKITT BENCKISER: NET SALES, 2016–2018 ($MILLION)
TABLE 98.    METHOD PRODUCTS, PBC: KEY EXECUTIVES
TABLE 99.    METHOD PRODUCTS, PBC: COMPANY SNAPSHOT
TABLE 100.    METHOD PRODUCTS, PBC: OPERATING SEGMENTS
TABLE 101.    METHOD PRODUCTS, PBC: PRODUCT PORTFOLIO
TABLE 102.    METHOD PRODUCTS, PBC: NET SALES, 2016–2018 ($MILLION)
TABLE 103.    CHURCH & DWIGHT CO., INC.: KEY EXECUTIVES
TABLE 104.    CHURCH & DWIGHT CO., INC.: COMPANY SNAPSHOT
TABLE 105.    CHURCH & DWIGHT CO., INC.: OPERATING SEGMENTS
TABLE 106.    CHURCH & DWIGHT CO., INC.: PRODUCT PORTFOLIO
TABLE 107.    CHURCH & DWIGHT CO., INC.: NET SALES, 2016–2018 ($MILLION)
TABLE 108.    NOPA NORDIC A/S: KEY EXECUTIVES
TABLE 109.    NOPA NORDIC A/S: COMPANY SNAPSHOT
TABLE 110.    NOPA NORDIC A/S: OPERATING SEGMENTS
TABLE 111.    NOPA NORDIC A/S: PRODUCT PORTFOLIO
TABLE 112.    NOPA NORDIC A/S: NET SALES, 2016–2018 ($MILLION)
TABLE 113.    MCBRIDE PLC.: KEY EXECUTIVES
TABLE 114.    MCBRIDE PLC.: COMPANY SNAPSHOT
TABLE 115.    MCBRIDE PLC.: OPERATING SEGMENTS
TABLE 116.    MCBRIDE PLC.: PRODUCT PORTFOLIO
TABLE 117.    MCBRIDE PLC.: NET SALES, 2016–2018 ($MILLION)
TABLE 118.    HENKEL: KEY EXECUTIVES
TABLE 119.    HENKEL: COMPANY SNAPSHOT
TABLE 120.    HENKEL: OPERATING SEGMENTS
TABLE 121.    HENKEL: PRODUCT PORTFOLIO
TABLE 122.    HENKEL: NET SALES, 2016–2018 ($MILLION)
TABLE 123.    UNILEVER: KEY EXECUTIVES
TABLE 124.    UNILEVER: COMPANY SNAPSHOT
TABLE 125.    UNILEVER: OPERATING SEGMENTS
TABLE 126.    UNILEVER: PRODUCT PORTFOLIO
TABLE 127.    UNILEVER: NET SALES, 2016–2018 ($MILLION)
TABLE 128.    LIBY GROUP: KEY EXECUTIVES
TABLE 129.    LIBY GROUP: COMPANY SNAPSHOT
TABLE 130.    LIBY GROUP: OPERATING SEGMENTS
TABLE 131.    LIBY GROUP: PRODUCT PORTFOLIO
TABLE 132.    LIBY GROUP: NET SALES, 2016–2018 ($MILLION)

LIST OF FIGURES

FIGURE 01.    DISHWASHER TABLETS MARKET: SNAPSHOT
FIGURE 02.    DISHWASHER TABLETS MARKET: SEGMENTATION
FIGURE 03.    PARENT MARKET OVERVIEW: GLOBAL DISHWASHER DETERGENT MARKET (2018)
FIGURE 04.    TOP INVESTMENT POCKETS
FIGURE 05.    VALUE CHAIN ANALYSIS
FIGURE 06.    DISHWASHER TABLETS MARKET: PORTER’S FIVE FORCES MODEL
FIGURE 07.    MARKET POSITIONING, 2015
FIGURE 08.    DISHWASHER TABLETS MARKET: DRIVERS, RESTRAINTS, AND OPPORTUNITIES
FIGURE 09.    DISHWASHER TABLETS MARKET, BY PRODUCT TYPE, 2019 (%)
FIGURE 10.    GLOBAL PRIVATE LABEL DISHWASHER TABLETS MARKET, COMPARATIVE COUNTRY MARKET SHARE ANALYSIS, 2018 AND 2026 (%)
FIGURE 11.    GLOBAL BRANDED DISHWASHER TABLETS MARKET, COMPARATIVE REGIONAL MARKET SHARE ANALYSIS, 2018 AND 2026 (%)
FIGURE 12.    GLOBAL DISHWASHER TABLETS MARKET, BY END USER, 2019 (%)
FIGURE 13.    GLOBAL COMMERCIAL DISHWASHER TABLETS MARKET, COMPARATIVE REGIONAL MARKET SHARE ANALYSIS, 2018 AND 2026 (%)
FIGURE 14.    GLOBAL RESIDENTIAL DISHWASHER TABLETS MARKET, COMPARATIVE REGIONAL MARKET SHARE ANALYSIS, 2018 AND 2026 (%)
FIGURE 15.    GLOBAL DISHWASHER TABLETS MARKET, BY DISTRIBUTION CHANNEL, 2019 (%)
FIGURE 16.    GLOBAL ONLINE SALES CHANNELS DISHWASHER TABLETS MARKET, COMPARATIVE COUNTRY MARKET SHARE ANALYSIS, 2018 AND 2026 (%)
FIGURE 17.    GLOBAL SUPERMARKET AND HYPERMARKET DISHWASHER TABLETS MARKET, COMPARATIVE REGIONAL MARKET SHARE ANALYSIS, 2018 AND 2026 (%)
FIGURE 18.    GLOBAL DEPARTMENTAL AND CONVENIENCE STORES DISHWASHER TABLETS MARKET, COMPARATIVE REGIONAL MARKET SHARE ANALYSIS, 2018 AND 2026 (%)
FIGURE 19.    GLOBAL INDEPENDENT GROCERY STORES DISHWASHER TABLETS MARKET, COMPARATIVE REGIONAL MARKET SHARE ANALYSIS, 2018 AND 2026 (%)
FIGURE 20.    DISHWASHER TABLETS MARKET, BY REGION, 2019 (%)
FIGURE 21.    UNITED STATES DISHWASHER TABLETS MARKET REVENUE, 2018–2026 ($MILLION)
FIGURE 22.    CANADA DISHWASHER TABLETS MARKET REVENUE, 2018–2026 ($MILLION)
FIGURE 23.    MEXICO DISHWASHER TABLETS MARKET REVENUE, 2018–2026 ($MILLION)
FIGURE 24.    GERMANY DISHWASHER TABLETS MARKET REVENUE, 2018–2026 ($MILLION)
FIGURE 25.    UK DISHWASHER TABLETS MARKET REVENUE, 2018–2026 ($MILLION)
FIGURE 26.    FRANCE DISHWASHER TABLETS MARKET REVENUE, 2018–2026 ($MILLION)
FIGURE 27.    ITALY DISHWASHER TABLETS MARKET REVENUE, 2018–2026 ($MILLION)
FIGURE 28.    SPAIN DISHWASHER TABLETS MARKET REVENUE, 2018–2026 ($MILLION)
FIGURE 29.    REST OF EUROPE DISHWASHER TABLETS MARKET REVENUE, 2018–2026 ($MILLION)
FIGURE 30.    CHINA DISHWASHER TABLETS MARKET REVENUE, 2018–2026 ($MILLION)
FIGURE 31.    INDIA DISHWASHER TABLETS MARKET REVENUE, 2018–2026 ($MILLION)
FIGURE 32.    JAPAN DISHWASHER TABLETS MARKET REVENUE, 2018–2026 ($MILLION)
FIGURE 33.    AUSTRALIA DISHWASHER TABLETS MARKET REVENUE, 2018–2026 ($MILLION)
FIGURE 34.    SOUTH KOREA DISHWASHER TABLETS MARKET REVENUE, 2018–2026 ($MILLION)
FIGURE 35.    REST OF APAC DISHWASHER TABLETS MARKET REVENUE, 2018–2026 ($MILLION)
FIGURE 36.    LATIN AMERICA DISHWASHER TABLETS MARKET REVENUE, 2018–2026 ($MILLION)
FIGURE 37.    MIDDLE EAST DISHWASHER TABLETS MARKET REVENUE, 2018–2026 ($MILLION)
FIGURE 38.    AFRICA DISHWASHER TABLETS MARKET REVENUE, 2018–2026 ($MILLION)
FIGURE 39.    EUROTAB: NET SALES, 2016–2018 ($MILLION)
FIGURE 40.    EUROTAB: REVENUE SHARE BY SEGMENT, 2018 (%)
FIGURE 41.    EUROTAB: REVENUE SHARE BY REGION, 2018 (%)
FIGURE 42.    IFB: NET SALES, 2016–2018 ($MILLION)
FIGURE 43.    IFB: REVENUE SHARE BY SEGMENT, 2018 (%)
FIGURE 44.    IFB: REVENUE SHARE BY REGION, 2018 (%)
FIGURE 45.    RECKITT BENCKISER: NET SALES, 2016–2018 ($MILLION)
FIGURE 46.    RECKITT BENCKISER: REVENUE SHARE BY SEGMENT, 2018 (%)
FIGURE 47.    RECKITT BENCKISER: REVENUE SHARE BY REGION, 2018 (%)
FIGURE 48.    METHOD PRODUCTS, PBC: NET SALES, 2016–2018 ($MILLION)
FIGURE 49.    METHOD PRODUCTS, PBC: REVENUE SHARE BY SEGMENT, 2018 (%)
FIGURE 50.    METHOD PRODUCTS, PBC: REVENUE SHARE BY REGION, 2018 (%)
FIGURE 51.    CHURCH & DWIGHT CO., INC.: NET SALES, 2016–2018 ($MILLION)
FIGURE 52.    CHURCH & DWIGHT CO., INC.: REVENUE SHARE BY SEGMENT, 2018 (%)
FIGURE 53.    CHURCH & DWIGHT CO., INC.: REVENUE SHARE BY REGION, 2018 (%)
FIGURE 54.    NOPA NORDIC A/S: NET SALES, 2016–2018 ($MILLION)
FIGURE 55.    NOPA NORDIC A/S: REVENUE SHARE BY SEGMENT, 2018 (%)
FIGURE 56.    NOPA NORDIC A/S: REVENUE SHARE BY REGION, 2018 (%)
FIGURE 57.    MCBRIDE PLC.: NET SALES, 2016–2018 ($MILLION)
FIGURE 58.    MCBRIDE PLC.: REVENUE SHARE BY SEGMENT, 2018 (%)
FIGURE 59.    MCBRIDE PLC.: REVENUE SHARE BY REGION, 2018 (%)
FIGURE 60.    HENKEL: NET SALES, 2016–2018 ($MILLION)
FIGURE 61.    HENKEL: REVENUE SHARE BY SEGMENT, 2018 (%)
FIGURE 62.    HENKEL: REVENUE SHARE BY REGION, 2018 (%)
FIGURE 63.    UNILEVER: NET SALES, 2016–2018 ($MILLION)
FIGURE 64.    UNILEVER: REVENUE SHARE BY SEGMENT, 2018 (%)
FIGURE 65.    UNILEVER: REVENUE SHARE BY REGION, 2018 (%)
FIGURE 66.    LIBY GROUP: NET SALES, 2016–2018 ($MILLION)
FIGURE 67.    LIBY GROUP: REVENUE SHARE BY SEGMENT, 2018 (%)
FIGURE 68.    LIBY GROUP: REVENUE SHARE BY REGION, 2018 (%)


The dishwasher tablet market is expected to witness significant growth, owing to increase in sales of dishwasher tablets in European and North American regions. Furthermore, customers are inclined toward purchasing innovative products instead of traditional products, which promotes manufacturers to develop more advanced and cost-effective solution for their daily needs. This has resulted into continuous improvement in dishwasher tablet offerings by the leading brands such as Eurotab, IFB, Reckitt Benckiser, Unilever, and LIBY Group.

In addition, companies are focusing on strengthening their distribution network across Asia and LAMEA. The prime reason behind these geographical expansion is increase in installations of table top/counter top dishwashers. End user from Asian countries are seeking for more user-friendly and economic dishwashers. Thus, increase in adoption of counter top dishwashers is Asian countries directly influences the overall demand for auxiliary products such as detergents. Moreover, upsurge in disposable income and increase in popularity of connected kitchen appliances are anticipated to enhance the revenue opportunity for dishwasher equipment and auxiliary products manufacturer.

PURCHASE OPTIONS

Call or Email us

U.S.-Canada Toll-free: +1-800-792-5285
Int'l : +1-503-894-6022
Europe : +44-845-528-1300
Email : help@alliedmarketresearch.com

Looking for Customization?

 Customization Request

Have a Question?

 Speak with Analyst

Any Confusion?

 Inquire Before Buying

Have a glance of the Report

  Request Sample
RELATED TAGS

Purchase Full Report of
Dishwasher Tablets Market

Start reading instantly.
This Report and over 66,905+ more Reports, Available with Avenue Library. T&C*.

  • Online Only
  • $3,456
  • Online cloud access only
  • Restricted print, copy, paste & download
  • Read only
  • Free industry update
    (Within 180 days)
  • Free report update in next update cycle
    (Nov 2020 - Nov 2021)
  • Data Pack
  • $3,840
  • Restricted to one authorized user
  • One print only
  • Available in
    Excel
  • Free industry update
    (Within 180 days)
  •   Free report update in next update cycle
    (Nov 2020 - Nov 2021)
  • Single User
  • $5,769
  • Restricted to one authorized user
  • One print only
  • Available in
    PDF
  • Free industry update
    (Within 180 days)
  •   Free report update in next update cycle
    (Nov 2020 - Nov 2021)
  • Five Users
  • $6,450
  • Limited to five authorized users
  • Print upto five copies
  • Available in
    PDF
  • Free industry update
    (Within 180 days)
  •   Free report update in next update cycle
    (Nov 2020 - Nov 2021)
  • Enterprise
    License/PDF

  • $10,995
  • Unlimited
    within
    company/enterprise
  • Available in Excel & PDF
  • Free industry update
    (Within 180 days)
  •   Free report update in next update cycle
    (Nov 2020 - Nov 2021)
  • Library
    Membership

  • $999 $ 1,175
    Per User/ Per month/ Billed annually
  • Published Content
    E-access
  • Company Profiles
    E-access
  • Newly Added Content Access
  • 10 PDF
    Downloads
  • 5 Excel Data
    Pack Downloads
  • 250 Company Profiles PDF Downloads
  • Buy Now

*Taxes/Fees, if applicable will be added during checkout. All prices in USD

RELATED REPORTS
 

Why Allied Market Research?


Infallible Methodology

To ensure high-level data integrity, accurate analysis, and impeccable forecasts

Analyst Support

For complete satisfaction

Customization

On-demand customization of scope of the report to exactly meet your needs

TARGETED MARKET VIEW

Targeted market view to provide pertinent information and save time of readers

Get fresh content delivered

Get insights on topics that are crucial for your business. Stay abreast of your interest areas.

Get Industry Data Alerts

Why Allied Market Research?

Infallible Methodology

To ensure high-level data integrity, accurate analysis, and impeccable forecasts

Analyst Support

For complete satisfaction

Customization

On-demand customization of scope of the report to exactly meet your needs

TARGETED MARKET VIEW

Targeted market view to provide pertinent information and save time of readers