
Disposable Meal Box Market Research, 2034
Market Introduction and Definition
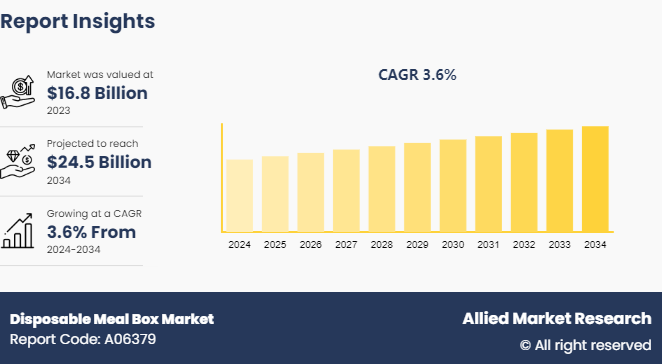
The global disposable meal box market size was valued at $16.8 billion in 2023, and is projected to reach $24.5 billion by 2034, growing at a CAGR of 3.6% from 2024 to 2034. A disposable meal box is a single-use container designed primarily for serving and transporting meals conveniently. It is made from materials such as paperboard, plastic, or foam, which are usually lightweight, economical, and hygienic, making them convenient for food delivery, takeout services, and catering events. Disposable meal boxes often feature compartments to separate different food items, which ensures freshness and prevents mixing of flavors. They are widely used in the food service industry to package a variety of meals, including hot and cold dishes, snacks, and desserts. The disposable nature of disposable meal boxes eliminates the need for cleaning and reduces environmental impact compared to reusable containers. Disposable meal boxes are available in different sizes and shapes to accommodate various portion sizes and types of cuisine, that cater to diverse consumer preferences and operational needs in the food industry.
Key Takeaways
The disposable meal box market study covers 20 countries. The research includes a segment analysis of each country in terms of value ($Billion) for the projected period 2024-2034.
More than 1, 500 product literatures, industry releases, annual reports, and other such documents of major energy storage system industry participants along with authentic industry journals, trade associations' releases, and government websites have been reviewed for generating high-value industry insights.
The study integrated high-quality data, professional opinions and analysis, and critical independent perspectives. The research approach is intended to provide a balanced view of global markets and assist stakeholders in making educated decisions to achieve their most ambitious growth objectives.
Key Market Dynamics
The rise in popularity of takeaway culture significantly boosts the demand for disposable meal boxes. According to the U.S. Department of Agriculture, in 2022, food spending in the U.S. totaled to $2.39 trillion after a pandemic-induced dip in 2020, with food-away-from-home expenditures reaching $1.34 trillion. As more consumers opt for the convenience of ordering food on the go, the need for practical and efficient dining solutions has increased. Disposable meal boxes provide a hassle-free option for both consumers and businesses, as it eliminates the need for washing and returning utensils. The ease of using disposable meal boxes aligns perfectly with the fast-paced lifestyle of urban population, where convenience and time saving are top priorities. Thus, shift in dining preferences has led to a higher consumption of single-use disposables, driving disposable meal box market growth. As a result, manufacturers and suppliers in the disposable meal box market have witnessed rapid market growth opportunities fueled by these evolving consumer habits and preferences.
However, regulatory challenges regarding disposable packaging pose significant restraints on the disposable meal box market demand. Governments worldwide are increasingly implementing stringent regulations aimed at reducing plastic waste and promoting sustainability. These regulations often include bans or restrictions on certain types of disposable materials, such as single-use plastics, which are commonly used in meal boxes. Compliance with these regulations requires manufacturers to innovate and invest in alternative materials that are eco-friendly and meet regulatory standards, which can increase production costs. In addition, varying regulations across different regions or countries create complexity for international manufacturers and distributors. Thus, regulatory changes are anticipated to limit disposable meal box market growth potential in the coming years.
Furthermore, innovations in sustainable and biodegradable materials have created numerous opportunities in the disposable meal box market share. Consumer awareness and environmental concerns have driven a rise in demand for packaging solutions that minimize environmental impact. Manufacturers are increasingly investing in research and development to create meal boxes from materials such as bioplastics, bamboo, sugarcane bagasse, and recycled paperboard. These materials offer benefits such as biodegradability, composability, and reduced carbon footprint compared to traditional plastics. Moreover, advancements in manufacturing technologies have improved the durability, heat resistance, and moisture resistance of these eco-friendly materials, which has made them suitable for a wide range of food applications. Companies can differentiate their products, appeal to environmentally conscious consumers, and comply with evolving regulatory requirements, thereby expanding their market presence and benefiting from the rise in demand for sustainable packaging solutions.
Value Chain of Global Disposable Meal Box Market
The value chain of the disposable meal box market begins with raw material suppliers who provide materials such as paperboard, plastics, bioplastics, and other sustainable alternatives. Manufacturers then convert these materials into various types of disposable meal boxes through processes such as molding, thermoforming, or folding. These products are distributed through a network of wholesalers, distributors, and retail channels, including supermarkets, convenience stores, and online platforms. Food service providers and catering companies procure these boxes for packaging and delivering meals to consumers. End consumers, including individuals, households, and businesses, use disposable meal boxes for takeaway, delivery, and catering purposes. Throughout the chain, there is a focus on product quality, cost-efficiency, and sustainability, with regulatory compliance playing a crucial role in ensuring safety and environmental responsibility across all stages of production, distribution, and consumption.

Market Segmentation
The disposable meal box market is segmented into product type, material type, end use, distribution channel, and region. By product type, the market is fragmented into compartmentalized boxes, non-compartmentalized boxes, hinged boxes, tray and lid sets, and others. By material type, the market is categorized into paper & paperboard, plastic, foam, and others. By end use, the market is classified into the food service industry, retail, institutional, and others. On the basis of distribution channel, it is divided into B2B, supermarkets and hypermarkets, convenience stores, specialty stores, department stores, and others. Region wise, the market is analyzed across North America, Europe, Asia-Pacific, and LAMEA.
Regional/Country Market Outlook
The ongoing shift toward convenience and online food delivery services is expected to sustain demand for efficient and hygienic packaging solutions in the North America region. Increase in awareness of environmental sustainability has driven demand for eco-friendly and biodegradable materials in packaging. Innovations in materials and manufacturing processes, particularly those that enhance functionality and reduce environmental impact are expected to play a crucial role in capturing market share in the region. Moreover, stringent regulations aimed at reducing plastic waste are likely to accelerate adoption of sustainable packaging solutions. Furthermore, evolving consumer preferences for customizable and branded packaging options present opportunities for manufacturers to differentiate their products and cater to diverse market segments in the competitive North American market during the disposable meal box market forecast.
The Asia-Pacific region presents substantial growth opportunities for disposable meal boxes driven by several factors. Rapid urbanization and expanding middle-class populations have increased demand for convenient food packaging solutions, particularly in urban areas where busy lifestyles favor takeaway and delivery services. In addition, rising disposable incomes are influencing consumer preferences toward hygienic and portable meal options, further boosting market growth. Moreover, government initiatives promoting sustainable practices and reducing plastic waste have led to innovation in eco-friendly packaging materials, creating opportunities for manufacturers to introduce biodegradable and compostable alternatives. Furthermore, the proliferation of online food delivery platforms has driven the market potential for disposable meal box market. Thus, by aligning with these trends and addressing local preferences, manufacturers can benefit from the expanding market in the Asia-Pacific region effectively.
Industry Trends:
The integration of technology has transformed the disposable meal box market by enhancing product functionality and driving increased demand. Advancements such as microwave-safe materials allow for convenient reheating of meals without transferring to another container, catering to busy lifestyles and improving user convenience. Similarly, innovations in materials have led to leak-proof and grease-resistant designs, ensuring food safety during transportation and enhancing customer satisfaction. Furthermore, technologies that improve insulation properties help maintain food temperature, preserving freshness and quality. These technological enhancements address practical concerns and align with consumer preferences for efficient, hygienic, and eco-friendly packaging solutions. As a result, manufacturers utilizing these technologies are well-positioned to meet evolving market demands and differentiate their products in the competitive disposable meal box industry.
The use of recycled and upcycled materials has set a significant trend in the disposable cutlery market, driven by growing environmental consciousness and sustainability goals. Manufacturers are increasingly turning to recycled plastics, biodegradable materials such as cornstarch or bamboo, and upcycled agricultural waste such as wheat straw or bagasse. These materials offer dual benefits of reducing waste and carbon footprint while providing functional and hygienic alternatives to traditional plastic cutlery. Consumers and businesses have started prioritizing eco-friendly options that minimize environmental impact without compromising on performance. As regulatory pressures and consumer preferences for sustainable practices continue to rise, the adoption of recycled and upcycled materials in disposable meal box products have reshaping industry norms within the food service and hospitality sectors.
Competitive Landscape
The major players operating in the disposable meal box market include Graphic Packaging, Xian Shangjia, Huhtamaki, TrueChoicePack (TCP) , Dogguan Xinxie, Hefty, Guangdong Huasheng Meto., Natural Tableware, Letica, CKF Inc., and Biopak.
Other players in the disposable meal box market include Dart Container Corporation, Pactiv LLC, Anchor Packaging, Sabert Corporation, Novolex Holdings, Inc., Genpak LLC, Eco-Products, Inc., Vegware, WinCup, PulpWorks, Inc., Waddington North America (WNA) , Be Green Packaging, D&W Fine Pack, Eco Guardian, and so on.
Recent Key Strategies and Developments
In April 2024, Graphic Packaging International introduces IntegraFlex, a hybrid paper-plastic meal box designed for optimal food freshness and recyclability to strengthen their product portfolio.
In February 2024, Novolex launched EcoCraft Mega, extra-large disposable meal boxes made from recycled paperboard to provide consumers with meal boxes for family-style takeout orders.
In December 2023, Berry Global launched Reborn, a series of meal boxes made from 100% post-consumer recycled plastic to target environmentally conscious consumers.
Key Benefits For Stakeholders
- This report provides a quantitative analysis of the market segments, current trends, estimations, and dynamics of the disposable meal box market analysis from 2024 to 2034 to identify the prevailing disposable meal box market opportunities.
- The market research is offered along with information related to key drivers, restraints, and opportunities.
- Porter's five forces analysis highlights the potency of buyers and suppliers to enable stakeholders make profit-oriented business decisions and strengthen their supplier-buyer network.
- In-depth analysis of the disposable meal box market segmentation assists to determine the prevailing market opportunities.
- Major countries in each region are mapped according to their revenue contribution to the global market.
- Market player positioning facilitates benchmarking and provides a clear understanding of the present position of the market players.
- The report includes the analysis of the regional as well as global disposable meal box market trends, key players, market segments, application areas, and market growth strategies.
Disposable Meal Box Market Report Highlights
| Aspects | Details |
| Market Size By 2034 | USD 24.5 Billion |
| Growth Rate | CAGR of 3.6% |
| Forecast period | 2024 - 2034 |
| Report Pages | 306 |
| By Product Type |
|
| By Material Type |
|
| By End Use |
|
| By Distribution Channel |
|
| By Region |
|
| Key Market Players | Natural Tableware, CKF Inc., Guangdong Huasheng Meto., Hefty, Dogguan Xinxie, Letica, Graphic Packaging Holding Company, BioPak, TrueChoicePack (TCP), Huhtamaki, Xian Shangjia |
The global disposable meal box market is trending towards eco-friendly materials, innovative designs, increased use in food delivery services, and customization for different cuisines and dietary preferences.
The leading application of the disposable meal box market is food delivery services, which utilize these boxes for packaging and transporting meals to consumers, enhancing convenience and hygiene.
The global disposable meal box market was valued at $16.8 billion in 2023.
The global disposable meal box market was valued at $16.8 billion in 2023.
The major players operating in the disposable meal box market include Graphic Packaging, Xian Shangjia, Huhtamaki, TrueChoicePack (TCP), Dogguan Xinxie, Hefty, Guangdong Huasheng Meto., Natural Tableware, Letica, CKF Inc., and Biopak.
Loading Table Of Content...

