0
2019
Disposable Medical Gloves Market

Disposable Medical Gloves Market

by Type (Natural Rubber Gloves, Nitrile Gloves, Vinyl Gloves, Neoprene Gloves, Polyethylene Gloves, and Others), Form (Powder and Non-powder), and Application (Examination and Surgical): Global Opportunity Analysis and Industry Forecast, 2018-2025

Report Code: A04235
May 2019 | Pages: 217
Tables: 90
Charts: 44
  • Formats*:

  • pdf

    Single User License, Five User
    License & Enterprise User License

  • xls

    Data Pack Excel License

  • ppt

    It comes with the additional cost
    of $2500.00 contact sales.


COVID-19

Pandemic disrupted the entire world and affected many industries.

Get detailed COVID-19 impact analysis on the Disposable Medical Gloves Market

Request Now !

Disposable Medical Gloves Market Outlook - 2025

The global disposable medical gloves market was valued at $4,047 million in 2017, and is expected to reach $8,444 million by 2025, registering a CAGR of 9.5% during the forecast period. Disposable medical gloves majorly act as a protection utility to avoid infection of healthcare professionals and patients. During time, numerous variants of disposable medical gloves have been developed, which include nitrile, natural rubber, neoprene, and vinyl. Each of these variants have different benefits as compared with conventional (usually rubber) gloves, and provides wide application in healthcare industry. For instance, nitrile gloves are friction less, puncture-resistant, and have a long shelf life than latex gloves. Subsequently, nitrile gloves are used by tattoo artists, medical and dental professionals as well as in laboratories as they provide barrier protection and high durability as well are highly rupture resistant. Rise in incidence of pandemic diseases such as swine flu (H1N1 pandemic) and a subsequent need for infection control drives the growth of the global disposable medical gloves market. High durability of gloves coupled with protection from chemicals makes disposable medical gloves a major revenue generating segment in the chemical industries as well. 

Disposable Medical Gloves Market

The adoption of disposable medical gloves has increased over the years owing to the rise in safety concerns and hygiene. In addition, the growth in number of end users in the healthcare industry coupled with the advancements in technology also aid in supplementing the disposable medical gloves market growth. Further, significant increase in frequent outbreak of epidemics and pandemics across the globe propels the disposable medical gloves market in near future. However, toxic reaction caused by gloves and high price competition from local manufactures impede the growth of the disposable medical gloves market. For instance, the accelerators and other chemicals used to manufacture latex and non-latex gloves causes allergic reactions such as irritant contact dermatitis. Moreover, the introduction of disposable medical gloves in untapped economies is expected to create lucrative opportunities in the market. In addition, disposable medical gloves find their application in surgical and examination purposes. Examination application was the highest contributor in the disposable medical gloves industry owing to the wide array of uses such as emergency medical services, general medical exam, first response, and laboratory application for personal protection during operative procedures.
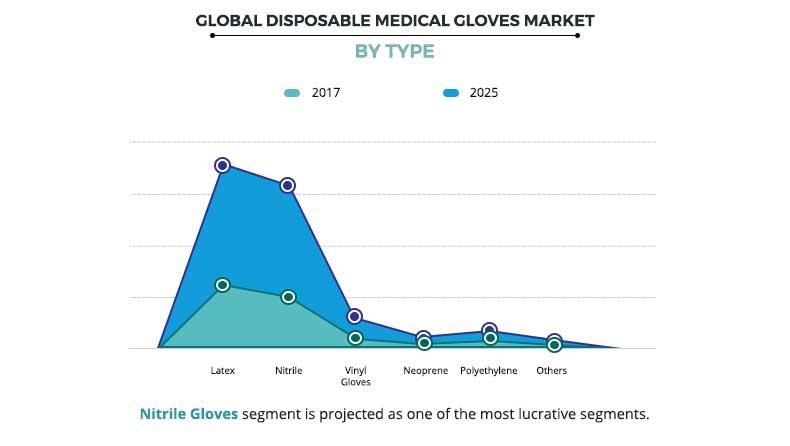
Disposable Medical Gloves Market By Type

Type segment review

The global disposable medical gloves market based on type is divided into natural rubber gloves, nitrile gloves, vinyl gloves, neoprene, polyethylene and others. The natural rubber gloves segment accounted for the highest revenue in 2017, owing to the fact that these gloves are the choice of preference among medical professionals to perform surgeries and for examination purposes. However, the nitrile gloves segment is anticipated to grow at the fastest rate during the forecast period owing to various cost efficiency and ease of availability. Moreover, nitrile gloves are primarily being used in the medical sector, as a safety tool to prevent spreading of infection between caretakers and patients. The benefits offered by nitrile gloves include superior strength, longevity, and better protection against blood borne pathogens. In addition, nitrile gloves are latex-free, thereby, it becomes the preferable of choice for medical professionals who are allergic to latex gloves.
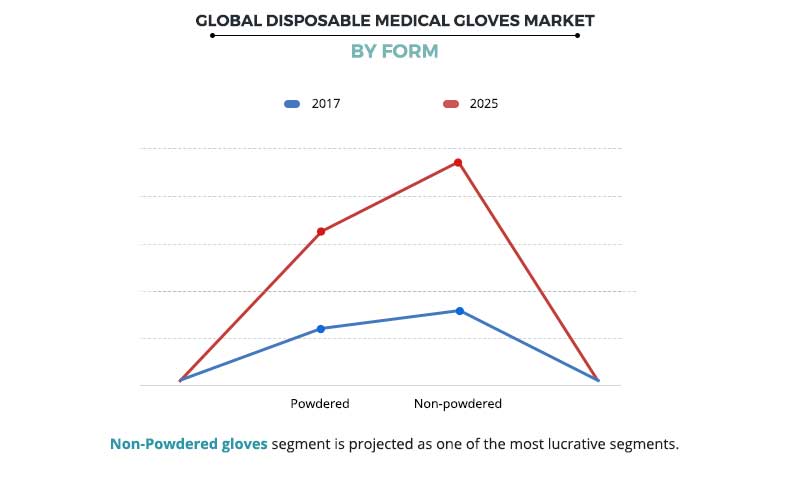
Disposable Medical Gloves Market By Form

Form segment review

Based on form segment, the disposable medical gloves market is segmented into powdered and non-powdered. Non-powdered disposable gloves segment generated the highest revenue in 2017 ad is anticipated to continue the same during the forecast period. This is attributed to the ban of powdered disposable medical gloves by FDA in December 2016 due to unreasonable and substantial risk of illness or injury to individuals exposed to the powdered gloves. Many other developed countries including Germany, UK and others have also imposed a ban on disposable medical gloves usage for surgical and examination purpose.

Disposable Medical Gloves Market By Region

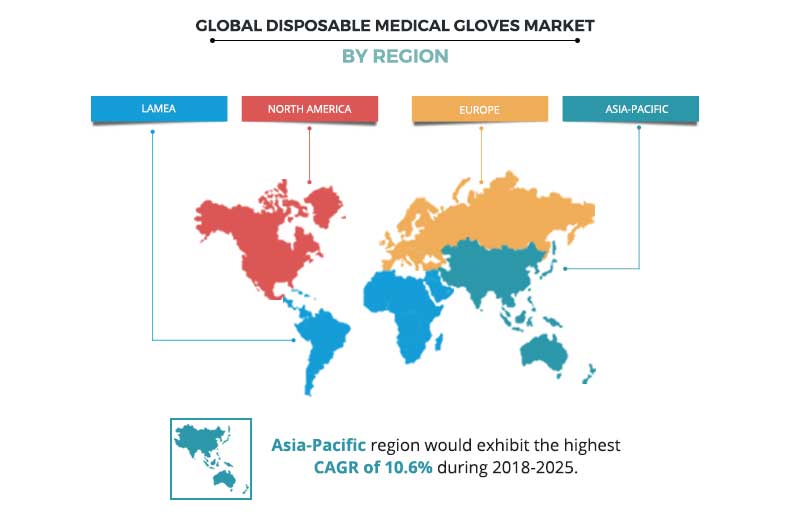
Disposable medical gloves market, by region

The disposable medical gloves market based on region is analyzed across North America, Europe, Asia-Pacific, and LAMEA. North America dominated the disposable medical gloves market in terms of revenue in 2017, and is expected to retain its dominance throughout the forecast period. This is attributed to the well-established healthcare infrastructure and the increase in adoption of disposable medical gloves across healthcare settings for preventing healthcare associated infections. However, Asia-Pacific is expected to grow at the fastest growth rate during the forecast period owing to the rise in adoption of disposable gloves for examination purposes, and surge in awareness pertaining to wellbeing and hygiene amongst medical professionals in this region.

The report provides a comprehensive global disposable medical gloves analysis of the key players operating in the market such as Top Glove Corporation Berhad, Supermax Corporation Berhad, Semperit AG Holding, Rubberex Corp. M Bhd, Kossan Rubber Industries Bhd., Hartalega Holdings Berhad, Dynarex Corporation, Cardinal Health, Inc., B. Braun Melsungen AG and Ansell Limited. Other players operating in the value chain are Unigloves (UK) Limited, Smart Glove Corporation Sdn Bhd, Cypress Medical Products LLC, Microflex Corporation, Mölnlycke Health Care, and YTY Industry Holdings Berhad.

Key Benefits for Disposable Medical Gloves Market:

  • The study provides an in-depth analysis of the global disposable medical gloves market share with the current trends and future estimations to elucidate the imminent investment pockets.
  • A comprehensive analysis of the factors that drive and restrict the global disposable medical gloves market size is provided.
  • A comprehensive quantitative analysis is provided from 2018 to 2025 to assist stakeholders to capitalize on the prevailing market opportunities.
  • An extensive analysis of the key segments of the industry helps to understand the global disposable medical gloves market trends.
  • Key players and their strategies are provided to understand the competitive outlook of the disposable medical gloves market forecast.

Disposable Medical Gloves Market Report Highlights

Aspects Details
By Type
  • Natural Rubber Gloves
  • Nitrile Gloves
  • Vinyl Gloves
  • Neoprene Gloves
  • Polyethylene Gloves
  • Others
By Form
  • Powdered Disposable Gloves
  • Non-powdered Disposable Gloves
By APPLICATION
  • Examination
  • Surgical
By Region
  • North America  (U.S., Canada, Mexico)
  • Europe  (UK, Germany, France, Spain, Italy, Rest of Europe)
  • Asia-Pacific  (Japan, India, China, Australia, Korea, Rest of Asia-Pacific)
  • LAMEA  (Middle East, Latin America, Africa)
Key Market Players Kossan Rubber Industries Bhd., Top Glove Corporation Berhad, B. Braun Melsungen AG, Hartalega Holdings Berhad, Rubberex Corp. M Bhd., Ansell Limited, Semperit AG Holding, Cardinal Health, Inc., Supermax Corporation Berhad, Dynarex Corporation
 

CHAPTER 1:    DISPOSABLE MEDICAL GLOVES MARKET, BY TYPE

1.1.    Overview

1.1.1.    Market size and forecast

1.2.    Natural Rubber Gloves

1.2.1.    Key market trends and opportunities
1.2.2.    Market size and forecast

1.3.    Nitrile Gloves

1.3.1.    Key market trends and opportunities
1.3.2.    Market size and forecast

1.4.    Vinyl Gloves

1.4.1.    Key market trends and opportunities
1.4.2.    Market size and forecast

1.5.    Neoprene Gloves

1.5.1.    Key market trends and opportunities
1.5.2.    Market size and forecast

1.6.    Polyethylene Gloves

1.6.1.    Key market trends and opportunities
1.6.2.    Market size and forecast

1.7.    Others

1.7.1.    Key market trends and opportunities
1.7.2.    Market size and forecast

CHAPTER 2:    DISPOSABLE MEDICAL GLOVES MARKET, BY FORM

2.1.    Overview

2.1.1.    Market size and forecast

2.2.    Powdered Disposable Gloves

2.2.1.    Market size and forecast

2.3.    Non-powdered Disposable Gloves

2.3.1.    Market size and forecast

CHAPTER 3:    DISPOSABLE MEDICAL GLOVES MARKET, BY APPLICATION

3.1.    Overview

3.1.1.    Market size and forecast

3.2.    Examination

3.2.1.    Market size and forecast

3.3.    Surgical

3.3.1.    Market size and forecast

CHAPTER 4:    DISPOSABLE MEDICAL GLOVES MARKET, BY REGION

4.1.    Overview

4.1.1.    Market size and forecast

4.2.    North America

4.2.1.    Key market trends and opportunities
4.2.2.    Market size and forecast, by type
4.2.3.    Market size and forecast, by form
4.2.4.    Market size and forecast, by application
4.2.5.    Market size and forecast, by country

4.2.5.1.    U.S. market size and forecast
4.2.5.2.    Canada market size and forecast
4.2.5.3.    Mexico market size and forecast

4.3.    Europe

4.3.1.    Key market trends and opportunities
4.3.2.    Market size and forecast, by type
4.3.3.    Market size and forecast, by form
4.3.4.    Market size and forecast, by application
4.3.5.    Market size and forecast, by country

4.3.5.1.    UK market size and forecast
4.3.5.2.    Germany market size and forecast
4.3.5.3.    France market size and forecast
4.3.5.4.    Spain market size and forecast
4.3.5.5.    Italy market size and forecast
4.3.5.6.    Rest of Europe market size and forecast

4.4.    Asia-Pacific

4.4.1.    Key market trends and opportunities
4.4.2.    Market size and forecast, by type
4.4.3.    Market size and forecast, by form
4.4.4.    Market size and forecast, by application
4.4.5.    Market size and forecast, by country
4.4.5.1.    Japan market size and forecast
4.4.5.2.    India market size and forecast
4.4.5.3.    China market size and forecast
4.4.5.4.    Australia market size and forecast
4.4.5.5.    Korea market size and forecast
4.4.5.6.    Rest of Asia-Pacific market size and forecast

4.5.    LAMEA

4.5.1.    Key market trends and opportunities
4.5.2.    Market size and forecast, by type
4.5.3.    Market size and forecast, by form
4.5.4.    Market size and forecast, by application
4.5.5.    Market size and forecast, by country
4.5.5.1.    Middle East market size and forecast
4.5.5.2.    Latin America market size and forecast
4.5.5.3.    Africa market size and forecast

CHAPTER 5:    COMPANY PROFILES

5.1.    Ansell Limited

5.1.1.    Company overview
5.1.2.    Company snapshot
5.1.3.    Operating business segments
5.1.4.    Product portfolio
5.1.5.    Business performance
5.1.6.    Key strategic moves and developments
5.1.7.    SWOT analysis

5.2.    B. Braun Melsungen AG

5.2.1.    Company overview
5.2.2.    Company snapshot
5.2.3.    Operating business segments
5.2.4.    Product portfolio
5.2.5.    Business performance
5.2.6.    SWOT analysis

5.3.    Cardinal Health, Inc.

5.3.1.    Company overview
5.3.2.    Company snapshot
5.3.3.    Operating business segments
5.3.4.    Product portfolio
5.3.5.    Business performance
5.3.6.    Key strategic moves and developments
5.3.7.    SWOT analysis

5.4.    Dynarex Corporation

5.4.1.    Company overview
5.4.2.    Company snapshot
5.4.3.    Operating business segments
5.4.4.    Product portfolio
5.4.5.    SWOT analysis

5.5.    Hartalega Holdings Berhad

5.5.1.    Company overview
5.5.2.    Company snapshot
5.5.3.    Product portfolio
5.5.4.    Business performance
5.5.5.    Key strategic moves and developments
5.5.6.    SWOT analysis

5.6.    Kossan Rubber Industries Bhd.

5.6.1.    Company overview
5.6.2.    Company snapshot
5.6.3.    Operating business segments
5.6.4.    Product portfolio
5.6.5.    Business performance
5.6.6.    Key strategic moves and developments
5.6.7.    SWOT analysis

5.7.    Rubberex Corp. M Bhd.

5.7.1.    Company overview
5.7.2.    Company snapshot
5.7.3.    Operating business segments
5.7.4.    Product portfolio
5.7.5.    Key strategic moves and developments
5.7.6.    SWOT analysis

5.8.    Semperit AG Holding

5.8.1.    Company overview
5.8.2.    Company snapshot
5.8.3.    Operating business segments
5.8.4.    Product portfolio
5.8.5.    Business performance
5.8.6.    Key strategic moves and developments
5.8.7.    SWOT analysis

5.9.    Supermax Corporation Berhad

5.9.1.    Company overview
5.9.2.    Company snapshot
5.9.3.    Operating business segments
5.9.4.    Product portfolio
5.9.5.    Business performance
5.9.6.    SWOT analysis

5.10.    Top Glove Corporation Berhad

5.10.1.    Company overview
5.10.2.    Company snapshot
5.10.3.    Operating business segments
5.10.4.    Product portfolio
5.10.5.    Business performance
5.10.6.    Key strategic moves and developments
5.10.7.    SWOT analysis

LIST OF TABLES

TABLE 01.    GLOBAL DISPOSABLE MEDICAL GLOVES MARKET, BY TYPE, 2017–2025 ($MILLION)
TABLE 02.    GLOBAL DISPOSABLE MEDICAL GLOVES MARKET, BY TYPE, 2017–2025 (BILLION UNITS)
TABLE 03.    DISPOSABLE NATURAL RUBBER GLOVES MARKET, BY REGION, 2017–2025 ($MILLION)
TABLE 04.    DISPOSABLE NATURAL RUBBER GLOVES MARKET, BY REGION, 2017–2025 (BILLION UNITS)
TABLE 05.    DISPOSABLE NITRILE GLOVES MARKET, BY REGION, 2017–2025 ($MILLION)
TABLE 06.    DISPOSABLE NITRILE GLOVES MARKET, BY REGION, 2017–2025 (BILLION UNITS)
TABLE 07.    DISPOSABLE VINYL GLOVES MARKET, BY REGION, 2017–2025 ($MILLION)
TABLE 08.    DISPOSABLE VINYL GLOVES MARKET, BY REGION, 2017–2025 (BILLION UNITS)
TABLE 09.    DISPOSABLE NEOPRENE GLOVES MARKET, BY REGION, 2017–2025 ($MILLION)
TABLE 10.    DISPOSABLE NEOPRENE GLOVES MARKET, BY REGION, 2017–2025 (BILLION UNITS)
TABLE 11.    DISPOSABLE POLYETHYLENE GLOVES MARKET, BY REGION, 2017–2025 ($MILLION)
TABLE 12.    DISPOSABLE POLYETHYLENE GLOVES MARKET, BY REGION, 2017–2025 (BILLION UNITS)
TABLE 13.    DISPOSABLE POLYISOPRENE GLOVES AND MANUFACTURERS
TABLE 14.    OTHER DISPOSABLE MEDICAL GLOVES MARKET, BY REGION, 2017–2025 ($MILLION)
TABLE 15.    OTHER DISPOSABLE MEDICAL GLOVES MARKET, BY REGION, 2017–2025 (BILLION UNITS)
TABLE 16.    GLOBAL DISPOSABLE MEDICAL GLOVES MARKET, BY FORM, 2017–2025 ($MILLION)
TABLE 17.    GLOBAL DISPOSABLE MEDICAL GLOVES MARKET, BY FORM, 2017–2025 (BILLION UNITS)
TABLE 18.    POWDERED DISPOSABLE MEDICAL GLOVES MARKET, BY REGION, 2017–2025 ($MILLION)
TABLE 19.    POWDERED DISPOSABLE MEDICAL GLOVES MARKET, BY REGION, 2017–2025 (BILLION UNITS)
TABLE 20.    NON-POWDERED DISPOSABLE MEDICAL GLOVES MARKET, BY REGION, 2017–2025 ($MILLION)
TABLE 21.    NON-POWDERED DISPOSABLE MEDICAL GLOVES MARKET, BY REGION, 2017–2025 (BILLION UNITS)
TABLE 22.    GLOBAL DISPOSABLE MEDICAL GLOVES MARKET, BY APPLICATION, 2017–2025 ($MILLION)
TABLE 23.    GLOBAL DISPOSABLE MEDICAL GLOVES MARKET, BY APPLICATION, 2017–2025 (BILLION UNITS)
TABLE 24.    DISPOSABLE MEDICAL GLOVES MARKET FOR EXAMINATION, BY REGION, 2017–2025 ($MILLION)
TABLE 25.    DISPOSABLE MEDICAL GLOVES MARKET FOR EXAMINATION, BY REGION, 2017–2025 (BILLION UNITS)
TABLE 26.    DISPOSABLE MEDICAL GLOVES MARKET FOR SURGICAL, BY REGION, 2017–2025 ($MILLION)
TABLE 27.    DISPOSABLE MEDICAL GLOVES MARKET FOR SURGICAL, BY REGION, 2017–2025 (BILLION UNITS)
TABLE 28.    DISPOSABLE MEDICAL GLOVES MARKET, BY REGION, 2017–2025 ($MILLION)
TABLE 29.    DISPOSABLE MEDICAL GLOVES MARKET, BY REGION, 2017–2025 (BILLION UNITS)
TABLE 30.    NORTH AMERICA DISPOSABLE MEDICAL GLOVES MARKET, BY TYPE, 2017–2025 ($MILLION)
TABLE 31.    NORTH AMERICA DISPOSABLE MEDICAL GLOVES MARKET, BY TYPE, 2017–2025 (BILLION UNITS)
TABLE 32.    NORTH AMERICA DISPOSABLE MEDICAL GLOVES MARKET, BY FORM, 2017–2025 ($MILLION)
TABLE 33.    NORTH AMERICA DISPOSABLE MEDICAL GLOVES MARKET, BY FORM, 2017–2025 (BILLION UNITS)
TABLE 34.    NORTH AMERICA DISPOSABLE MEDICAL GLOVES MARKET, BY APPLICATION, 2017–2025 ($MILLION)
TABLE 35.    NORTH AMERICA DISPOSABLE MEDICAL GLOVES MARKET, BY APPLICATION, 2017–2025 (BILLION UNITS)
TABLE 36.    NORTH AMERICA DISPOSABLE MEDICAL GLOVES MARKET, 2017–2025 ($MILLION)
TABLE 37.    NORTH AMERICA DISPOSABLE MEDICAL GLOVES MARKET, 2017–2025 (BILLION UNITS)
TABLE 38.    EUROPE DISPOSABLE MEDICAL GLOVES MARKET, BY TYPE, 2017–2025 ($MILLION)
TABLE 39.    EUROPE DISPOSABLE MEDICAL GLOVES MARKET, BY TYPE, 2017–2025 (BILLION UNITS)
TABLE 40.    EUROPE DISPOSABLE MEDICAL GLOVES MARKET, BY FORM, 2017–2025 ($MILLION)
TABLE 41.    EUROPE DISPOSABLE MEDICAL GLOVES MARKET, BY FORM, 2017–2025 (BILLION UNITS)
TABLE 42.    EUROPE DISPOSABLE MEDICAL GLOVES MARKET, BY APPLICATION, 2017–2025 ($MILLION)
TABLE 43.    EUROPE DISPOSABLE MEDICAL GLOVES MARKET, BY APPLICATION, 2017–2025 (BILLION UNITS)
TABLE 44.    EUROPE DISPOSABLE MEDICAL GLOVES MARKET, 2017–2025 ($MILLION)
TABLE 45.    EUROPE DISPOSABLE MEDICAL GLOVES MARKET, 2017–2025 (BILLION UNITS)
TABLE 46.    ASIA-PACIFIC DISPOSABLE MEDICAL GLOVES MARKET, BY TYPE, 2017–2025 ($MILLION)
TABLE 47.    ASIA-PACIFIC DISPOSABLE MEDICAL GLOVES MARKET, BY TYPE, 2017–2025 (BILLION UNITS)
TABLE 48.    ASIA-PACIFIC DISPOSABLE MEDICAL GLOVES MARKET, BY FORM, 2017–2025 ($MILLION)
TABLE 49.    ASIA-PACIFIC DISPOSABLE MEDICAL GLOVES MARKET, BY FORM, 2017–2025 (BILLION UNITS)
TABLE 50.    ASIA-PACIFIC DISPOSABLE MEDICAL GLOVES MARKET, BY APPLICATION, 2017–2025 ($MILLION)
TABLE 51.    ASIA-PACIFIC DISPOSABLE MEDICAL GLOVES MARKET, BY APPLICATION, 2017–2025 (BILLION UNITS)
TABLE 52.    ASIA-PACIFIC DISPOSABLE MEDICAL GLOVES MARKET, 2017–2025 ($MILLION)
TABLE 53.    ASIA-PACIFIC DISPOSABLE MEDICAL GLOVES MARKET, 2017–2025 (BILLION UNITS)
TABLE 54.    LAMEA DISPOSABLE MEDICAL GLOVES MARKET, BY TYPE, 2017–2025 ($MILLION)
TABLE 55.    LAMEA DISPOSABLE MEDICAL GLOVES MARKET, BY TYPE, 2017–2025 (BILLION UNITS)
TABLE 56.    LAMEA DISPOSABLE MEDICAL GLOVES MARKET, BY FORM, 2017–2025 ($MILLION)
TABLE 57.    LAMEA DISPOSABLE MEDICAL GLOVES MARKET, BY FORM, 2017–2025 (BILLION UNITS)
TABLE 58.    LAMEA DISPOSABLE MEDICAL GLOVES MARKET, BY APPLICATION, 2017–2025 ($MILLION)
TABLE 59.    LAMEA DISPOSABLE MEDICAL GLOVES MARKET, BY APPLICATION, 2017–2025 (BILLION UNITS)
TABLE 60.    LAMEA DISPOSABLE MEDICAL GLOVES MARKET, 2017–2025 ($MILLION)
TABLE 61.    LAMEA DISPOSABLE MEDICAL GLOVES MARKET, 2017–2025 (BILLION UNITS)
TABLE 62.    ANSELL: COMPANY SNAPSHOT
TABLE 63.    ANSELL: OPERATING SEGMENTS
TABLE 64.    ANSELL: PRODUCT PORTFOLIO
TABLE 65.    B. BRAUN: COMPANY SNAPSHOT
TABLE 66.    B. BRAUN: OPERATING SEGMENTS
TABLE 67.    B. BRAUN: PRODUCT PORTFOLIO
TABLE 68.    CARDINAL HEALTH: COMPANY SNAPSHOT
TABLE 69.    CARDINAL HEALTH: OPERATING SEGMENTS
TABLE 70.    CARDINAL HEALTH: PRODUCT PORTFOLIO
TABLE 71.    DYNAREX: COMPANY SNAPSHOT
TABLE 72.    DYNAREX: OPERATING SEGMENTS
TABLE 73.    DYNAREX: PRODUCT PORTFOLIO
TABLE 74.    HARTALEGA: COMPANY SNAPSHOT
TABLE 75.    HARTALEGA: PRODUCT PORTFOLIO
TABLE 76.    KOSSAN: COMPANY SNAPSHOT
TABLE 77.    KOSSAN: OPERATING SEGMENTS
TABLE 78.    KOSSAN: PRODUCT PORTFOLIO
TABLE 79.    RUBBEREX: COMPANY SNAPSHOT
TABLE 80.    RUBBEREX: PRODUCT SEGMENTS
TABLE 81.    RUBBEREX: PRODUCT PORTFOLIO
TABLE 82.    SEMPERIT: COMPANY SNAPSHOT
TABLE 83.    SEMPERIT: OPERATING SEGMENTS
TABLE 84.    SEMPERIT: PRODUCT PORTFOLIO
TABLE 85.    SUPERMAX: COMPANY SNAPSHOT
TABLE 86.    SUPERMAX: OPERATING SEGMENTS
TABLE 87.    SUPERMAX: PRODUCT PORTFOLIO
TABLE 88.    TOP GLOVE: COMPANY SNAPSHOT
TABLE 89.    TOP GLOVE: PRODUCT PORTFOLIO

 LIST OF FIGURES

FIGURE 01.    GLOBAL DISPOSABLE MEDICAL GLOVES MARKET, BY TYPE
FIGURE 02.    GLOBAL DISPOSABLE MEDICAL GLOVES MARKET, BY FORM
FIGURE 03.    GLOBAL DISPOSABLE MEDICAL GLOVES MARKET, BY APPLICATION
FIGURE 04.    DISPOSABLE MEDICAL GLOVES MARKET, BY REGION
FIGURE 05.    U.S. MARKET SIZE AND FORECAST
FIGURE 06.    CANADA MARKET SIZE AND FORECAST
FIGURE 07.    MEXICO MARKET SIZE AND FORECAST
FIGURE 08.    UK MARKET SIZE AND FORECAST
FIGURE 09.    GERMANY MARKET SIZE AND FORECAST
FIGURE 10.    FRANCE MARKET SIZE AND FORECAST
FIGURE 11.    SPAIN MARKET SIZE AND FORECAST
FIGURE 12.    ITALY MARKET SIZE AND FORECAST
FIGURE 13.    REST OF EUROPE MARKET SIZE AND FORECAST
FIGURE 14.    JAPAN MARKET SIZE AND FORECAST
FIGURE 15.    INDIA MARKET SIZE AND FORECAST
FIGURE 16.    CHINA MARKET SIZE AND FORECAST
FIGURE 17.    AUSTRALIA MARKET SIZE AND FORECAST
FIGURE 18.    KOREA MARKET SIZE AND FORECAST
FIGURE 19.    REST OF ASIA-PACIFIC MARKET SIZE AND FORECAST
FIGURE 20.    MIDDLE EAST MARKET SIZE AND FORECAST
FIGURE 21.    LATIN AMERICA MARKET SIZE AND FORECAST
FIGURE 22.    AFRICA MARKET SIZE AND FORECAST
FIGURE 23.    ANSELL: NET SALES, 2015–2017 ($MILLION)
FIGURE 24.    ANSELL: REVENUE SHARE BY SEGMENT, 2017 (%)
FIGURE 25.    ANSELL: REVENUE SHARE BY GEOGRAPHY, 2017 (%)
FIGURE 26.    B. BRAUN: NET SALES, 2014–2016 ($MILLION)
FIGURE 27.    B. BRAUN: REVENUE SHARE BY SEGMENT, 2016 (%)
FIGURE 28.    B. BRAUN: REVENUE SHARE BY GEOGRAPHY, 2016 (%)
FIGURE 29.    CARDINAL HEALTH: NET SALES, 2015–2017 ($MILLION)
FIGURE 30.    CARDINAL HEALTH: REVENUE SHARE BY SEGMENT, 2017 (%)
FIGURE 31.    CARDINAL HEALTH: REVENUE SHARE BY GEOGRAPHY, 2017 (%)
FIGURE 32.    HARTALEGA: NET SALES, 2015–2017 ($MILLION)
FIGURE 33.    HARTALEGA: REVENUE SHARE BY GEOGRAPHY, 2017 (%)
FIGURE 34.    KOSSAN: NET SALES, 2014–2016 ($MILLION)
FIGURE 35.    KOSSAN: REVENUE SHARE BY SEGMENT, 2016 (%)
FIGURE 36.    KOSSAN: REVENUE SHARE BY GEOGRAPHY, 2016 (%)
FIGURE 37.    SEMPERIT: NET SALES, 2014–2016 ($MILLION)
FIGURE 38.    SEMPERIT: REVENUE SHARE BY SEGMENT, 2016 (%)
FIGURE 39.    SEMPERIT: REVENUE SHARE BY GEOGRAPHY, 2016 (%)
FIGURE 40.    SUPERMAX: NET SALES, 2014–2017 ($MILLION)
FIGURE 41.    SUPERMAX: REVENUE SHARE BY SEGMENT, 2017 (%)
FIGURE 42.    SUPERMAX: REVENUE SHARE BY GEOGRAPHY, 2017 (%)
FIGURE 43.    TOP GLOVE: NET SALES, 2015–2017 ($MILLION)
FIGURE 44.    TOP GLOVE: REVENUE SHARE BY GEOGRAPHY, 2017 (%)


The utilization of disposable medical gloves is projected to witness a significant increase, owing to high incidence of diseases across the globe. The market is largely fragmented, and several manufacturers have focused on offering advanced and novel disposable medical gloves, which aid in curbing latex-associated allergies and hospital acquired infections. In addition, market players have successfully manufactured gloves with different properties such as higher resistance against chemicals, superior anti-tear properties and gloves with limited thickness thereby not affecting the wearing and removing process, which is anticipated to create lucrative opportunities for the growth of disposable medical gloves industry.

Disposable medical gloves are primarily used across health care industry, as a protective tool that avoids cross infection between caregivers and patients or the users. Over time, numerous variants of disposable medical gloves have been developed. These include natural rubber, nitrile, vinyl, and neoprene. Latex rubber, as a material is the major component used during the production of disposable medical gloves; however, this trend is shifting from latex gloves to nitrile or vinyl due to the increase in cases of infection from the latex gloves. Each of these variants render unique benefits over conventional gloves; this also paves way for a wide application spanning range of industries such as clean room, and other medical applications. For instance, nitrile gloves are more puncture resistant and friction less with a long shelf life as compared to latex gloves, thus are utilized in many medical surgeries.

Increase in incidences of pandemic diseases such as swine flu (H1N1 pandemic) and a resultant need for infection prevention/control aids, such as “disposable medical gloves”, (economically, can be used) drive the growth of global disposable medical gloves market volume (billion gloves). Moreover, polyethylene-based disposable medical gloves are in high demand in the industry, due to their cost effectiveness and ease of availability. The use of non-powder gloves aids in supplementing the market growth, as these gloves do not develop adhesion and granulomas, thereby reducing the risk of post-operative wound infection as well as latex allergens sensitizations, and hypersensitivity.


PURCHASE OPTIONS

Call or Email us

U.S.-Canada Toll-free: +1-800-792-5285
Int'l : +1-503-894-6022
Europe : +44-845-528-1300
Email : help@alliedmarketresearch.com

Looking for Customization?

 Customization Request

Have a Question?

 Speak with Analyst

Any Confusion?

 Inquire Before Buying

Have a glance of the Report

  Request Sample

Purchase Full Report of
Disposable Medical Gloves Market

Start reading instantly.
This Report and over 67,069+ more Reports, Available with Avenue Library. T&C*.

  • Online Only
  • $3,456
  • Online cloud access only
  • Restricted print, copy, paste & download
  • Read only
  • Free industry update
    (Within 180 days)
  • Free report update in next update cycle
    (May 2020 - May 2021)
  • Data Pack
  • $3,840
  • Restricted to one authorized user
  • One print only
  • Available in
    Excel
  • Free industry update
    (Within 180 days)
  •   Free report update in next update cycle
    (May 2020 - May 2021)
  • Single User
  • $5,769
  • Restricted to one authorized user
  • One print only
  • Available in
    PDF
  • Free industry update
    (Within 180 days)
  •   Free report update in next update cycle
    (May 2020 - May 2021)
  • Five Users
  • $6,450
  • Limited to five authorized users
  • Print upto five copies
  • Available in
    PDF
  • Free industry update
    (Within 180 days)
  •   Free report update in next update cycle
    (May 2020 - May 2021)
  • Enterprise
    License/PDF

  • $10,995
  • Unlimited
    within
    company/enterprise
  • Available in Excel & PDF
  • Free industry update
    (Within 180 days)
  •   Free report update in next update cycle
    (May 2020 - May 2021)
  • Library
    Membership

  • $999 $ 1,175
    Per User/ Per month/ Billed annually
  • Published Content
    E-access
  • Company Profiles
    E-access
  • Newly Added Content Access
  • 10 PDF
    Downloads
  • 5 Excel Data
    Pack Downloads
  • 250 Company Profiles PDF Downloads
  • Buy Now

*Taxes/Fees, if applicable will be added during checkout. All prices in USD

RELATED REPORTS
 

Why Allied Market Research?


Infallible Methodology

To ensure high-level data integrity, accurate analysis, and impeccable forecasts

Analyst Support

For complete satisfaction

Customization

On-demand customization of scope of the report to exactly meet your needs

TARGETED MARKET VIEW

Targeted market view to provide pertinent information and save time of readers

Get fresh content delivered

Get insights on topics that are crucial for your business. Stay abreast of your interest areas.

Get Industry Data Alerts

Why Allied Market Research?

Infallible Methodology

To ensure high-level data integrity, accurate analysis, and impeccable forecasts

Analyst Support

For complete satisfaction

Customization

On-demand customization of scope of the report to exactly meet your needs

TARGETED MARKET VIEW

Targeted market view to provide pertinent information and save time of readers