
Disposable Water Bottle Market Research, 2033
Market Introduction and Definition
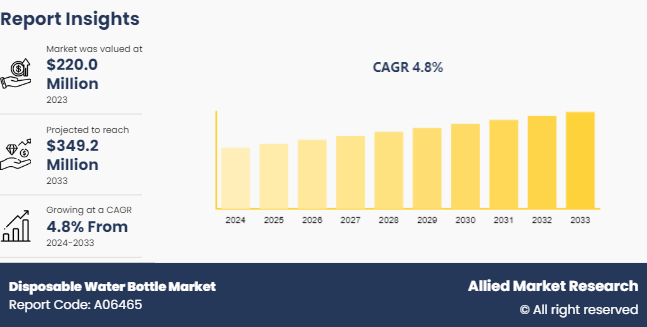
The global disposable water bottle market was valued at $220.0 million in 2023, and is projected to reach $349.2 million by 2033, growing at a CAGR of 4.8% from 2024 to 2033.The disposable water bottle market refers to the global market for single-use water bottles typically made from plastic or biodegradable materials. These bottles are designed for one-time use and are widely utilized for convenient hydration on the go. The market encompasses a variety of bottle sizes, designs, and materials, catering to different consumer preferences and needs. The popularity of disposable water bottles is driven by their convenience, affordability, and accessibility, making them important in everyday life for many consumers. However, the market is also facing increasing scrutiny owing to environmental concerns associated with plastic waste and the growing demand for sustainable alternatives. As a result, the disposable water bottle market growth is witnessing a shift towards eco-friendly materials and the development of recyclable or biodegradable options to address the environmental impact of traditional disposable water bottles.
Key Takeaways
The disposable water bottle market study covers 20 countries. The research includes a segment analysis of each country in terms of value for the projected period.
More than 1, 500 product literatures, industry releases, annual reports, and other such documents of major disposable water bottle industry participants along with authentic industry journals, trade associations' releases, and government websites have been reviewed for generating high-value industry insights.
The study integrated high-quality data, professional opinions & analysis, and critical independent perspectives. The research approach is intended to provide a balanced view of global markets and to assist stakeholders in making educated decisions to achieve their most ambitious growth objectives.
Key Market Dynamics
The growing tourism and travel industry significantly increases the demand for disposable water bottles. In 2022, the global tourism industry was valued at approximately $9.5 trillion, with an increasing number of travelers relying on convenient hydration solutions such as disposable water bottles. Tourists contribute to an estimated 25% of bottled water sales, particularly in regions where tap water quality is uncertain. Airports, train stations, and tourist attractions are key sales points, with airports alone generating around $4 million in bottled water sales annually. The rise in outdoor activities such as hiking, further drives demand. This disposable water bottle market analysis- in global travel and tourism directly correlates with increased consumption of disposable water bottles, reinforcing their market dominance.
However, environmental concerns and plastic waste issues significantly restrain the disposable water bottle market. Around 1 million plastic bottles are purchased every minute, contributing to the 300 million tons of plastic waste produced annually. With only about 9% of plastic being recycled, the environmental impact is alarming, leading to widespread public outcry and regulatory action. In response, over 60 countries have implemented bans or restrictions on single-use plastics, including disposable water bottles. As a result, 72% of consumers are now more likely to consider eco-friendly alternatives and disposable water bottle market forecast. This shift in consumer behavior and regulatory pressure challenges the growth of the disposable water bottle market, compelling manufacturers to explore sustainable options.
Partnerships with events, sports teams, or brands for promotional products are creating significant opportunities for disposable water bottle market share. The global promotional products market, valued at $15.6 million in 2023, is growing, with branded disposable water bottles being a popular choice. For instance, sporting events such as the FIFA World Cup or the Olympics can see the distribution of millions of branded bottles, enhancing brand visibility. In 2022, the U.S. alone saw over 200 million disposable water bottles distributed at various events. Partnerships with eco-conscious brands are also on the rise to pay more for sustainable products. These collaborations allow companies to enter large, engaged audiences and drive sales while aligning with the growing trend towards sustainability.
Bottled Water Consumers 2024
The disposable water bottle market size is primarily dominated by four key regions: EU27 + UK, North America, Latin America, and Asia-Pacific. The EU27 + UK and North America represent mature markets with high per capita consumption, driven by convenience, health trends, and sometimes concerns over tap water quality. Latin America shows growing consumption due to water safety issues and increasing health awareness, with Mexico being a significant market. The Asia-Pacific region, including countries such as China, India, and Japan, is experiencing rapid growth in bottled water consumption, fueled by rise in disposable incomes, urbanization, and water quality concerns.
Bottled Water Consumers 2024
Region | Consumers (Million) in 2024 |
EU27 + UK | 75 |
North America | 49 |
Latin America | 72 |
Asia-Pacific | 350 |
Total | 546 |
Market Segmentation
The disposable water bottle market is segmented into type, application, capacity, distribution channel, and region. On the basis of type, the market is divided into metal, glass, plastic and paper. As per application, the market is classified into mineral water companies, drinks companies, household use, and others. On the basis of capacity, the market is divided into smart small (15ml–100ml) , medium (100ml–500ml) , large (500ml–1000ml) , and others. As per distribution channel, the market is bifurcated into online and offline. Region wise, the market is analyzed across North America, Europe, Asia-Pacific, and LAMEA.
Regional/Country Market Outlook
Asia-Pacific holds the major share in the disposable water bottle market, driven by the region's large and rapid growth in population, urbanization, and increase in consumer demand for convenient hydration options. Countries like China and India, with populations exceeding 1.4 million, are significant contributors to the market's dominance. The region's expanding middle class and rising disposable incomes have led to increased consumption of bottled water, particularly in urban areas where concerns over water quality persist. In addition, the region's booming tourism industry, which attracted over 400 million international tourists in 2022, will further increase the demand for disposable water bottles. The combination of these factors solidifies Asia-Pacific's leading position in the market, with continued growth expected as urbanization and economic development progress.
Industry Trends
Shift Toward Sustainable Materials: With increasing environmental awareness, there is a growing trend toward the use of biodegradable and recyclable materials in disposable water bottles. Companies are investing in innovative packaging solutions, such as plant-based plastics and bottles made from 100% recycled materials, to reduce their environmental footprint.
Regulatory Pressure and Bans: Governments across the globe are implementing stricter regulations on single-use plastics, including disposable water bottles. This trend is driving companies to adopt more sustainable practices and explore alternatives to traditional plastic bottles, such as aluminum or paper-based bottles.
Growth in Premium and Functional Water Segments: The market is witnessing a rise in demand for premium and functional bottled water, which includes products with added minerals, vitamins, or enhanced flavors. Consumers are increasingly looking for health benefits and unique experiences, leading to the expansion of these segments.
Technological Innovations: Advancements in packaging technology are making it possible to produce lighter, stronger, and more sustainable bottles. Innovations such as lightweighting, which reduces the amount of plastic used in bottles, and smart packaging. It includes features such as QR codes for tracking and consumer engagement, which are gaining traction.
Impact of E-commerce: The rise of e-commerce has significantly impacted on the disposable water bottle market size and sales of bottled water. Consumers are increasingly purchasing bottled water online, driven by the convenience of home delivery and the ability to buy in bulk. This trend is particularly strong in urban areas where online grocery shopping is growing.
Brand Collaborations and Customization: Companies are increasingly partnering with brands, events, and influencers to create custom-branded bottles. These collaborations not only boost brand visibility but also appeal to consumers seeking personalized and exclusive products. This trend is especially popular in markets such as Asia-Pacific, where brand loyalty and differentiation are key drivers of consumer choice.
Competitive Landscape
The major players operating in the disposable water bottle market includes Amcor, Ball corporation, Crown Holdings, Allied Glass, Can Pack Group, Genpak, Paper Water Bottle, Mondi Group, Ardagh Group and Evergreen Packaging.
Recent Key Strategies and Developments
In April 2024, Amcor launched the first-ever one-liter carbonated soft drink stock bottle made from 100% post-consumer recycled material.
In July 2024, Ardagh launched new craft beverage glass bottles in the U.S.
Key Benefits For Stakeholders
This report provides a quantitative analysis of the market segments, current trends, estimations, and dynamics of the disposable water bottle market analysis from 2024 to 2033 to identify the prevailing disposable water bottle market opportunities.
The market research is offered along with information related to key drivers, restraints, and opportunities.
Porter's five forces analysis highlights the potency of buyers and suppliers to enable stakeholders make profit-oriented business decisions and strengthen their supplier-buyer network.
In-depth analysis of the disposable water bottle market segmentation assists to determine the prevailing market opportunities.
Major countries in each region are mapped according to their revenue contribution to the global market.
Market player positioning facilitates benchmarking and provides a clear understanding of the present position of the market players.
The report includes the analysis of the regional as well as global disposable water bottle market trends, key players, market segments, application areas, and market growth strategies.
Disposable Water Bottle Market Report Highlights
| Aspects | Details |
| Market Size By 2033 | USD 349.2 Million |
| Growth Rate | CAGR of 4.8% |
| Forecast period | 2024 - 2033 |
| Report Pages | 150 |
| By Type |
|
| By Application |
|
| By Capacity |
|
| By Distribution Channel |
|
| By Region |
|
| Key Market Players | Evergreen Packaging, Inc., Mondi Group, Can Pack Group, Ardagh Group S.A., Amcor Limited., Allied Glass Containers Ltd., Paper Water Bottle, Ball Corporation, Crown Holdings, Genpak LLC. |
The global disposable water bottle market is witnessing a shift towards eco-friendly and biodegradable materials to address environmental concerns. Simultaneously, there's an increasing adoption of smart, reusable water bottles featuring advanced technologies like temperature control and hydration tracking, catering to health-conscious consumers.
The leading application of the disposable water bottle is personal hydration on-the-go. These bottles are widely used by consumers for convenient access to drinking water during travel, outdoor activities, sports, and daily commutes. Their lightweight, portable nature and widespread availability make them a popular choice for staying hydrated in various settings.
Asia-Pacific is the largest regional market for disposable water bottle.
The global disposable water bottle market was valued at $220.0 million in 2023, and is projected to reach $349.2 million by 2033, growing at a CAGR of 4.8% from 2024 to 2033.
Amcor, Ball corporation, Crown Holdings are the top companies to hold the market share in disposable water bottle.
Loading Table Of Content...

