
Diving Equipment Market Research, 2035
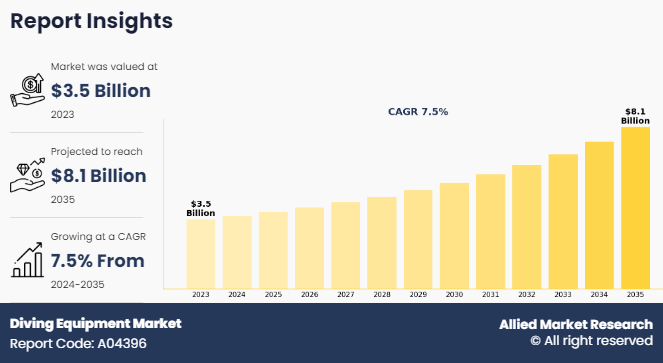
The global diving equipment market size was valued at $3.5 billion in 2023, and is projected to reach $8.1 billion by 2035, growing at a CAGR of 7.5% from 2024 to 2035. Diving equipment is utility products used by underwater divers to facilitate the process of underwater diving for various purposes such as R&D, recreational, maintenance defense, and others. The essential equipment used in diving are underwater breathing apparatus, bouncy managing devices, diving suits, and others. The growth of the diving equipment industry is attributed to a rise in industrial & construction activity coupled with disposable income and a surge in coastal tourism. Government initiatives in the development & promotion of travel & tourism coupled with the introduction of low-cost airlines have significantly impacted the global tourism industry.
The growth of the global tourism industry has a great impact on the economic growth of various destinations, especially the mass tourist places such as the coastal regions. A lot of tourists across the globe prefer to travel to the coastal regions, especially during winter. The regions that meet the three S criteria, Sea, Sand, and Sun, witness the highest diving equipment market demand among coastal visitors. Moreover, with the development of various extreme sports, recreational diving significantly gains popularity among travelers, backpackers, and honeymoon couples. This surge in demand for the recreational market is anticipated to foster the growth of the diving equipment market. However, the market growth is anticipated to face numerous hurdles owing to the rise in fatal accidents while diving and the high expense involved with the product & training. Nevertheless, the practice of a sustainable aquatic environment is anticipated to improve the marine flora & fauna and is projected to attract more recreational divers. This is anticipated to boost the growth of the diving equipment market.
KEY TAKEAWAYS FROM THE DIVING EQUIPMENT MARKET REPORT
- On the basis of type, the exposure suit segment is the fastest-growing segment with a 8.4% CAGR.
- On the basis of distribution channel, the specialty store segment was the largest in the market in 2023.
- Region-wise, Asia-Pacific was the highest revenue contributor to the market in 2023.
MARKET DYNAMICS
The market for diving equipment is a dynamic ecosystem that is influenced by several factors that affect customer desires, trends, and growth. Numerous factors, such as modern technology and environmental concerns, influence this sector.
Technological Advancements: The diving equipment industry is a dynamic ecosystem that is influenced by several factors that affect customer desires, trends, and growth. Numerous factors, such as modern technology and environmental concerns, influence this sector. Technological innovation is a major force behind development in the diving equipment market. New materials and designs are continuously being developed by manufacturers to improve the functionality and security of diving equipment. For instance, developments in materials science have produced equipment that is both lighter and more robust. Scuba divers are attracted to diving computers because they provide innovative functions like air integration and decompression algorithms.
Safety and Regulation: The market for diving equipment is heavily influenced by safety laws, rules, and regulations. In order to guarantee that their products fulfill safety regulations, manufacturers are required to follow stringent rules. Product design and availability are impacted by changes to regulations, such as those about dive masks or buoyancy control devices (BCDs). These regulations impact new products and company launches as well as diver safety.
Environmental Concerns: Demand for environmentally friendly diving equipment is being driven by the diving community's growing awareness of its influence on the environment. In response, producers are turning to sustainable materials and manufacturing techniques to produce equipment. For example, eco-aware divers are starting to favor wetsuits with lead-free weights and recyclable materials. Businesses that place a high priority on sustainability frequently have an advantage over their competitors in this dynamic market.
Demographic Shifts: Divers' demographics are shifting, which has an impact on market dynamics. As the population ages, there will be an increasing number of senior divers who could require specialized equipment, like larger dive computer screens and easy-to-use gear. In addition, the number of female divers is growing, which raises the need for equipment made specifically for females, such as more fitted BCDs and wetsuits.
E-commerce and Online Retail: The emergence of e-commerce has revolutionized the purchasing and selling of diving equipment. Online stores provide a large selection of products, affordable prices, and ease of use. In order to stay competitive, this change has caused traditional brick-and-mortar retailers to adjust and place a greater emphasis on customer experience and knowledge. Due to their online stores, manufacturers now communicate directly with customers, eliminating the need for middlemen and providing customization choices.
Adventure Tourism Trends: Dive equipment sales are directly impacted by the popularity of adventure travel and diving vacations. Demand for specialist equipment, such as drysuits for cold-water destinations or small, travel-friendly gear, is driven by divers looking for unique experiences in far-off places. Manufacturers frequently design their product lines with these adventure-seeking divers in mind, producing equipment that is portable, lightweight, and adaptable.
COVID-19 Impact: The diving equipment market was impacted greatly by the COVID-19 pandemic. Sales were impacted by restrictions on diving trips, dive facility closures for a while, and lower consumer spending. However, the pandemic also increased interest in outdoor sports and diving locally, which increased the need for beginner-friendly entry-level equipment.
Thus, a variety of factors, including advancements in technology, safety laws, environmental concerns, changing demographics, e-commerce trends, adventure tourism, and the effects of major world events like the COVID-19 pandemic, influence the diving equipment sector.
SEGMENTAL OVERVIEW
The diving equipment market is analyzed on the basis of type, distribution channel, and region. By type, the market is divided into BCD and regulator, cylinder and diving propulsion vehicle, decompression chamber, exposure suit, and accessories. On the basis of distribution channel, it is classified into a specialty store, online, and others. Region-wise, the diving equipment is analyzed across North America, Europe, Asia-Pacific, and LAMEA.
BY TYPE
By type, the exposure suit segment is anticipated to witness the highest growth and is one of the most common equipment for all divers during the diving equipment market forecast. It is known to experience the highest wear & tear. A variety of exposure suits made for different diving conditions are available on the diving equipment market. Thermal insulation and protection are offered by these suits, which include wetsuits and dry suits. Technological developments in materials such as neoprene and enhanced sealing techniques are driving the industry and meeting the demands of both leisure and professional divers.

BY DISTRIBUTION CHANNEL
By distribution channel, the specialty store is the largest diving equipment market share of this niche market. These stores are in most of the coastal towns, near the diving sites. Reputable diving stores stock a wide range of basic scuba equipment and accessories to niche products such as underwater propulsion devices. The online segment is the fastest-growing segment; online portals such as Amazon, and Alibaba are some of the leading players in this segment. The other segment includes supermarkets & sporting goods stores, such as Walmart and Decathlon.

BY REGION
The diving equipment market is experiencing a surge in popularity around the world, as more and more travelers seek to enhance their coastal vacations. The leading sites for diving are generally located in the coastal regions with warm seas. In addition, the coastal regions with rich coral reefs are anticipated to witness high diving activities. The U.S. market is the most dominant diving equipment market, and Australian diving equipment is one of the leading markets in the Asia-Pacific region. However, the ASEAN countries such as Indonesia, the Philippines, and Thailand experienced a surge in the number of diving activities.

COMPETITION ANALYSIS
The major players operating in the market focus on key market strategies, such as mergers, acquisitions, collaborations, and partnerships. They also focus on strengthening their market reach to maintain their goodwill in the ever-competitive market. Some of the key players in the market include American Underwater Products, Inc., Aqua Lung International, Johnson Outdoors Inc., Mares S.p.A, Poseidon Diving System AB, Cressi Sub s.p.a, Beuchat, AQUATEC - DUTON INDUSTRY CO., LTD., H2Odyssey, and Dive Rite.
RECENT DEVELOPMENT IN THE DIVING EQUIPMENT MARKET
- In July 2023, Poseidon Diving System AB could have launched a new line of advanced diving equipment, such as improved diving regulators or innovative underwater communication devices.
- In November 2023, Poseidon Diving System AB acquired a smaller diving equipment manufacturer to expand its product portfolio or to gain access to new markets.
Key Benefits For Stakeholders
- This report provides a quantitative analysis of the market segments, current trends, estimations, and dynamics of the diving equipment market analysis from 2023 to 2035 to identify the prevailing diving equipment market opportunities.
- The market research is offered along with information related to key drivers, restraints, and opportunities.
- Porter's five forces analysis highlights the potency of buyers and suppliers to enable stakeholders make profit-oriented business decisions and strengthen their supplier-buyer network.
- In-depth analysis of the diving equipment market segmentation assists to determine the prevailing market opportunities.
- Major countries in each region are mapped according to their revenue contribution to the global market.
- Market player positioning facilitates benchmarking and provides a clear understanding of the present position of the market players.
- The report includes the analysis of the regional as well as global diving equipment market trends, key players, market segments, application areas, and diving equipment market growth strategies.
Diving Equipment Market Report Highlights
| Aspects | Details |
| Forecast period | 2023 - 2035 |
| Report Pages | 250 |
| By Type |
|
| By Distribution Channel |
|
| By Region |
|
| Key Market Players | Aqua Lung International, Johnson Outdoors Inc., H2Odyssey, Beuchat International, Cressi Sub s.p.a, Dive Rite, Poseidon Diving System AB, AQUATEC - DUTON INDUSTRY CO., LTD., American Underwater Products, Inc., Mares S.p.A |
Analyst Review
Diving equipment is an essential and safety product, that facilitates a diver to temporarily adapt to the aquatic environment while diving underwater. Technological advancement has significantly aided the development of the market and eased the life & process of diving. Thus, the divers can dive much deeper and explore to new levels.
The global diving equipment market is expected to witness robust growth during the forecast period. This is attributed to an increase in disposable income in developing countries, a change in the lifestyle of consumers, and a surge in the demand for adventure activities such as diving. Asia-Pacific is anticipated to witness high growth as a large number of travelers, backpackers, and honeymoon couples seek the most out of their vacation by including adventure activities in their itinerary. Australia, Thailand, and the Philippines are some of the most opportunistic markets for diving equipment.
The global diving equipment market was valued at $3,488.6 million in 2023, and is projected to reach $8,131.3 million by 2035, registering a CAGR of 7.5% from 2024 to 2035.
The forecast period in the Diving equipment market report is 2024 to 2035.
The base year calculated in the Diving equipment market report is 2023.
The top companies analyzed for the Diving equipment market report are American Underwater Products, Inc., Aqua Lung International, Johnson Outdoors Inc., Mares S.p.A, Poseidon Diving System AB, Cressi Sub s.p.a, Beuchat, AQUATEC - DUTON INDUSTRY CO., LTD., H2Odyssey, and Dive Rite.
The BCD & regulator segment is the most influential segment in the Diving equipment market report.
Asia-Pacific holds the maximum market share of the Diving equipment market.
The company profile has been selected on the basis of key developments such as partnerships, mergers, and acquisitions.
The market value of the Diving equipment market in 2023 was $3,488.6 million.
Loading Table Of Content...
Loading Research Methodology...

