0
2022
Drone Logistics Market

Drone logistics Market

by Component (Hardware, Software, Services), by Application (Warehouse and Storage Management, Transportation Management), by End-Use (Commercial, Military): Global Opportunity Analysis and Industry Forecast, 2021-2031

Report Code: A10272
Jul 2022 | Pages: 272
Tables: 158
Charts: 59
  • Formats*:

  • pdf

    Single User License, Five User
    License & Enterprise User License

  • xls

    Data Pack Excel License

  • ppt

    It comes with the additional cost
    of $2500.00 contact sales.


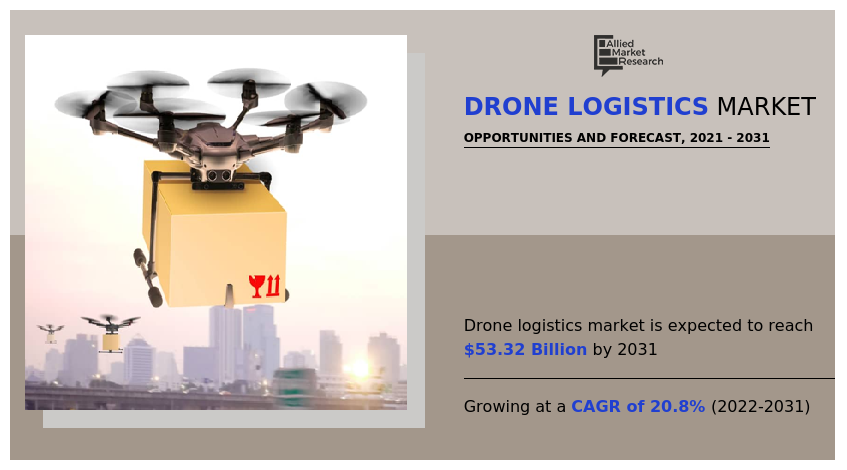
The global drone logistics market was valued at $8.20 billion in 2021, and is projected to reach $53.32 billion by 2031, growing at a CAGR of 20.8% from 2022 to 2031.

A drone also referred as unmanned aerial vehicle or unmanned aircraft systems is an aerial vehicle that can be operated autonomously or remotely. In recent years, drones have become very popular and are being utilized in several sectors such as defense, aerial photography, logistics, and others. In context of logistics, drone logistics is a service or solution for managing transportation and warehousing of goods in a supply chain from source to destination.
The COVID-19 pandemic wreaked havoc on social and economic systems all across the globe. The tragic loss of human life and the emergence of unprecedented challenges to the world of labor, food systems, and public health have resulted in significant catastrophic damages to societies and enterprises all across the globe. The pandemic has also posed an existential danger to millions of businesses, as well as an unemployment catastrophe for billions of people around the world. However, drone services have been developed and utilized by drone service providers during the COVID-19 pandemic, including lab sample pick-up and delivery and transportation of medical supplies to reduce transportation times and minimize infection exposure, aerial spraying of public areas to disinfect potentially contaminated areas and public space monitoring and guaranty. In the event of the COVID-19 pandemic, these applications have increased demand for different types of drones to capture ground activities from the sky. Moreover, post-pandemic, several logistics companies are focusing on developing a network for last mile deliveries based on drones, which in turn is expected to boost the growth of the drone logistics market during the forecast period.

Drone Logistics Market, Drone Logistics Industry, Drone Logistics Market Analysis, Drone Logistics Market Size

Growth of the drone logistics industry has propelled, owing to rise in demand for time-efficient delivery service and rise in demand for drones in last mile delivery. However, cybersecurity issues associated with drones and short flying duration are the factors that hamper the drone logistics market size. Furthermore, revamped government regulatory framework is the factor expected to offer growth opportunities during the forecast period.

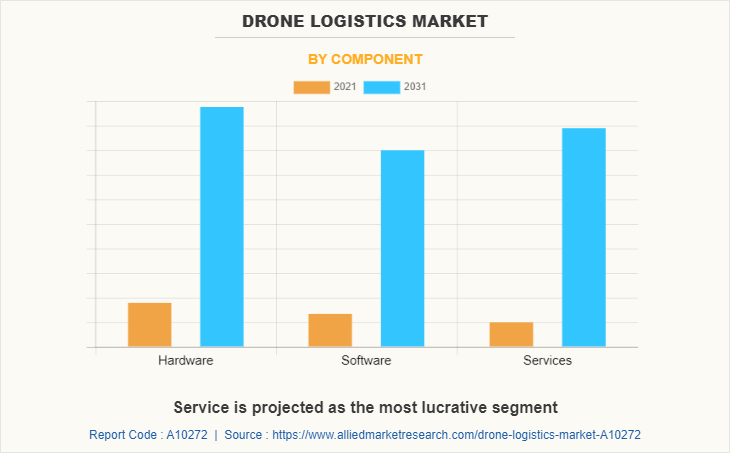
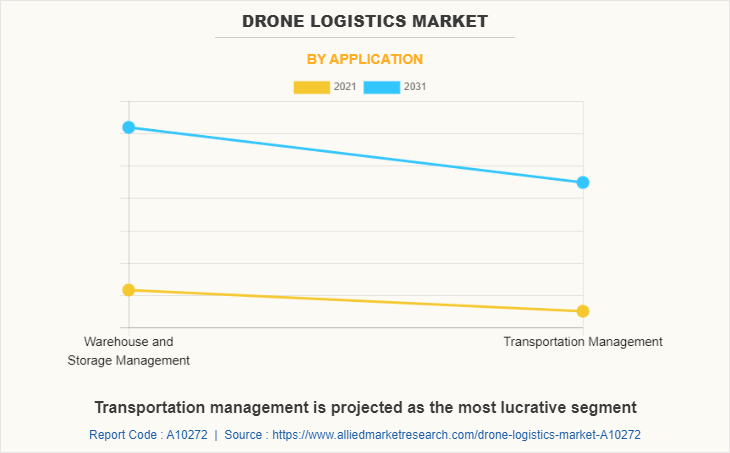
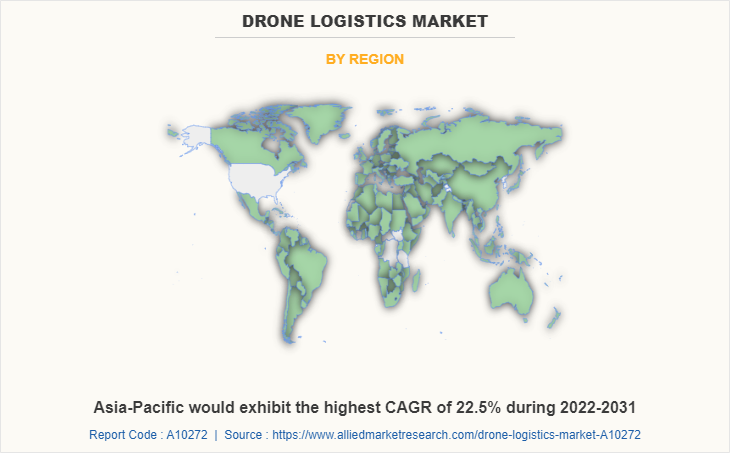
The drone logistics market is segmented on the basis of component, application, end use, and region. By component, the market is categorized into hardware, software, and services. By application, it is fragmented into warehouse & storage management, and transportation management. By end use, it is classified into commercial and military. By region, the market is analyzed across North America, Europe, Asia-Pacific, and LAMEA.

Some leading companies considered in the drone logistics market analysis comprises Amazon.com Inc., Deutsche Post DHL Group, Drone Delivery Canada, DroneScan, FedEx, Flytrex Inc., Hardis Group, Infinium Robotics, Matternet, Pinc Solutions, United Parcel Service of America, Inc., Wing Aviation LLC, Workhorse Group, Wingcopter, and Zipline International Inc.
Drone logistics Market

Rise in demand for time-efficient delivery service

The global logistics and e-commerce market has experienced growth in the recent years. The growth in e-commerce and logistics industries drives demand for time-efficient delivery solutions for transportation of critical goods across the globe. For instance, in April 2021, ANA Holdings Inc. and Wingcopter announced a partnership for accelerating development of vital pharmaceuticals and other consumer products drone delivery infrastructure. The partnership is aimed at building a drone delivery infrastructure across Japan.

The major e-commerce and logistics giants, namely, Amazon and DHL have launched drone delivery systems to make quick deliveries and transport packages to places inaccessible by conventional transport systems. For instance, in May 2019, DHL Express and EHang entered into a strategic partnership for launching an intelligent and fully automated smart drone delivery solution in the urban areas of China. The smart drone delivery solution will offer a less energy-consuming, efficient, and cost-effective autonomous delivery service in China.

The aviation administration around the world is approving commercial delivery companies for operating drones to provide the delivery service. For instance, Federal Aviation Administration approved Alphabet-owned startup, Wing, for making commercial deliveries through drones in the U.S. in April 2019. The approval will facilitate Wing in making drone-based deliveries in Virginia. In addition, the advantages such as safe and efficient operations associated with drone delivery solutions promote the adoption of drones for providing delivery and investment for developing drone delivery systems by commercial and logistics organizations across the globe. The increase in the adoption of drone delivery systems to enhance the efficiency and increase the cost-effectiveness of the delivery systems are the factors that propels the growth of drone delivery during the forecast period.
Drone logistics Market

Rise in demand for drones in last mile delivery

Logistics is the backbone of every economy, but the pandemic outbreak has disrupted the supply chains globally. Last mile delivery process of supply chain operation has been affected, owing to which retailers are struggling to meet the growing customer demands for expedited deliveries. Therefore, several logistics stakeholders are exploring drone technology to reduce operational costs, overcome traffic bottlenecks and quell vehicular emissions while satisfying the customer appetite for on-demand and instant delivery.

Drones are ideal for last-mile deliveries, owing to their compact size, quick speed, low operational costs and reduced environmental impact. Therefore, e-commerce giants such as Amazon and Walmart are trying to penetrate the rural and remote areas with drone deliveries.

Moreover, owing to enormous potential of last mile drone deliveries, drones are being deployed all across the globe for delivering medical supplies, vaccines, groceries and food items. The use cases of drone for last mile deliveries are rising each day across the globe. For instance, drone delivery startups TechEagle is partnering with Indian state governments to deliver COVID-19 vaccines, medical essentials and others.

Hence, all the above-mentioned factors collectively result in increase in demand for drones for the logistics industry. Thus, rise in demand for drones in last mile delivery is the factor that drives growth of the drone logistics industry.
Drone logistics Market

The drone logistics market is segmented into Component, Application and End-Use.

Key Benefits For Stakeholders

  • This report provides a quantitative analysis of the market segments, current trends, estimations, and dynamics of the drone logistics & transportation market analysis from 2021 to 2031 to identify the prevailing drone logistics market opportunities.
  • The market research is offered along with information related to key drivers, restraints, and opportunities.
  • Porter's five forces analysis highlights the potency of buyers and suppliers to enable stakeholders make profit-oriented business decisions and strengthen their supplier-buyer network.
  • In-depth analysis of the drone logistics industry segmentation assists to determine the prevailing market opportunities.
  • Major countries in each region are mapped according to their revenue contribution to the global market.
  • Market player positioning facilitates benchmarking and provides a clear understanding of the present position of the market players.
  • The report includes the analysis of the regional as well as global drone logistics market trends, key players, market segments, application areas, and market growth strategies.

Drone logistics Market Report Highlights

Aspects Details
By Component
  • Hardware
  • Software
  • Services
By Application
  • Warehouse and Storage Management
  • Transportation Management
By End-Use
  • Commercial
  • Military
By Region
  • North America  (U.S., Canada, Mexico)
  • Europe  (Germany, UK, France, Italy, Rest of Europe)
  • Asia-Pacific  (China, Japan, India, South Korea, Rest of Asia-Pacific)
  • LAMEA  (Latin America, Middle East, Africa)
Key Market Players Matternet, Inc., Infinium Robotics, Flytrex Inc., PINC Solutions, Wing Aviation LLC, Amazon.com, Inc., FedEx Corporation, United Parcel Service of America, Inc., Hardis Group, Wingcopter GmbH, Workhorse Group Incorporated, Drone Delivery Canada, DroneScan, Deutsche Post DHL Group, Zipline International Inc.
 
  • CHAPTER 1:INTRODUCTION

    • 1.1.Report description

    • 1.2.Key market segments

    • 1.3.Key benefits to the stakeholders

    • 1.4.Research Methodology

      • 1.4.1.Secondary research

      • 1.4.2.Primary research

      • 1.4.3.Analyst tools and models

  • CHAPTER 2:EXECUTIVE SUMMARY

    • 2.1.Key findings of the study

    • 2.2.CXO Perspective

  • CHAPTER 3:MARKET OVERVIEW

    • 3.1.Market definition and scope

    • 3.2.Key findings

      • 3.2.1.Top investment pockets

    • 3.3.Porter’s five forces analysis

    • 3.4.Top player positioning

    • 3.5.Market dynamics

      • 3.5.1.Drivers

      • 3.5.2.Restraints

      • 3.5.3.Opportunities

    • 3.6.COVID-19 Impact Analysis on the market

  • CHAPTER 4: DRONE LOGISTICS MARKET, BY COMPONENT

    • 4.1 Overview

      • 4.1.1 Market size and forecast

    • 4.2 Hardware

      • 4.2.1 Key market trends, growth factors and opportunities

      • 4.2.2 Market size and forecast, by region

      • 4.2.3 Market analysis by country

    • 4.3 Software

      • 4.3.1 Key market trends, growth factors and opportunities

      • 4.3.2 Market size and forecast, by region

      • 4.3.3 Market analysis by country

    • 4.4 Services

      • 4.4.1 Key market trends, growth factors and opportunities

      • 4.4.2 Market size and forecast, by region

      • 4.4.3 Market analysis by country

  • CHAPTER 5: DRONE LOGISTICS MARKET, BY APPLICATION

    • 5.1 Overview

      • 5.1.1 Market size and forecast

    • 5.2 Warehouse and Storage Management

      • 5.2.1 Key market trends, growth factors and opportunities

      • 5.2.2 Market size and forecast, by region

      • 5.2.3 Market analysis by country

    • 5.3 Transportation Management

      • 5.3.1 Key market trends, growth factors and opportunities

      • 5.3.2 Market size and forecast, by region

      • 5.3.3 Market analysis by country

  • CHAPTER 6: DRONE LOGISTICS MARKET, BY END-USE

    • 6.1 Overview

      • 6.1.1 Market size and forecast

    • 6.2 Commercial

      • 6.2.1 Key market trends, growth factors and opportunities

      • 6.2.2 Market size and forecast, by region

      • 6.2.3 Market analysis by country

    • 6.3 Military

      • 6.3.1 Key market trends, growth factors and opportunities

      • 6.3.2 Market size and forecast, by region

      • 6.3.3 Market analysis by country

  • CHAPTER 7: DRONE LOGISTICS MARKET, BY REGION

    • 7.1 Overview

      • 7.1.1 Market size and forecast

    • 7.2 North America

      • 7.2.1 Key trends and opportunities

      • 7.2.2 North America Market size and forecast, by Component

      • 7.2.3 North America Market size and forecast, by Application

      • 7.2.4 North America Market size and forecast, by End-Use

      • 7.2.5 North America Market size and forecast, by country

        • 7.2.5.1 U.S.
          • 7.2.5.1.1 Market size and forecast, by Component
          • 7.2.5.1.2 Market size and forecast, by Application
          • 7.2.5.1.3 Market size and forecast, by End-Use
        • 7.2.5.2 Canada
          • 7.2.5.2.1 Market size and forecast, by Component
          • 7.2.5.2.2 Market size and forecast, by Application
          • 7.2.5.2.3 Market size and forecast, by End-Use
        • 7.2.5.3 Mexico
          • 7.2.5.3.1 Market size and forecast, by Component
          • 7.2.5.3.2 Market size and forecast, by Application
          • 7.2.5.3.3 Market size and forecast, by End-Use
    • 7.3 Europe

      • 7.3.1 Key trends and opportunities

      • 7.3.2 Europe Market size and forecast, by Component

      • 7.3.3 Europe Market size and forecast, by Application

      • 7.3.4 Europe Market size and forecast, by End-Use

      • 7.3.5 Europe Market size and forecast, by country

        • 7.3.5.1 Germany
          • 7.3.5.1.1 Market size and forecast, by Component
          • 7.3.5.1.2 Market size and forecast, by Application
          • 7.3.5.1.3 Market size and forecast, by End-Use
        • 7.3.5.2 UK
          • 7.3.5.2.1 Market size and forecast, by Component
          • 7.3.5.2.2 Market size and forecast, by Application
          • 7.3.5.2.3 Market size and forecast, by End-Use
        • 7.3.5.3 France
          • 7.3.5.3.1 Market size and forecast, by Component
          • 7.3.5.3.2 Market size and forecast, by Application
          • 7.3.5.3.3 Market size and forecast, by End-Use
        • 7.3.5.4 Italy
          • 7.3.5.4.1 Market size and forecast, by Component
          • 7.3.5.4.2 Market size and forecast, by Application
          • 7.3.5.4.3 Market size and forecast, by End-Use
        • 7.3.5.5 Rest of Europe
          • 7.3.5.5.1 Market size and forecast, by Component
          • 7.3.5.5.2 Market size and forecast, by Application
          • 7.3.5.5.3 Market size and forecast, by End-Use
    • 7.4 Asia-Pacific

      • 7.4.1 Key trends and opportunities

      • 7.4.2 Asia-Pacific Market size and forecast, by Component

      • 7.4.3 Asia-Pacific Market size and forecast, by Application

      • 7.4.4 Asia-Pacific Market size and forecast, by End-Use

      • 7.4.5 Asia-Pacific Market size and forecast, by country

        • 7.4.5.1 China
          • 7.4.5.1.1 Market size and forecast, by Component
          • 7.4.5.1.2 Market size and forecast, by Application
          • 7.4.5.1.3 Market size and forecast, by End-Use
        • 7.4.5.2 Japan
          • 7.4.5.2.1 Market size and forecast, by Component
          • 7.4.5.2.2 Market size and forecast, by Application
          • 7.4.5.2.3 Market size and forecast, by End-Use
        • 7.4.5.3 India
          • 7.4.5.3.1 Market size and forecast, by Component
          • 7.4.5.3.2 Market size and forecast, by Application
          • 7.4.5.3.3 Market size and forecast, by End-Use
        • 7.4.5.4 South Korea
          • 7.4.5.4.1 Market size and forecast, by Component
          • 7.4.5.4.2 Market size and forecast, by Application
          • 7.4.5.4.3 Market size and forecast, by End-Use
        • 7.4.5.5 Rest of Asia-Pacific
          • 7.4.5.5.1 Market size and forecast, by Component
          • 7.4.5.5.2 Market size and forecast, by Application
          • 7.4.5.5.3 Market size and forecast, by End-Use
    • 7.5 LAMEA

      • 7.5.1 Key trends and opportunities

      • 7.5.2 LAMEA Market size and forecast, by Component

      • 7.5.3 LAMEA Market size and forecast, by Application

      • 7.5.4 LAMEA Market size and forecast, by End-Use

      • 7.5.5 LAMEA Market size and forecast, by country

        • 7.5.5.1 Latin America
          • 7.5.5.1.1 Market size and forecast, by Component
          • 7.5.5.1.2 Market size and forecast, by Application
          • 7.5.5.1.3 Market size and forecast, by End-Use
        • 7.5.5.2 Middle East
          • 7.5.5.2.1 Market size and forecast, by Component
          • 7.5.5.2.2 Market size and forecast, by Application
          • 7.5.5.2.3 Market size and forecast, by End-Use
        • 7.5.5.3 Africa
          • 7.5.5.3.1 Market size and forecast, by Component
          • 7.5.5.3.2 Market size and forecast, by Application
          • 7.5.5.3.3 Market size and forecast, by End-Use
  • CHAPTER 8: COMPANY LANDSCAPE

    • 8.1. Introduction

    • 8.2. Top winning strategies

    • 8.3. Product Mapping of Top 10 Player

    • 8.4. Competitive Dashboard

    • 8.5. Competitive Heatmap

    • 8.6. Key developments

  • CHAPTER 9: COMPANY PROFILES

    • 9.1 Deutsche Post DHL Group

      • 9.1.1 Company overview

      • 9.1.2 Company snapshot

      • 9.1.3 Operating business segments

      • 9.1.4 Product portfolio

      • 9.1.5 Business performance

      • 9.1.6 Key strategic moves and developments

    • 9.2 Drone Delivery Canada

      • 9.2.1 Company overview

      • 9.2.2 Company snapshot

      • 9.2.3 Operating business segments

      • 9.2.4 Product portfolio

      • 9.2.5 Business performance

      • 9.2.6 Key strategic moves and developments

    • 9.3 DroneScan

      • 9.3.1 Company overview

      • 9.3.2 Company snapshot

      • 9.3.3 Operating business segments

      • 9.3.4 Product portfolio

      • 9.3.5 Business performance

      • 9.3.6 Key strategic moves and developments

    • 9.4 FedEx Corporation

      • 9.4.1 Company overview

      • 9.4.2 Company snapshot

      • 9.4.3 Operating business segments

      • 9.4.4 Product portfolio

      • 9.4.5 Business performance

      • 9.4.6 Key strategic moves and developments

    • 9.5 Flytrex Inc.

      • 9.5.1 Company overview

      • 9.5.2 Company snapshot

      • 9.5.3 Operating business segments

      • 9.5.4 Product portfolio

      • 9.5.5 Business performance

      • 9.5.6 Key strategic moves and developments

    • 9.6 Hardis Group

      • 9.6.1 Company overview

      • 9.6.2 Company snapshot

      • 9.6.3 Operating business segments

      • 9.6.4 Product portfolio

      • 9.6.5 Business performance

      • 9.6.6 Key strategic moves and developments

    • 9.7 Infinium Robotics

      • 9.7.1 Company overview

      • 9.7.2 Company snapshot

      • 9.7.3 Operating business segments

      • 9.7.4 Product portfolio

      • 9.7.5 Business performance

      • 9.7.6 Key strategic moves and developments

    • 9.8 Matternet, Inc.

      • 9.8.1 Company overview

      • 9.8.2 Company snapshot

      • 9.8.3 Operating business segments

      • 9.8.4 Product portfolio

      • 9.8.5 Business performance

      • 9.8.6 Key strategic moves and developments

    • 9.9 PINC Solutions

      • 9.9.1 Company overview

      • 9.9.2 Company snapshot

      • 9.9.3 Operating business segments

      • 9.9.4 Product portfolio

      • 9.9.5 Business performance

      • 9.9.6 Key strategic moves and developments

    • 9.10 Amazon.com, Inc.

      • 9.10.1 Company overview

      • 9.10.2 Company snapshot

      • 9.10.3 Operating business segments

      • 9.10.4 Product portfolio

      • 9.10.5 Business performance

      • 9.10.6 Key strategic moves and developments

    • 9.11 United Parcel Service of America, Inc.

      • 9.11.1 Company overview

      • 9.11.2 Company snapshot

      • 9.11.3 Operating business segments

      • 9.11.4 Product portfolio

      • 9.11.5 Business performance

      • 9.11.6 Key strategic moves and developments

    • 9.12 Wing Aviation LLC

      • 9.12.1 Company overview

      • 9.12.2 Company snapshot

      • 9.12.3 Operating business segments

      • 9.12.4 Product portfolio

      • 9.12.5 Business performance

      • 9.12.6 Key strategic moves and developments

    • 9.13 Workhorse Group Incorporated

      • 9.13.1 Company overview

      • 9.13.2 Company snapshot

      • 9.13.3 Operating business segments

      • 9.13.4 Product portfolio

      • 9.13.5 Business performance

      • 9.13.6 Key strategic moves and developments

    • 9.14 Zipline International Inc.

      • 9.14.1 Company overview

      • 9.14.2 Company snapshot

      • 9.14.3 Operating business segments

      • 9.14.4 Product portfolio

      • 9.14.5 Business performance

      • 9.14.6 Key strategic moves and developments

    • 9.15 Wingcopter GmbH

      • 9.15.1 Company overview

      • 9.15.2 Company snapshot

      • 9.15.3 Operating business segments

      • 9.15.4 Product portfolio

      • 9.15.5 Business performance

      • 9.15.6 Key strategic moves and developments

  • LIST OF TABLES

  • TABLE 1. GLOBAL DRONE LOGISTICS MARKET, BY COMPONENT, 2021-2031 ($MILLION)
    TABLE 2. DRONE LOGISTICS MARKET SIZE, FOR HARDWARE, BY REGION, 2021-2031 ($MILLION)
    TABLE 3. DRONE LOGISTICS MARKET FOR HARDWARE, BY COUNTRY, 2021-2031 ($MILLION)
    TABLE 4. DRONE LOGISTICS MARKET SIZE, FOR SOFTWARE, BY REGION, 2021-2031 ($MILLION)
    TABLE 5. DRONE LOGISTICS MARKET FOR SOFTWARE, BY COUNTRY, 2021-2031 ($MILLION)
    TABLE 6. DRONE LOGISTICS MARKET SIZE, FOR SERVICES, BY REGION, 2021-2031 ($MILLION)
    TABLE 7. DRONE LOGISTICS MARKET FOR SERVICES, BY COUNTRY, 2021-2031 ($MILLION)
    TABLE 8. GLOBAL DRONE LOGISTICS MARKET, BY APPLICATION, 2021-2031 ($MILLION)
    TABLE 9. DRONE LOGISTICS MARKET SIZE, FOR WAREHOUSE AND STORAGE MANAGEMENT, BY REGION, 2021-2031 ($MILLION)
    TABLE 10. DRONE LOGISTICS MARKET FOR WAREHOUSE AND STORAGE MANAGEMENT, BY COUNTRY, 2021-2031 ($MILLION)
    TABLE 11. DRONE LOGISTICS MARKET SIZE, FOR TRANSPORTATION MANAGEMENT, BY REGION, 2021-2031 ($MILLION)
    TABLE 12. DRONE LOGISTICS MARKET FOR TRANSPORTATION MANAGEMENT, BY COUNTRY, 2021-2031 ($MILLION)
    TABLE 13. GLOBAL DRONE LOGISTICS MARKET, BY END-USE, 2021-2031 ($MILLION)
    TABLE 14. DRONE LOGISTICS MARKET SIZE, FOR COMMERCIAL, BY REGION, 2021-2031 ($MILLION)
    TABLE 15. DRONE LOGISTICS MARKET FOR COMMERCIAL, BY COUNTRY, 2021-2031 ($MILLION)
    TABLE 16. DRONE LOGISTICS MARKET SIZE, FOR MILITARY, BY REGION, 2021-2031 ($MILLION)
    TABLE 17. DRONE LOGISTICS MARKET FOR MILITARY, BY COUNTRY, 2021-2031 ($MILLION)
    TABLE 18. DRONE LOGISTICS MARKET, BY REGION, 2021-2031 ($MILLION)
    TABLE 19. NORTH AMERICA DRONE LOGISTICS MARKET, BY COMPONENT, 2021-2031 ($MILLION)
    TABLE 20. NORTH AMERICA DRONE LOGISTICS MARKET, BY APPLICATION, 2021-2031 ($MILLION)
    TABLE 21. NORTH AMERICA DRONE LOGISTICS MARKET, BY END-USE, 2021-2031 ($MILLION)
    TABLE 22. NORTH AMERICA DRONE LOGISTICS MARKET, BY COUNTRY, 2021-2031 ($MILLION)
    TABLE 23. U.S. DRONE LOGISTICS MARKET, BY COMPONENT, 2021-2031 ($MILLION)
    TABLE 24. U.S. DRONE LOGISTICS MARKET, BY APPLICATION, 2021-2031 ($MILLION)
    TABLE 25. U.S. DRONE LOGISTICS MARKET, BY END-USE, 2021-2031 ($MILLION)
    TABLE 26. CANADA DRONE LOGISTICS MARKET, BY COMPONENT, 2021-2031 ($MILLION)
    TABLE 27. CANADA DRONE LOGISTICS MARKET, BY APPLICATION, 2021-2031 ($MILLION)
    TABLE 28. CANADA DRONE LOGISTICS MARKET, BY END-USE, 2021-2031 ($MILLION)
    TABLE 29. MEXICO DRONE LOGISTICS MARKET, BY COMPONENT, 2021-2031 ($MILLION)
    TABLE 30. MEXICO DRONE LOGISTICS MARKET, BY APPLICATION, 2021-2031 ($MILLION)
    TABLE 31. MEXICO DRONE LOGISTICS MARKET, BY END-USE, 2021-2031 ($MILLION)
    TABLE 32. EUROPE DRONE LOGISTICS MARKET, BY COMPONENT, 2021-2031 ($MILLION)
    TABLE 33. EUROPE DRONE LOGISTICS MARKET, BY APPLICATION, 2021-2031 ($MILLION)
    TABLE 34. EUROPE DRONE LOGISTICS MARKET, BY END-USE, 2021-2031 ($MILLION)
    TABLE 35. EUROPE DRONE LOGISTICS MARKET, BY COUNTRY, 2021-2031 ($MILLION)
    TABLE 36. GERMANY DRONE LOGISTICS MARKET, BY COMPONENT, 2021-2031 ($MILLION)
    TABLE 37. GERMANY DRONE LOGISTICS MARKET, BY APPLICATION, 2021-2031 ($MILLION)
    TABLE 38. GERMANY DRONE LOGISTICS MARKET, BY END-USE, 2021-2031 ($MILLION)
    TABLE 39. UK DRONE LOGISTICS MARKET, BY COMPONENT, 2021-2031 ($MILLION)
    TABLE 40. UK DRONE LOGISTICS MARKET, BY APPLICATION, 2021-2031 ($MILLION)
    TABLE 41. UK DRONE LOGISTICS MARKET, BY END-USE, 2021-2031 ($MILLION)
    TABLE 42. FRANCE DRONE LOGISTICS MARKET, BY COMPONENT, 2021-2031 ($MILLION)
    TABLE 43. FRANCE DRONE LOGISTICS MARKET, BY APPLICATION, 2021-2031 ($MILLION)
    TABLE 44. FRANCE DRONE LOGISTICS MARKET, BY END-USE, 2021-2031 ($MILLION)
    TABLE 45. ITALY DRONE LOGISTICS MARKET, BY COMPONENT, 2021-2031 ($MILLION)
    TABLE 46. ITALY DRONE LOGISTICS MARKET, BY APPLICATION, 2021-2031 ($MILLION)
    TABLE 47. ITALY DRONE LOGISTICS MARKET, BY END-USE, 2021-2031 ($MILLION)
    TABLE 48. REST OF EUROPE DRONE LOGISTICS MARKET, BY COMPONENT, 2021-2031 ($MILLION)
    TABLE 49. REST OF EUROPE DRONE LOGISTICS MARKET, BY APPLICATION, 2021-2031 ($MILLION)
    TABLE 50. REST OF EUROPE DRONE LOGISTICS MARKET, BY END-USE, 2021-2031 ($MILLION)
    TABLE 51. ASIA-PACIFIC DRONE LOGISTICS MARKET, BY COMPONENT, 2021-2031 ($MILLION)
    TABLE 52. ASIA-PACIFIC DRONE LOGISTICS MARKET, BY APPLICATION, 2021-2031 ($MILLION)
    TABLE 53. ASIA-PACIFIC DRONE LOGISTICS MARKET, BY END-USE, 2021-2031 ($MILLION)
    TABLE 54. ASIA-PACIFIC DRONE LOGISTICS MARKET, BY COUNTRY, 2021-2031 ($MILLION)
    TABLE 55. CHINA DRONE LOGISTICS MARKET, BY COMPONENT, 2021-2031 ($MILLION)
    TABLE 56. CHINA DRONE LOGISTICS MARKET, BY APPLICATION, 2021-2031 ($MILLION)
    TABLE 57. CHINA DRONE LOGISTICS MARKET, BY END-USE, 2021-2031 ($MILLION)
    TABLE 58. JAPAN DRONE LOGISTICS MARKET, BY COMPONENT, 2021-2031 ($MILLION)
    TABLE 59. JAPAN DRONE LOGISTICS MARKET, BY APPLICATION, 2021-2031 ($MILLION)
    TABLE 60. JAPAN DRONE LOGISTICS MARKET, BY END-USE, 2021-2031 ($MILLION)
    TABLE 61. INDIA DRONE LOGISTICS MARKET, BY COMPONENT, 2021-2031 ($MILLION)
    TABLE 62. INDIA DRONE LOGISTICS MARKET, BY APPLICATION, 2021-2031 ($MILLION)
    TABLE 63. INDIA DRONE LOGISTICS MARKET, BY END-USE, 2021-2031 ($MILLION)
    TABLE 64. SOUTH KOREA DRONE LOGISTICS MARKET, BY COMPONENT, 2021-2031 ($MILLION)
    TABLE 65. SOUTH KOREA DRONE LOGISTICS MARKET, BY APPLICATION, 2021-2031 ($MILLION)
    TABLE 66. SOUTH KOREA DRONE LOGISTICS MARKET, BY END-USE, 2021-2031 ($MILLION)
    TABLE 67. REST OF ASIA-PACIFIC DRONE LOGISTICS MARKET, BY COMPONENT, 2021-2031 ($MILLION)
    TABLE 68. REST OF ASIA-PACIFIC DRONE LOGISTICS MARKET, BY APPLICATION, 2021-2031 ($MILLION)
    TABLE 69. REST OF ASIA-PACIFIC DRONE LOGISTICS MARKET, BY END-USE, 2021-2031 ($MILLION)
    TABLE 70. LAMEA DRONE LOGISTICS MARKET, BY COMPONENT, 2021-2031 ($MILLION)
    TABLE 71. LAMEA DRONE LOGISTICS MARKET, BY APPLICATION, 2021-2031 ($MILLION)
    TABLE 72. LAMEA DRONE LOGISTICS MARKET, BY END-USE, 2021-2031 ($MILLION)
    TABLE 73. LAMEA DRONE LOGISTICS MARKET, BY COUNTRY, 2021-2031 ($MILLION)
    TABLE 74. LATIN AMERICA DRONE LOGISTICS MARKET, BY COMPONENT, 2021-2031 ($MILLION)
    TABLE 75. LATIN AMERICA DRONE LOGISTICS MARKET, BY APPLICATION, 2021-2031 ($MILLION)
    TABLE 76. LATIN AMERICA DRONE LOGISTICS MARKET, BY END-USE, 2021-2031 ($MILLION)
    TABLE 77. MIDDLE EAST DRONE LOGISTICS MARKET, BY COMPONENT, 2021-2031 ($MILLION)
    TABLE 78. MIDDLE EAST DRONE LOGISTICS MARKET, BY APPLICATION, 2021-2031 ($MILLION)
    TABLE 79. MIDDLE EAST DRONE LOGISTICS MARKET, BY END-USE, 2021-2031 ($MILLION)
    TABLE 80. AFRICA DRONE LOGISTICS MARKET, BY COMPONENT, 2021-2031 ($MILLION)
    TABLE 81. AFRICA DRONE LOGISTICS MARKET, BY APPLICATION, 2021-2031 ($MILLION)
    TABLE 82. AFRICA DRONE LOGISTICS MARKET, BY END-USE, 2021-2031 ($MILLION)
    TABLE 83.DEUTSCHE POST DHL GROUP: COMPANY SNAPSHOT
    TABLE 84.DEUTSCHE POST DHL GROUP: OPERATING SEGMENTS
    TABLE 85.DEUTSCHE POST DHL GROUP: PRODUCT PORTFOLIO
    TABLE 86.DEUTSCHE POST DHL GROUP: NET SALES,
    TABLE 87.DEUTSCHE POST DHL GROUP: KEY STRATERGIES
    TABLE 88.DRONE DELIVERY CANADA: COMPANY SNAPSHOT
    TABLE 89.DRONE DELIVERY CANADA: OPERATING SEGMENTS
    TABLE 90.DRONE DELIVERY CANADA: PRODUCT PORTFOLIO
    TABLE 91.DRONE DELIVERY CANADA: NET SALES,
    TABLE 92.DRONE DELIVERY CANADA: KEY STRATERGIES
    TABLE 93.DRONESCAN: COMPANY SNAPSHOT
    TABLE 94.DRONESCAN: OPERATING SEGMENTS
    TABLE 95.DRONESCAN: PRODUCT PORTFOLIO
    TABLE 96.DRONESCAN: NET SALES,
    TABLE 97.DRONESCAN: KEY STRATERGIES
    TABLE 98.FEDEX CORPORATION: COMPANY SNAPSHOT
    TABLE 99.FEDEX CORPORATION: OPERATING SEGMENTS
    TABLE 100.FEDEX CORPORATION: PRODUCT PORTFOLIO
    TABLE 101.FEDEX CORPORATION: NET SALES,
    TABLE 102.FEDEX CORPORATION: KEY STRATERGIES
    TABLE 103.FLYTREX INC.: COMPANY SNAPSHOT
    TABLE 104.FLYTREX INC.: OPERATING SEGMENTS
    TABLE 105.FLYTREX INC.: PRODUCT PORTFOLIO
    TABLE 106.FLYTREX INC.: NET SALES,
    TABLE 107.FLYTREX INC.: KEY STRATERGIES
    TABLE 108.HARDIS GROUP: COMPANY SNAPSHOT
    TABLE 109.HARDIS GROUP: OPERATING SEGMENTS
    TABLE 110.HARDIS GROUP: PRODUCT PORTFOLIO
    TABLE 111.HARDIS GROUP: NET SALES,
    TABLE 112.HARDIS GROUP: KEY STRATERGIES
    TABLE 113.INFINIUM ROBOTICS: COMPANY SNAPSHOT
    TABLE 114.INFINIUM ROBOTICS: OPERATING SEGMENTS
    TABLE 115.INFINIUM ROBOTICS: PRODUCT PORTFOLIO
    TABLE 116.INFINIUM ROBOTICS: NET SALES,
    TABLE 117.INFINIUM ROBOTICS: KEY STRATERGIES
    TABLE 118.MATTERNET, INC.: COMPANY SNAPSHOT
    TABLE 119.MATTERNET, INC.: OPERATING SEGMENTS
    TABLE 120.MATTERNET, INC.: PRODUCT PORTFOLIO
    TABLE 121.MATTERNET, INC.: NET SALES,
    TABLE 122.MATTERNET, INC.: KEY STRATERGIES
    TABLE 123.PINC SOLUTIONS: COMPANY SNAPSHOT
    TABLE 124.PINC SOLUTIONS: OPERATING SEGMENTS
    TABLE 125.PINC SOLUTIONS: PRODUCT PORTFOLIO
    TABLE 126.PINC SOLUTIONS: NET SALES,
    TABLE 127.PINC SOLUTIONS: KEY STRATERGIES
    TABLE 128.AMAZON.COM, INC.: COMPANY SNAPSHOT
    TABLE 129.AMAZON.COM, INC.: OPERATING SEGMENTS
    TABLE 130.AMAZON.COM, INC.: PRODUCT PORTFOLIO
    TABLE 131.AMAZON.COM, INC.: NET SALES,
    TABLE 132.AMAZON.COM, INC.: KEY STRATERGIES
    TABLE 133.UNITED PARCEL SERVICE OF AMERICA, INC.: COMPANY SNAPSHOT
    TABLE 134.UNITED PARCEL SERVICE OF AMERICA, INC.: OPERATING SEGMENTS
    TABLE 135.UNITED PARCEL SERVICE OF AMERICA, INC.: PRODUCT PORTFOLIO
    TABLE 136.UNITED PARCEL SERVICE OF AMERICA, INC.: NET SALES,
    TABLE 137.UNITED PARCEL SERVICE OF AMERICA, INC.: KEY STRATERGIES
    TABLE 138.WING AVIATION LLC: COMPANY SNAPSHOT
    TABLE 139.WING AVIATION LLC: OPERATING SEGMENTS
    TABLE 140.WING AVIATION LLC: PRODUCT PORTFOLIO
    TABLE 141.WING AVIATION LLC: NET SALES,
    TABLE 142.WING AVIATION LLC: KEY STRATERGIES
    TABLE 143.WORKHORSE GROUP INCORPORATED: COMPANY SNAPSHOT
    TABLE 144.WORKHORSE GROUP INCORPORATED: OPERATING SEGMENTS
    TABLE 145.WORKHORSE GROUP INCORPORATED: PRODUCT PORTFOLIO
    TABLE 146.WORKHORSE GROUP INCORPORATED: NET SALES,
    TABLE 147.WORKHORSE GROUP INCORPORATED: KEY STRATERGIES
    TABLE 148.ZIPLINE INTERNATIONAL INC.: COMPANY SNAPSHOT
    TABLE 149.ZIPLINE INTERNATIONAL INC.: OPERATING SEGMENTS
    TABLE 150.ZIPLINE INTERNATIONAL INC.: PRODUCT PORTFOLIO
    TABLE 151.ZIPLINE INTERNATIONAL INC.: NET SALES,
    TABLE 152.ZIPLINE INTERNATIONAL INC.: KEY STRATERGIES
    TABLE 153.WINGCOPTER GMBH: COMPANY SNAPSHOT
    TABLE 154.WINGCOPTER GMBH: OPERATING SEGMENTS
    TABLE 155.WINGCOPTER GMBH: PRODUCT PORTFOLIO
    TABLE 156.WINGCOPTER GMBH: NET SALES,
    TABLE 157.WINGCOPTER GMBH: KEY STRATERGIES
  • LIST OF FIGURES

  • FIGURE 1.DRONE LOGISTICS MARKET SEGMENTATION
    FIGURE 2.DRONE LOGISTICS MARKET,2021-2031
    FIGURE 3.DRONE LOGISTICS MARKET,2021-2031
    FIGURE 4. TOP INVESTMENT POCKETS, BY REGION
    FIGURE 5.PORTER FIVE-1
    FIGURE 6.PORTER FIVE-2
    FIGURE 7.PORTER FIVE-3
    FIGURE 8.PORTER FIVE-4
    FIGURE 9.PORTER FIVE-5
    FIGURE 10.TOP PLAYER POSITIONING
    FIGURE 11.DRONE LOGISTICS MARKET:DRIVERS, RESTRAINTS AND OPPORTUNITIES
    FIGURE 12.DRONE LOGISTICS MARKET,BY COMPONENT,2021(%)
    FIGURE 13.COMPARATIVE SHARE ANALYSIS OF HARDWARE DRONE LOGISTICS MARKET,2021-2031(%)
    FIGURE 14.COMPARATIVE SHARE ANALYSIS OF SOFTWARE DRONE LOGISTICS MARKET,2021-2031(%)
    FIGURE 15.COMPARATIVE SHARE ANALYSIS OF SERVICES DRONE LOGISTICS MARKET,2021-2031(%)
    FIGURE 16.DRONE LOGISTICS MARKET,BY APPLICATION,2021(%)
    FIGURE 17.COMPARATIVE SHARE ANALYSIS OF WAREHOUSE AND STORAGE MANAGEMENT DRONE LOGISTICS MARKET,2021-2031(%)
    FIGURE 18.COMPARATIVE SHARE ANALYSIS OF TRANSPORTATION MANAGEMENT DRONE LOGISTICS MARKET,2021-2031(%)
    FIGURE 19.DRONE LOGISTICS MARKET,BY END-USE,2021(%)
    FIGURE 20.COMPARATIVE SHARE ANALYSIS OF COMMERCIAL DRONE LOGISTICS MARKET,2021-2031(%)
    FIGURE 21.COMPARATIVE SHARE ANALYSIS OF MILITARY DRONE LOGISTICS MARKET,2021-2031(%)
    FIGURE 22.DRONE LOGISTICS MARKET BY REGION,2021
    FIGURE 23.U.S. DRONE LOGISTICS MARKET,2021-2031($MILLION)
    FIGURE 24.CANADA DRONE LOGISTICS MARKET,2021-2031($MILLION)
    FIGURE 25.MEXICO DRONE LOGISTICS MARKET,2021-2031($MILLION)
    FIGURE 26.GERMANY DRONE LOGISTICS MARKET,2021-2031($MILLION)
    FIGURE 27.UK DRONE LOGISTICS MARKET,2021-2031($MILLION)
    FIGURE 28.FRANCE DRONE LOGISTICS MARKET,2021-2031($MILLION)
    FIGURE 29.ITALY DRONE LOGISTICS MARKET,2021-2031($MILLION)
    FIGURE 30.REST OF EUROPE DRONE LOGISTICS MARKET,2021-2031($MILLION)
    FIGURE 31.CHINA DRONE LOGISTICS MARKET,2021-2031($MILLION)
    FIGURE 32.JAPAN DRONE LOGISTICS MARKET,2021-2031($MILLION)
    FIGURE 33.INDIA DRONE LOGISTICS MARKET,2021-2031($MILLION)
    FIGURE 34.SOUTH KOREA DRONE LOGISTICS MARKET,2021-2031($MILLION)
    FIGURE 35.REST OF ASIA-PACIFIC DRONE LOGISTICS MARKET,2021-2031($MILLION)
    FIGURE 36.LATIN AMERICA DRONE LOGISTICS MARKET,2021-2031($MILLION)
    FIGURE 37.MIDDLE EAST DRONE LOGISTICS MARKET,2021-2031($MILLION)
    FIGURE 38.AFRICA DRONE LOGISTICS MARKET,2021-2031($MILLION)
    FIGURE 39. TOP WINNING STRATEGIES, BY YEAR
    FIGURE 40. TOP WINNING STRATEGIES, BY DEVELOPMENT
    FIGURE 41. TOP WINNING STRATEGIES, BY COMPANY
    FIGURE 42.PRODUCT MAPPING OF TOP 10 PLAYERS
    FIGURE 43.COMPETITIVE DASHBOARD
    FIGURE 44.COMPETITIVE HEATMAP OF TOP 10 KEY PLAYERS
    FIGURE 45.DEUTSCHE POST DHL GROUP.: NET SALES ,($MILLION)
    FIGURE 46.DRONE DELIVERY CANADA.: NET SALES ,($MILLION)
    FIGURE 47.DRONESCAN.: NET SALES ,($MILLION)
    FIGURE 48.FEDEX CORPORATION.: NET SALES ,($MILLION)
    FIGURE 49.FLYTREX INC..: NET SALES ,($MILLION)
    FIGURE 50.HARDIS GROUP.: NET SALES ,($MILLION)
    FIGURE 51.INFINIUM ROBOTICS.: NET SALES ,($MILLION)
    FIGURE 52.MATTERNET, INC..: NET SALES ,($MILLION)
    FIGURE 53.PINC SOLUTIONS.: NET SALES ,($MILLION)
    FIGURE 54.AMAZON.COM, INC..: NET SALES ,($MILLION)
    FIGURE 55.UNITED PARCEL SERVICE OF AMERICA, INC..: NET SALES ,($MILLION)
    FIGURE 56.WING AVIATION LLC.: NET SALES ,($MILLION)
    FIGURE 57.WORKHORSE GROUP INCORPORATED.: NET SALES ,($MILLION)
    FIGURE 58.ZIPLINE INTERNATIONAL INC..: NET SALES ,($MILLION)
    FIGURE 59.WINGCOPTER GMBH.: NET SALES ,($MILLION)


The global drone logistics market is expected to witness significant growth owing to enhancement in efficiency and operations offered by drone logistics systems across a wide range of applications.

Drone operators need to pass certain aviation regulatory frameworks of respective countries that they operate in. Increase in usage of drones internationally has led regulatory bodies to incorporate drones in their framework for supporting drone service development owing to benefits offered by drones such as low energy consumption, less air pollution, and reduced road congestion. With increase in demand for Beyond Visual Line of Sight (BVLOS) operations, the Global Navigation Satellite System (GNSS) technology is utilized for navigation by drone operators. Use of regional global navigation satellite systems (GNSS) such as GPS, GLONASS, Galileo, and Beidou are regulated by governments. Aviation administrations around the world are developing new regulations for promoting growth in adoption of drones. For instance, in August 2019, the Kansas Department of Transportation was authorized by the Federal Aviation Administration (FAA) for conducting Beyond Visual Line of Sight (BVLOS) operations in the country.

To gain a fair share of the market, major players adopted different strategies such as partnership, product launch, and product development. Among these, product launch is the leading strategy used by prominent players such as DHL, FedEx, Flytrex, and Hardis Group. The aforementioned companies launched cutting-edge drone logistics products to grab a fair share of the market.

PURCHASE OPTIONS

Call or Email us

U.S.-Canada Toll-free: +1-800-792-5285
Int'l : +1-503-894-6022
Europe : +44-845-528-1300
Email : help@alliedmarketresearch.com
 
FREQUENTLY ASKED QUESTIONS?

A. The global drone logistics market was valued at $8.2 billion in 2021 and is projected to reach $53.3 billion in 2031.

A. North America is the largest regional market for drone logistics.

A. Warehouse and storage management is the leading application of drone logistics market.

A. Some leading companies in the drone logistics market include Amazon.com Inc., Deutsche Post DHL Group, FedEx, Flytrex Inc., Hardis Group, Infinium Robotics, Matternet, United Parcel Service of America, Inc., and Wing Aviation LLC among others.

A. The upcoming trends in the drone logistics market include rise in development of autonomous drones and greater use of drones for last mile delivery.

Looking for Customization?

 Customization Request

Have a Question?

 Speak with Analyst

Any Confusion?

 Inquire Before Buying

Have a glance of the Report

  Request Sample
RELATED TAGS

Purchase Full Report of
Drone Logistics Market

Start reading instantly.
This Report and over 66,804+ more Reports, Available with Avenue Library. T&C*.

  • Online Only
  • $3,570
  • Online cloud access only
  • Restricted print, copy, paste & download
  • Read only
  • Free industry update
    (Within 180 days)
  • Free report update in next update cycle
    (Jul 2023 - Jul 2024)
  • Data Pack
  • $3,840
  • Restricted to one authorized user
  • One print only
  • Available in
    Excel
  • Free industry update
    (Within 180 days)
  •   Free report update in next update cycle
    (Jul 2023 - Jul 2024)
  • Single User
  • $5,730
  • Restricted to one authorized user
  • One print only
  • Available in
    PDF
  • Free industry update
    (Within 180 days)
  •   Free report update in next update cycle
    (Jul 2023 - Jul 2024)
  • Five Users
  • $6,450
  • Limited to five authorized users
  • Print upto five copies
  • Available in
    PDF
  • Free industry update
    (Within 180 days)
  •   Free report update in next update cycle
    (Jul 2023 - Jul 2024)
  • Enterprise
    License/PDF

  • $9,600
  • Unlimited
    within
    company/enterprise
  • Available in Excel & PDF
  • Free industry update
    (Within 180 days)
  •   Free report update in next update cycle
    (Jul 2023 - Jul 2024)
  • Library
    Membership

  • $999 $ 1,175
    Per User/ Per month/ Billed annually
  • Published Content
    E-access
  • Company Profiles
    E-access
  • Newly Added Content Access
  • 10 PDF
    Downloads
  • 5 Excel Data
    Pack Downloads
  • 250 Company Profiles PDF Downloads
  • Buy Now

*Taxes/Fees, if applicable will be added during checkout. All prices in USD

RELATED REPORTS
 

Why Allied Market Research?


Infallible Methodology

To ensure high-level data integrity, accurate analysis, and impeccable forecasts

Analyst Support

For complete satisfaction

Customization

On-demand customization of scope of the report to exactly meet your needs

TARGETED MARKET VIEW

Targeted market view to provide pertinent information and save time of readers

Get fresh content delivered

Get insights on topics that are crucial for your business. Stay abreast of your interest areas.

Get Industry Data Alerts

Why Allied Market Research?

Infallible Methodology

To ensure high-level data integrity, accurate analysis, and impeccable forecasts

Analyst Support

For complete satisfaction

Customization

On-demand customization of scope of the report to exactly meet your needs

TARGETED MARKET VIEW

Targeted market view to provide pertinent information and save time of readers