Report Code: A08531 | Jun 2021 | Pages: 270 | ||
Tables: 128 | Charts: 55 |
|
Pandemic disrupted the entire world and affected many industries.
Get detailed COVID-19 impact analysis on the Drone Service Market
Request Now !
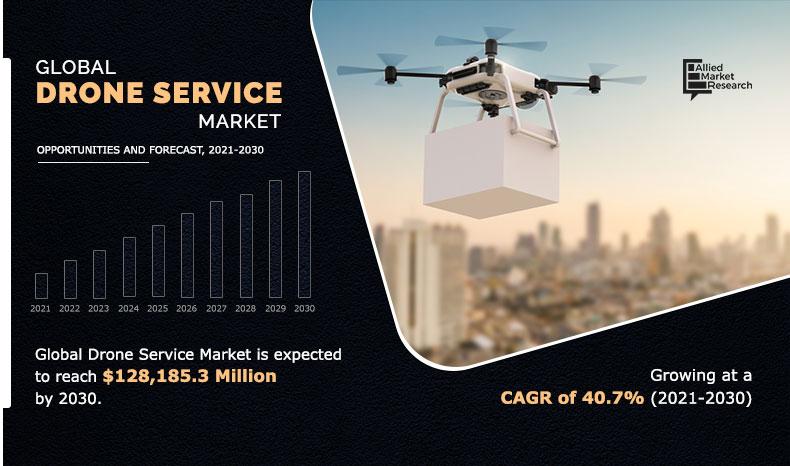
The global drone service market valued $4,215.8 million in 2020 and is projected to reach $128,185.3 million in 2030, registering a CAGR of 40.7%.
The COVID-19 epidemic wreaked havoc on a range of industries, forcing governments around the world to impose stringent lockdowns and make social separation essential in order to stem the virus's spread. As a result, people began to avoid going to certain regions, and demand for all modes of transportation, including air travel, plummeted in 2020. Due to the autonomous nature of drones, the use of drone services by government and commercial organizations in inspection and monitoring applications has expanded.
Drones are utilized in the transportation of goods and passengers worldwide depending on the requirement of various industries such as tourism, logistics, and defense industries. They form a part of the investment of an organization owing to huge maintenance costs and operating costs apart from the immense procurement costs associated with an unmanned aerial vehicle (UAV). In addition, rise in the defense budget has enabled governments of various countries to enter into agreements with drone & component manufacturers such DJi, GoPro, and Controp Precision Technologies Ltd. to offer better & advanced products, which supplements the growth of the drone service market across the globe.
The global drone service industry is projected to expand due to increased innovation, and reduced drone costs and the development of automation technologies. Drone services become more affordable as the use and integration of new technologies into numerous sectors and customers' daily lives grows. For instance, Kratos Unmanned Aerial Systems and the United States Air Force Research Laboratory launched the XQ-58A Valkyrie project in 2019 to minimize the cost of air fleets. A Valkyrie missile costs $3 million, while a Patriot missile costs $6 million. Drones have become affordable, these days, which increases the demand for drone services.
The drone service market is segmented into type, duration of service, application, and solution. By type, it is further divided into drone platform services, drone maintenance, repair, and overhaul (MRO) services, and drone training & education services. By duration of service, the drone service market is segmented into short-duration services and long-duration services. By application, the market is segmented into aerial photography & remote sensing, data acquisition & analytics, mapping & surveying, modelling, disaster risk management & mitigation, inspection & environmental monitoring, and others. By solution, the drone service market is bifurcated into enterprise and point. Region-wise, the market is analyzed across North America, Europe, Asia-Pacific, and LAMEA.
Key players operating in the global drone service market include Aerodyne Group, Cyberhawk, DroneDeploy, Edall Systems, Phoenix Drone Services LLC, PrecisionHawk, senseFly, Sharper Shape, Terra Drone Corporation, and Unmanned Experts Inc.
The global logistics and e-commerce service has accelerated tremendously in recent years. The growth in e-commerce and logistics industries drives the demand for time-efficient delivery solutions for the transportation of critical goods worldwide. For instance, in April 2021, ANA Holdings Inc. and Wingcopter have announced a partnership for accelerating the development of vital pharmaceuticals and other consumer products in drone delivery infrastructure. The partnership is aimed at building a drone delivery infrastructure across Japan. The major e-commerce and logistics giants namely Amazon and DHL have launched drone delivery systems to make quick deliveries and transport packages to places inaccessible by conventional transport systems. For instance, in May 2019, DHL Express and EHang entered into a strategic partnership for launching an intelligent and fully automated smart drone delivery solution in the urban areas of China. The smart drone delivery solution is anticipated to offer a less energy-consuming, efficient, and cost-effective autonomous delivery service in China. The aviation administration around the world is approving commercial delivery companies for operating drones to provide the delivery service.
For instance, Federal Aviation Administration approved Alphabet-owned startup, Wing, for making commercial deliveries through drones in the U.S. in April 2019. The approval is expected to facilitate Wing in making drone-based deliveries in Virginia. In addition, the advantages such as safe and efficient operations associated with drone delivery solutions promote the adoption of drones for providing delivery and investment for developing drone delivery systems by commercial organizations across the world.
The increase in the adoption of drone delivery systems to enhance the efficiency and increase the cost-effectiveness of the delivery systems propel the growth of the drone delivery market during the forecast period.
The global rise in economic intensification has led to an increase in demand for cost-cutting and the development of high-efficiency solutions across the global industries. This surge in demand boosts the need for affordable, easy-to-implement, and high-value on-demand customized systems for the distinct requirement of various industries. The drone manufacturers have increased the development of customized drones for warehouse management, capturing, viewing, and analyzing aerial imagery for agriculture, mining, utility, power, media, telecommunication, logistics, oil & gas, and construction industries. For instance, in April 2021, Skyports and Kenya Airways have signed a Memorandum of Understanding (MoU) for launching operations of permanent unmanned aerial vehicles (UAV) in Kenya. The partnership is aimed at exploring the commercial impact and viability of a variety of logistical, inspection, and medical drone use cases. The drone service companies are adopting mergers, acquisitions, and expansion for developing drone applications according to the custom requirement of the target industry. For instance, in April 2021, the Ripper Group announced a merger with Surf Life Saving Queensland (SLSQ) for enhancing the development and operational synergies of the companies. The merger is anticipated to integrate the search and rescue drone deployment, research, and training capabilities of the Ripper Group in surf lifesaving operations of Surf Life Saving Queensland (SLSQ). The drones offer customizable working capacity which increases their integration in different operations of multiple industries.
The ability of drones to perform in multiple environments and deliver customized output acts as a key driver for the growth of the drone service market in the forecast timeframe.
The flexibility, cost-effectiveness, and high efficiency associated with drones have resulted in the proliferation of drone deployment in commercial and private applications. The rise in implementation of drones in multifaceted applications has also increased the cybersecurity threat for its users. The modern drones come equipped with GPS, USB ports, and other means of technologies that can act as a critical cybersecurity target for hijackers to easily hijack the drone. The hackers can also exploit the drones by accessing the unencrypted Wi-Fi and GPS technologies used by the drones to communicate. The government administrations have issued a ban or restrictions on drone ownership owing to the cybersecurity threats associated with drones. For instance, in April 2021, Legislator Huang Kuo-shu of the Democratic Progressive Party (DPP) of Taiwan has issued a guideline warning against the procurement of drones for made-in-China aerial photography, robots, and coding platforms and subsequent phasing out of the existing equipment. The announcement was made owing to the cybersecurity loophole on consumer electronics manufactured in China. The rising instances of cybersecurity attacks have hindered the adoption of drones by government and private organizations.
The cybersecurity issues related to drone act as a restraint on the growth of the drone service market over the forecasted timeframe.
Drone operators need to pass certain aviation regulatory frameworks of the country they operate in. The increase in usage of drones internationally has led the regulatory bodies to incorporate drones in their framework for supporting drone service development owing to benefits offered by drones such as low energy consumption, less air, and noise pollution, and reduced road congestion. With the increase in demand for Beyond Visual Line of Sight (BVLOS) operations the Global Navigation Satellite System (GNSS) technology is utilized for navigation by drone operators. The use of regional Global Navigation Satellite System (GNSS) such as GPS, GLONASS, Galileo, Beidou, and others are regulated by the governments. The aviation administrations around the world are developing new regulations for promoting the growth in the adoption of drones. For instance, in August 2019, the Kansas Department of Transportation was authorized by the Federal Aviation Administration(FAA) for conducting Beyond Visual Line of Sight operations (BVLOS) operations in the country. The BVLOS operation was conducted by using the onboard detect-and-avoid systems. Governments across the world are developing and implementing a new regulatory system for encouraging drone usage. For instance, the Norwegian Civil Aviation Authority issued European Light UAS Operator Certificate (LUC) to Nordic Unmanned in April 2021. The certificate will enable Nordic Unmanned in deploying its entire Unmanned Aerial System (UAS) fleet for beyond visual line of sight (BVLOS) flights throughout EASA member countries. The governing bodies have eased the regulations for drone operation namely authorization, certification, and spatial limitations worldwide to facilitate the adoption of drones by various industries.
The welcoming government regulatory framework presents an opportunity for the growth of the drone service market.
Key Benefits For Stakeholders
Drone Service Market Report Highlights
Aspects | Details |
---|---|
By Type |
|
By DURATION OF SERVICE |
|
By APPLICATION |
|
By SOLUTION |
|
By Region |
|
Key Market Players | UNMANNED EXPERTS INC., SENSEFLY, AERODYNE GROUP, DRONEDEPLOY, TERRA DRONE CORPORATION, CYBERHAWK, SHARPER SHAPE, PRECISIONHAWK, PHOENIX DRONE SERVICES LLC, Edall Systems |
CHAPTER 1:INTRODUCTION
1.1.Report description
1.2.Key benefits for stakeholders
1.3.Key market segments
1.4.Research methodology
1.4.1.Primary research
1.4.2.Secondary research
1.4.3.Analyst tools and models
CHAPTER 2:EXECUTIVE SUMMARY
2.1.CXO perspective
CHAPTER 3:MARKET OVERVIEW
3.1.Market definition and scope
3.2.Key findings
3.2.1.Top impacting factors
3.2.2.Top investment pockets
3.2.3.Top winning strategies
3.3.Porter’s five forces analysis
3.4.Key player positioning, 2020
3.5.Market dynamics
3.5.1.Drivers
3.5.1.1.Growing demand for time-efficient delivery service
3.5.1.2.Increasing demand for industry-specific solutions
3.5.1.3.High demand for autonomous security and surveillance systems
3.5.2.Restraints
3.5.2.1.Cybersecurity issues associated with drones
3.5.2.2.Limited operational bandwidth for drones
3.5.3.Opportunities
3.5.3.1.Revamped Government Regulatory Framework
3.5.3.2.Technological advancement in Drones
3.6.COVID-19 impact analysis
3.6.1.Evolution of outbreak
3.6.2.Micro economic impact analysis
3.6.2.1.Consumer trends
3.6.2.2.Technology trends
3.6.2.3.Regulatory trends
3.6.3.Macro-economic impact analysis
3.6.3.1.GDP
3.6.3.2.Import/export analysis
3.6.3.3.Employment index
3.6.3.4.Macro-economic indicators projections
3.6.4.Impact on the drone service industry
CHAPTER 4:GLOBAL DRONE SERVICE MARKET, BY TYPE
4.1.Overview
4.2.Drone Platform Services
4.2.1.Key market trends, growth factors, and opportunities
4.2.2.Market size and forecast, by region
4.2.3.Market analysis, by country
4.3.Drone Maintenance, Repair, and Overhaul (MRO) Services
4.3.1.Key market trends, growth factors, and opportunities
4.3.2.Market size and forecast, by region
4.3.3.Market analysis, by country
4.4.Drone Training & Education Services
4.4.1.Key market trends, growth factors, and opportunities
4.4.2.Market size and forecast, by region
4.4.3.Market analysis, by country
CHAPTER 5:GLOBAL DRONE SERVICE MARKET, BY DURATION OF SERVICE
5.1.Overview
5.2.Short-duration services
5.2.1.Key market trends, growth factors, and opportunities
5.2.2.Market size and forecast, by region
5.2.3.Market analysis, by country
5.3.Long-duration services
5.3.1.Key market trends, growth factors, and opportunities
5.3.2.Market size and forecast, by region
5.3.3.Market analysis, by country
CHAPTER 6:GLOBAL DRONE SERVICE MARKET, BY APPLICATION
6.1.Overview
6.2.Aerial Photography & Remote Sensing
6.2.1.Key market trends, growth factors, and opportunities
6.2.2.Market size and forecast, by region
6.2.3.Market analysis, by country
6.3.Data Acquisition & Analytics
6.3.1.Key market trends, growth factors, and opportunities
6.3.2.Market size and forecast, by region
6.3.3.Market analysis, by country
6.4.Mapping & surveying
6.4.1.Key market trends, growth factors, and opportunities
6.4.2.Market size and forecast, by region
6.4.3.Market analysis, by country
6.5.Modelling
6.5.1.Key market trends, growth factors, and opportunities
6.5.2.Market size and forecast, by region
6.5.3.Market analysis, by country
6.6.Disaster Risk Management & Mitigation
6.6.1.Key market trends, growth factors, and opportunities
6.6.2.Market size and forecast, by region
6.6.3.Market analysis, by country
6.7.Inspection & environmental monitoring
6.7.1.Key market trends, growth factors, and opportunities
6.7.2.Market size and forecast, by region
6.7.3.Market analysis, by country
6.8.Others
6.8.1.Key market trends, growth factors, and opportunities
6.8.2.Market size and forecast, by region
6.8.3.Market analysis, by country
CHAPTER 7:GLOBAL DRONE SERVICE MARKET, BY SOLUTION
7.1.Overview
7.2.Enterprise
7.2.1.Key market trends, growth factors, and opportunities
7.2.2.Market size and forecast, by region
7.2.3.Market analysis, by country
7.3.Point
7.3.1.Key market trends, growth factors, and opportunities
7.3.2.Market size and forecast, by region
7.3.3.Market analysis, by country
CHAPTER 8:DRONE SERVICE MARKET, BY REGION
8.1.Overview
8.2.North America
8.2.1.Key market trends, growth factors, and opportunities
8.2.2.Market size and forecast, by Type
8.2.3.Market size and forecast, by Duration of Service
8.2.4.Market size and forecast, by Application
8.2.5.Market size and forecast, by Solution
8.2.6.Market size and forecast, by country
8.2.6.1.U.S.
8.2.6.1.1.Market size and forecast, by Type
8.2.6.1.2.Market size and forecast, by Duration of Service
8.2.6.1.3.Market size and forecast, by Application
8.2.6.1.4.Market size and forecast, by Solution
8.2.6.2.Canada
8.2.6.2.1.Market size and forecast, by Type
8.2.6.2.2.Market size and forecast, by Duration of Service
8.2.6.2.3.Market size and forecast, by Application
8.2.6.2.4.Market size and forecast, by Solution
8.2.6.3.Mexico
8.2.6.3.1.Market size and forecast, by Type
8.2.6.3.2.Market size and forecast, by Duration of Service
8.2.6.3.3.Market size and forecast, by Application
8.2.6.3.4.Market size and forecast, by Solution
8.3.Europe
8.3.1.Key market trends, growth factors, and opportunities
8.3.2.Market size and forecast, by Type
8.3.3.Market size and forecast, by Duration of Service
8.3.4.Market size and forecast, by Application
8.3.5.Market size and forecast, by Solution
8.3.6.Market size and forecast, by country
8.3.6.1.Germany
8.3.6.1.1.Market size and forecast, by Type
8.3.6.1.2.Market size and forecast, by Duration of Service
8.3.6.1.3.Market size and forecast, by Application
8.3.6.1.4.Market size and forecast, by Solution
8.3.6.2.UK
8.3.6.2.1.Market size and forecast, by Type
8.3.6.2.2.Market size and forecast, by Duration of Service
8.3.6.2.3.Market size and forecast, by Application
8.3.6.2.4.Market size and forecast, by Solution
8.3.6.3.France
8.3.6.3.1.Market size and forecast, by Type
8.3.6.3.2.Market size and forecast, by Duration of Service
8.3.6.3.3.Market size and forecast, by Application
8.3.6.3.4.Market size and forecast, by Solution
8.3.6.4.Russia
8.3.6.4.1.Market size and forecast, by Type
8.3.6.4.2.Market size and forecast, by Duration of Service
8.3.6.4.3.Market size and forecast, by Application
8.3.6.4.4.Market size and forecast, by Solution
8.3.6.6.Rest of Europe
8.3.6.6.1.Market size and forecast, by Type
8.3.6.6.2.Market size and forecast, by Duration of Service
8.3.6.6.3.Market size and forecast, by Application
8.3.6.6.4.Market size and forecast, by Solution
8.4.Asia-Pacific
8.4.1.Key market trends, growth factors, and opportunities
8.4.2.Market size and forecast, by Type
8.4.3.Market size and forecast, by Duration of Service
8.4.4.Market size and forecast, by Application
8.4.5.Market size and forecast, by Solution
8.4.6.Market size and forecast, by country
8.4.6.1.China
8.4.6.1.1.Market size and forecast, by Type
8.4.6.1.2.Market size and forecast, by Duration of Service
8.4.6.1.3.Market size and forecast, by Application
8.4.6.1.4.Market size and forecast, by Solution
8.4.6.2.Japan
8.4.6.2.1.Market size and forecast, by Type
8.4.6.2.2.Market size and forecast, by Duration of Service
8.4.6.2.3.Market size and forecast, by Application
8.4.6.2.4.Market size and forecast, by Solution
8.4.6.3.India
8.4.6.3.1.Market size and forecast, by Type
8.4.6.3.2.Market size and forecast, by Duration of Service
8.4.6.3.3.Market size and forecast, by Application
8.4.6.3.4.Market size and forecast, by Solution
8.4.6.4.Rest of Asia-Pacific
8.4.6.4.1.Market size and forecast, by Type
8.4.6.4.2.Market size and forecast, by Duration of Service
8.4.6.4.3.Market size and forecast, by Application
8.4.6.4.4.Market size and forecast, by Solution
8.5.LAMEA
8.5.1.Key market trends, growth factors, and opportunities
8.5.2.Market size and forecast, by Type
8.5.3.Market size and forecast, by Duration of Service
8.5.4.Market size and forecast, by Application
8.5.5.Market size and forecast, by Solution
8.5.6.Market size and forecast, by country
8.5.6.1.Latin America
8.5.6.1.1.Market size and forecast, by Type
8.5.6.1.2.Market size and forecast, by Duration of Service
8.5.6.1.3.Market size and forecast, by Application
8.5.6.1.4.Market size and forecast, by Solution
8.5.6.2.Middle East
8.5.6.2.1.Market size and forecast, by Type
8.5.6.2.2.Market size and forecast, by Duration of Service
8.5.6.2.3.Market size and forecast, by Application
8.5.6.2.4.Market size and forecast, by Solution
8.5.6.3.Africa
8.5.6.3.1.Market size and forecast, by Type
8.5.6.3.2.Market size and forecast, by Duration of Service
8.5.6.3.3.Market size and forecast, by Application
8.5.6.3.4.Market size and forecast, by Solution
CHAPTER 9:COMPANY PROFILES
9.1.AERODYNE GROUP
9.1.1.Company overview
9.1.2.Key executives
9.1.3.Company snapshot
9.1.4.Product portfolio
9.1.5.Key strategic moves and developments
9.2.CYBERHAWK
9.2.1.Company overview
9.2.2.Key executives
9.2.3.Company snapshot
9.2.4.Product portfolio
9.2.5.Key strategic moves and developments
9.3.DRONEDEPLOY
9.3.1.Company overview
9.3.2.Key executives
9.3.3.Company snapshot
9.3.4.Product portfolio
9.3.5.Key strategic moves and developments
9.4.Edall Systems
9.4.1.Company overview
9.4.2.Key executives
9.4.3.Company snapshot
9.4.4.Product portfolio
9.5.PHOENIX DRONE SERVICES LLC
9.5.1.Company overview
9.5.2.Key executives
9.5.3.Company snapshot
9.5.4.Product portfolio
9.6.PRECISIONHAWK
9.6.1.Company overview
9.6.2.Key executives
9.6.3.Company snapshot
9.6.4.Product portfolio
9.6.5.Key strategic moves and developments
9.7.SENSEFLY
9.7.1.Company overview
9.7.2.Key executives
9.7.3.Company snapshot
9.7.4.Product portfolio
9.7.5.R&D expenditure
9.7.6.Business performance
9.7.7.Key strategic moves and developments
9.8.SHARPER SHAPE
9.8.1.Company overview
9.8.2.Key executives
9.8.3.Company snapshot
9.8.4.Product portfolio
9.9.TERRA DRONE CORPORATION
9.9.1.Company overview
9.9.2.Key executives
9.9.3.Company snapshot
9.9.4.Product portfolio
9.9.5.Key strategic moves and developments
9.10.UNMANNED EXPERTS INC.
9.10.1.Company overview
9.10.2.Key executives
9.10.3.Company snapshot
9.10.4.Product portfolio
LIST OF TABLES
TABLE 01.MACRO-ECONOMIC INDICATORS PROJECTIONS
TABLE 02.DRONE SERVICE MARKET, BY TYPE, 2020–2030 ($MILLION)
TABLE 03.DRONE SERVICE MARKET FOR DRONE PLATFORM SERVICES, BY REGION 2020–2030 ($MILLION)
TABLE 04.DRONE SERVICE MARKET FOR DRONE MAINTENANCE, REPAIR, AND OVERHAUL (MRO) SERVICES, BY REGION 2020–2030 ($MILLION)
TABLE 05.DRONE SERVICE MARKET FOR DRONE TRAINING & EDUCATION SERVICES, BY REGION 2020–2030 ($MILLION)
TABLE 06.DRONE SERVICE MARKET, BY DURATION OF SERVICE, 2020–2030 ($MILLION)
TABLE 07.DRONE SERVICE MARKET FOR SHORT-DURATION SERVICES, BY REGION 2020–2030 ($MILLION)
TABLE 08.DRONE SERVICE MARKET FOR LONG-DURATION SERVICES, BY REGION 2020–2030 ($MILLION)
TABLE 09.DRONE SERVICE MARKET, BY APPLICATION, 2020–2030 ($MILLION)
TABLE 10.DRONE SERVICE MARKET FOR AERIAL PHOTOGRAPHY & REMOTE SENSING, BY REGION 2020–2030 ($MILLION)
TABLE 11.DRONE SERVICE MARKET FOR DATA ACQUISITION & ANALYTICS, BY REGION 2020–2030 ($MILLION)
TABLE 12.DRONE SERVICE MARKET FOR MAPPING & SURVEYING, BY REGION 2020–2030 ($MILLION)
TABLE 13.DRONE SERVICE MARKET FOR MODELLING, BY REGION 2020–2030 ($MILLION)
TABLE 14.DRONE SERVICE MARKET FOR DISASTER RISK MANAGEMENT & MITIGATION, BY REGION 2020–2030 ($MILLION)
TABLE 15.DRONE SERVICE MARKET FOR INSPECTION & ENVIRONMENTAL MONITORING, BY REGION 2020–2030 ($MILLION)
TABLE 16.DRONE SERVICE MARKET FOR OTHERS, BY REGION 2020–2030 ($MILLION)
TABLE 17.DRONE SERVICE MARKET, BY SOLUTION, 2020–2030 ($MILLION)
TABLE 18.DRONE SERVICE MARKET FOR ENTERPRISE, BY REGION 2020–2030 ($MILLION)
TABLE 19.DRONE SERVICE MARKET FOR POINT, BY REGION 2020–2030 ($MILLION)
TABLE 20.DRONE SERVICE MARKET, BY REGION 2020–2030 ($MILLION)
TABLE 21.NORTH AMERICA DRONE SERVICE MARKET, BY TYPE, 2020–2030 ($MILLION)
TABLE 22.NORTH AMERICA DRONE SERVICE MARKET, BY DURATION OF SERVICE, 2020–2030 ($MILLION)
TABLE 23.NORTH AMERICA DRONE SERVICE MARKET, BY APPLICATION, 2020–2030 ($MILLION)
TABLE 24.NORTH AMERICA DRONE SERVICE MARKET, BY SOLUTION, 2020–2030 ($MILLION)
TABLE 25.U.S. DRONE SERVICE MARKET, BY TYPE, 2020–2030 ($MILLION)
TABLE 26.U.S. DRONE SERVICE MARKET, BY DURATION OF SERVICE, 2020–2030 ($MILLION)
TABLE 27.U.S. DRONE SERVICE MARKET, BY APPLICATION, 2020–2030 ($MILLION)
TABLE 28.U.S. DRONE SERVICE MARKET, BY SOLUTION, 2020–2030 ($MILLION)
TABLE 29.CANADA DRONE SERVICE MARKET, BY TYPE, 2020–2030 ($MILLION)
TABLE 30.CANADA DRONE SERVICE MARKET, BY DURATION OF SERVICE, 2020–2030 ($MILLION)
TABLE 31.CANADA DRONE SERVICE MARKET, BY APPLICATION, 2020–2030 ($MILLION)
TABLE 32.CANADA DRONE SERVICE MARKET, BY SOLUTION, 2020–2030 ($MILLION)
TABLE 33.MEXICO DRONE SERVICE MARKET, BY TYPE, 2020–2030 ($MILLION)
TABLE 34.MEXICO DRONE SERVICE MARKET, BY DURATION OF SERVICE, 2020–2030 ($MILLION)
TABLE 35.MEXICO DRONE SERVICE MARKET, BY APPLICATION, 2020–2030 ($MILLION)
TABLE 36.MEXICO DRONE SERVICE MARKET, BY SOLUTION, 2020–2030 ($MILLION)
TABLE 37.EUROPE DRONE SERVICE MARKET, BY TYPE, 2020–2030 ($MILLION)
TABLE 38.EUROPE DRONE SERVICE MARKET, BY DURATION OF SERVICE, 2020–2030 ($MILLION)
TABLE 39.EUROPE DRONE SERVICE MARKET, BY APPLICATION, 2020–2030 ($MILLION)
TABLE 40.EUROPE DRONE SERVICE MARKET, BY SOLUTION, 2020–2030 ($MILLION)
TABLE 41.GERMANY DRONE SERVICE MARKET, BY TYPE, 2020–2030 ($MILLION)
TABLE 42.GERMANY DRONE SERVICE MARKET, BY DURATION OF SERVICE, 2020–2030 ($MILLION)
TABLE 43.GERMANY DRONE SERVICE MARKET, BY APPLICATION, 2020–2030 ($MILLION)
TABLE 44.GERMANY DRONE SERVICE MARKET, BY SOLUTION, 2020–2030 ($MILLION)
TABLE 45.UK DRONE SERVICE MARKET, BY TYPE, 2020–2030 ($MILLION)
TABLE 46.UK DRONE SERVICE MARKET, BY DURATION OF SERVICE, 2020–2030 ($MILLION)
TABLE 47.UK DRONE SERVICE MARKET, BY APPLICATION, 2020–2030 ($MILLION)
TABLE 48.UK DRONE SERVICE MARKET, BY SOLUTION, 2020–2030 ($MILLION)
TABLE 49.FRANCE DRONE SERVICE MARKET, BY TYPE, 2020–2030 ($MILLION)
TABLE 50.FRANCE DRONE SERVICE MARKET, BY DURATION OF SERVICE, 2020–2030 ($MILLION)
TABLE 51.FRANCE DRONE SERVICE MARKET, BY APPLICATION, 2020–2030 ($MILLION)
TABLE 52.FRANCE DRONE SERVICE MARKET, BY SOLUTION, 2020–2030 ($MILLION)
TABLE 53.RUSSIA DRONE SERVICE MARKET, BY TYPE, 2020–2030 ($MILLION)
TABLE 54.RUSSIA DRONE SERVICE MARKET, BY DURATION OF SERVICE, 2020–2030 ($MILLION)
TABLE 55.RUSSIA DRONE SERVICE MARKET, BY APPLICATION, 2020–2030 ($MILLION)
TABLE 56.RUSSIA DRONE SERVICE MARKET, BY SOLUTION, 2020–2030 ($MILLION)
TABLE 57.REST OF EUROPE DRONE SERVICE MARKET, BY TYPE, 2020–2030 ($MILLION)
TABLE 58.REST OF EUROPE DRONE SERVICE MARKET, BY DURATION OF SERVICE, 2020–2030 ($MILLION)
TABLE 59.REST OF EUROPE DRONE SERVICE MARKET, BY APPLICATION, 2020–2030 ($MILLION)
TABLE 60.REST OF EUROPE DRONE SERVICE MARKET, BY SOLUTION, 2020–2030 ($MILLION)
TABLE 61.ASIA PACIFIC DRONE SERVICE MARKET, BY TYPE, 2020–2030 ($MILLION)
TABLE 62.ASIA PACIFIC DRONE SERVICE MARKET, BY DURATION OF SERVICE, 2020–2030 ($MILLION)
TABLE 63.ASIA PACIFIC DRONE SERVICE MARKET, BY APPLICATION, 2020–2030 ($MILLION)
TABLE 64.ASIA PACIFIC DRONE SERVICE MARKET, BY SOLUTION, 2020–2030 ($MILLION)
TABLE 65.CHINA DRONE SERVICE MARKET, BY TYPE, 2020–2030 ($MILLION)
TABLE 66.CHINA DRONE SERVICE MARKET, BY DURATION OF SERVICE, 2020–2030 ($MILLION)
TABLE 67.CHINA DRONE SERVICE MARKET, BY APPLICATION, 2020–2030 ($MILLION)
TABLE 68.CHINA DRONE SERVICE MARKET, BY SOLUTION, 2020–2030 ($MILLION)
TABLE 69.JAPAN DRONE SERVICE MARKET, BY TYPE, 2020–2030 ($MILLION)
TABLE 70.JAPAN DRONE SERVICE MARKET, BY DURATION OF SERVICE, 2020–2030 ($MILLION)
TABLE 71.JAPAN DRONE SERVICE MARKET, BY APPLICATION, 2020–2030 ($MILLION)
TABLE 72.JAPAN DRONE SERVICE MARKET, BY SOLUTION, 2020–2030 ($MILLION)
TABLE 73.INDIA DRONE SERVICE MARKET, BY TYPE, 2020–2030 ($MILLION)
TABLE 74.INDIA DRONE SERVICE MARKET, BY DURATION OF SERVICE, 2020–2030 ($MILLION)
TABLE 75.INDIA DRONE SERVICE MARKET, BY APPLICATION, 2020–2030 ($MILLION)
TABLE 76.INDIA DRONE SERVICE MARKET, BY SOLUTION, 2020–2030 ($MILLION)
TABLE 77.REST OF ASIA PACIFIC DRONE SERVICE MARKET, BY TYPE, 2020–2030 ($MILLION)
TABLE 78.REST OF ASIA PACIFIC DRONE SERVICE MARKET, BY DURATION OF SERVICE, 2020–2030 ($MILLION)
TABLE 79.REST OF ASIA PACIFIC DRONE SERVICE MARKET, BY APPLICATION, 2020–2030 ($MILLION)
TABLE 80.REST OF ASIA-PACIFIC DRONE SERVICE MARKET, BY SOLUTION, 2020–2030 ($MILLION)
TABLE 81.LAMEA DRONE SERVICE MARKET, BY TYPE, 2020–2030 ($MILLION)
TABLE 82.LAMEA DRONE SERVICE MARKET, BY DURATION OF SERVICE, 2020–2030 ($MILLION)
TABLE 83.LAMEA DRONE SERVICE MARKET, BY APPLICATION, 2020–2030 ($MILLION)
TABLE 84.LAMEA DRONE SERVICE MARKET, BY SOLUTION, 2020–2030 ($MILLION)
TABLE 85.LATIN AMERICA DRONE SERVICE MARKET, BY TYPE, 2020–2030 ($MILLION)
TABLE 86.LATIN AMERICA DRONE SERVICE MARKET, BY DURATION OF SERVICE, 2020–2030 ($MILLION)
TABLE 87.LATIN AMERICA DRONE SERVICE MARKET, BY APPLICATION, 2020–2030 ($MILLION)
TABLE 88.LATIN AMERICA DRONE SERVICE MARKET, BY SOLUTION, 2020–2030 ($MILLION)
TABLE 89.MIDDLE EAST DRONE SERVICE MARKET, BY TYPE, 2020–2030 ($MILLION)
TABLE 90.MIDDLE EAST DRONE SERVICE MARKET, BY DURATION OF SERVICE, 2020–2030 ($MILLION)
TABLE 91.MIDDLE EAST DRONE SERVICE MARKET, BY APPLICATION, 2020–2030 ($MILLION)
TABLE 92.MIDDLE EAST DRONE SERVICE MARKET, BY SOLUTION, 2020–2030 ($MILLION)
TABLE 93.AFRICA DRONE SERVICE MARKET, BY TYPE, 2020–2030 ($MILLION)
TABLE 94.AFRICA DRONE SERVICE MARKET, BY DURATION OF SERVICE, 2020–2030 ($MILLION)
TABLE 95.AFRICA DRONE SERVICE MARKET, BY APPLICATION, 2020–2030 ($MILLION)
TABLE 96.AFRICA DRONE SERVICE MARKET, BY SOLUTION, 2020–2030 ($MILLION)
TABLE 97.AERODYNE GROUP: KEY EXECUTIVES
TABLE 98.AERODYNE GROUP: COMPANY SNAPSHOT
TABLE 99.AERODYNE GROUP: PRODUCT PORTFOLIO
TABLE 100.CYBERHAWK: KEY EXECUTIVES
TABLE 101.CYBERHAWK: COMPANY SNAPSHOT
TABLE 102.CYBERHAWK: PRODUCT PORTFOLIO
TABLE 103.DRONEDEPLOY: KEY EXECUTIVES
TABLE 104.DRONEDEPLOY: COMPANY SNAPSHOT
TABLE 105.DRONEDEPLOY: PRODUCT PORTFOLIO
TABLE 106.EDALL SYSTEMS: KEY EXECUTIVES
TABLE 107.EDALL SYSTEMS: COMPANY SNAPSHOT
TABLE 108.EDALL SYSTEMS: PRODUCT PORTFOLIO
TABLE 109.PHOENIX DRONE SERVICES LLC: KEY EXECUTIVES
TABLE 110.PHOENIX DRONE SERVICES LLC: COMPANY SNAPSHOT
TABLE 111.PHOENIX DRONE SERVICES LLC: PRODUCT PORTFOLIO
TABLE 112.PRECISIONHAWK: KEY EXECUTIVES
TABLE 113.PRECISIONHAWK: COMPANY SNAPSHOT
TABLE 114.PRECISIONHAWK: PRODUCT PORTFOLIO
TABLE 115.SENSEFLY: KEY EXECUTIVES
TABLE 116.SENSEFLY: COMPANY SNAPSHOT
TABLE 117.SENSEFLY: PRODUCT PORTFOLIO
TABLE 118.PARROT SA: R&D EXPENDITURE, 2017–2019 ($MILLION)
TABLE 119.PARROT SA: NET SALES, 2017–2019 ($MILLION)
TABLE 120.SHARPER SHAPE: KEY EXECUTIVES
TABLE 121.SHARPER SHAPE: COMPANY SNAPSHOT
TABLE 122.SHARPER SHAPE: PRODUCT PORTFOLIO
TABLE 123.TERRA DRONE CORPORATION: KEY EXECUTIVES
TABLE 124.TERRA DRONE CORPORATION: COMPANY SNAPSHOT
TABLE 125.TERRA DRONE CORPORATION: PRODUCT PORTFOLIO
TABLE 126.UNMANNED EXPERTS INC.: KEY EXECUTIVES
TABLE 127.UNMANNED EXPERTS INC.: COMPANY SNAPSHOT
TABLE 128.UNMANNED EXPERTS INC.: PRODUCT PORTFOLIO
LIST OF FIGURES
FIGURE 01.KEY MARKET SEGMENTS
FIGURE 02.EXECUTIVE SUMMARY
FIGURE 03.EXECUTIVE SUMMARY
FIGURE 04.TOP IMPACTING FACTORS
FIGURE 05.TOP INVESTMENT POCKETS
FIGURE 06.TOP WINNING STRATEGIES, BY YEAR, 2019-2021*
FIGURE 07.TOP WINNING STRATEGIES, BY DEVELOPMENT, 2019-2021*
FIGURE 08.TOP WINNING STRATEGIES, BY COMPANY, 2019-2021*
FIGURE 09.MODERATE-TO-HIGH BARGAINING POWER OF SUPPLIERS
FIGURE 10.MODERATE-TO-HIGH THREAT OF NEW ENTRANTS
FIGURE 11.LOW-TO-MODERATE THREAT OF SUBSTITUTES
FIGURE 12.MODERATE-TO-HIGH INTENSITY OF RIVALRY
FIGURE 13.LOW-TO-HIGH BARGAINING POWER OF BUYERS
FIGURE 14.KEY PLAYER POSITIONING (2020)
FIGURE 15.DRONE SERVICE MARKET SHARE, BY TYPE, 2020–2030 (%)
FIGURE 16.COMPARATIVE SHARE ANALYSIS OF DRONE SERVICE MARKET FOR DRONE PLATFORM SERVICES, BY COUNTRY, 2020 & 2030 (%)
FIGURE 17.COMPARATIVE SHARE ANALYSIS OF DRONE SERVICE MARKET FOR DRONE MAINTENANCE, REPAIR, AND OVERHAUL (MRO) SERVICES, BY COUNTRY, 2020 & 2030 (%)
FIGURE 18.COMPARATIVE SHARE ANALYSIS OF DRONE TRAINING & EDUCATION SERVICES, BY COUNTRY, 2020 & 2030 (%)
FIGURE 19.DRONE SERVICE MARKET SHARE, BY DURATION OF SERVICE, 2020–2030 (%)
FIGURE 20.COMPARATIVE SHARE ANALYSIS OF DRONE SERVICE MARKET FOR SHORT-DURATION SERVICES, BY COUNTRY, 2020 & 2030 (%)
FIGURE 21.COMPARATIVE SHARE ANALYSIS OF DRONE SERVICE MARKET FOR LONG-DURATION SERVICES, BY COUNTRY, 2020 & 2030 (%)
FIGURE 22.DRONE SERVICE MARKET SHARE, BY APPLICATION, 2020–2030 (%)
FIGURE 23.COMPARATIVE SHARE ANALYSIS OF DRONE SERVICE MARKET FOR AERIAL PHOTOGRAPHY & REMOTE SENSING, BY COUNTRY, 2020 & 2030 (%)
FIGURE 24.COMPARATIVE SHARE ANALYSIS OF DRONE SERVICE MARKET FOR DATA ACQUISITION & ANALYTICS, BY COUNTRY, 2020 & 2030 (%)
FIGURE 25.COMPARATIVE SHARE ANALYSIS OF DRONE SERVICE MARKET FOR MAPPING & SURVEYING, BY COUNTRY, 2020 & 2030 (%)
FIGURE 26.COMPARATIVE SHARE ANALYSIS OF DRONE SERVICE MARKET FOR MODELLING, BY COUNTRY, 2020 & 2030 (%)
FIGURE 27.COMPARATIVE SHARE ANALYSIS OF DRONE SERVICE MARKET FOR DISASTER RISK MANAGEMENT & MITIGATION, BY COUNTRY, 2020 & 2030 (%)
FIGURE 28.COMPARATIVE SHARE ANALYSIS OF DRONE SERVICE MARKET INSPECTION & ENVIRONMENTAL MONITORING, BY COUNTRY, 2020 & 2030 (%)
FIGURE 29.COMPARATIVE SHARE ANALYSIS OF OTHERS, BY COUNTRY, 2020 & 2030 (%)
FIGURE 30.DRONE SERVICE MARKET SHARE, BY SOLUTION, 2020–2030 (%)
FIGURE 31.COMPARATIVE SHARE ANALYSIS OF DRONE SERVICE MARKET FOR ENTERPRISE, BY COUNTRY, 2020 & 2030 (%)
FIGURE 32.COMPARATIVE SHARE ANALYSIS OF DRONE SERVICE MARKET FOR POINT, BY COUNTRY, 2020 & 2030 (%)
FIGURE 33.DRONE SERVICE MARKET, BY REGION, 2020–2030 (%)
FIGURE 34.COMPARATIVE SHARE ANALYSIS OF DRONE SERVICE MARKET, BY COUNTRY, 2020–2030 (%)
FIGURE 35.U.S. DRONE SERVICE MARKET, 2020–2030 ($MILLION)
FIGURE 36.CANADA DRONE SERVICE MARKET, 2020–2030 ($MILLION)
FIGURE 37.MEXICO DRONE SERVICE MARKET, 2020–2030 ($MILLION)
FIGURE 38.COMPARATIVE SHARE ANALYSIS OF DRONE SERVICE MARKET, BY COUNTRY, 2020–2030 (%)
FIGURE 39.GERMANY DRONE SERVICE MARKET, 2020–2030 ($MILLION)
FIGURE 40.UK DRONE SERVICE MARKET, 2020–2030 ($MILLION)
FIGURE 41.FRANCE DRONE SERVICE MARKET, 2020–2030 ($MILLION)
FIGURE 42.RUSSIA DRONE SERVICE MARKET, 2020–2030 ($MILLION)
FIGURE 43.REST OF EUROPE DRONE SERVICE MARKET, 2020–2030 ($MILLION)
FIGURE 44.COMPARATIVE SHARE ANALYSIS OF DRONE SERVICE MARKET, BY COUNTRY, 2020–2030 (%)
FIGURE 45.CHINA DRONE SERVICE MARKET, 2020–2030 ($MILLION)
FIGURE 46.JAPAN DRONE SERVICE MARKET, 2020–2030 ($MILLION)
FIGURE 47.INDIA DRONE SERVICE MARKET, 2020–2030 ($MILLION)
FIGURE 48.REST OF ASIA PACIFIC DRONE SERVICE MARKET, 2020–2030 ($MILLION)
FIGURE 49.COMPARATIVE SHARE ANALYSIS OF DRONE SERVICE MARKET, BY COUNTRY, 2020–2030 (%)
FIGURE 50.LATIN AMERICA DRONE SERVICE MARKET, 2020–2030 ($MILLION)
FIGURE 51.MIDDLE EAST DRONE SERVICE MARKET, 2020–2030 ($MILLION)
FIGURE 52.AFRICA DRONE SERVICE MARKET, 2020–2030 ($MILLION)
FIGURE 53.PARROT SA: R&D EXPENDITURE, 2017–2019 ($MILLION)
FIGURE 54.PARROT SA: NET SALES, 2017–2019 ($MILLION)
FIGURE 55.PARROT SA: REVENUE SHARE BY REGION, 2019 (%)
The global drone service market is expected to witness significant growth due to the rise in deployment of unmanned aerial platforms for inspection and surveillance services around the world.
According to the CXOs of leading drone service companies, drone makers are concentrating on drone-related advancements. Drones and cameras have undergone recent advances, which are projected to give a lucrative possibility for market expansion. for instance, Precision Technologies Ltd announced new payload capabilities for future tactical mission requirements in January 2020, including the T-STAMP-XD for laser-designation missions and the STAMP-VMD for wide-area persistent surveillance, along with concepts for SUAVs and drones in the future battlefield. Furthermore, FLIR System Inc. announced the TZ20 in August 2020, which is the first high-resolution, dual thermal sensor gimbal designed for the DJI Matrice V2 200 Series and Matrice 300 airframes and appropriate for rescue operations. Such improvements carried out by companies all over the world contribute to the global market's growth.
Factors such as rise in demand for time-efficient delivery service, increase in demand for industry-specific solutions and cybersecurity issues associated with drones accelerate the growth of the global drone services market. However, cybersecurity issues associated with drones and limited operational bandwidth for drones are the factors, which hamper the growth of the drone services market. Conversely, revamped government regulatory framework and technological advancement in drones are expected to provide lucrative opportunities for the expansion of the growth of the global drone services market.
Drone services are more energy-efficient than traditional mechanical, pneumatic, and hydraulic options. It combines power electronics and drives, diminishing the engine's autonomy. It is well suited for deployment in hostile and remote environments, resulting in increased use by defense and commercial entities.
Among the analyzed regions, North America is the highest revenue contributor, followed by Europe, Asia Pacific and LAMEA. By forecast analysis, North America is expected to maintain its lead during the forecast period, owing to the presence of industry giants and the large defense spending in the region.
A. The global drone services market was valued at $ 4,215.8 Million in 2020, and is projected to reach $ 128,185.3 Million by 2030.
A. The manufacturing and supply-chain regarding the drone service components is expected to bounce back amid the lifting lockdown measures and the consequent resuming of transportation activities across the globe.
A. The report sample for global drone service market report can be obtained on demand from the website.
A. Technological advancement in drones
A. The drone service industry is growing at a CAGR of 40.7% from 2021 to 2030.
A. The company profiles of the top players of the market can be obtained from the company profile section mentioned in the report. This section includes analysis of top ten player’s operating in the industry along with their last three-year revenue, segmental revenue, product offerings, key strategies adopted, and geographical revenue generated.
A. The North American region is dominating the drone service industry and offers growth opportunities for drone service companies in the future.
A. By type, the drone platform services segment is expected to gain traction over the forecast period
A. The U.S. and China are key matured markets growing in the global drone services market.
A. The cyber security issues associated with drones and limited operational bandwidth for drones.
Start reading instantly.
This Report and over 67,404+ more Reports, Available with Avenue Library. T&C*.
Enterprise
License/PDF
Library
Membership
*Taxes/Fees, if applicable will be added during checkout. All prices in USD
To ensure high-level data integrity, accurate analysis, and impeccable forecasts
For complete satisfaction
On-demand customization of scope of the report to exactly meet your needs
Targeted market view to provide pertinent information and save time of readers
Get insights on topics that are crucial for your business. Stay abreast of your interest areas.
Get Industry Data AlertsTo ensure high-level data integrity, accurate analysis, and impeccable forecasts
For complete satisfaction
On-demand customization of scope of the report to exactly meet your needs
Targeted market view to provide pertinent information and save time of readers