0
2022
Dropshipping Market

Dropshipping Market

by Product (Electronics, Fashion, Toys, hobby, and DIY, Furniture, Beauty, Health, Personal, and Household Care, Others), by Destination (Domestic, International): Global Opportunity Analysis and Industry Forecast, 2021-2031

Report Code: A31519
Oct 2022 | Pages: 197
Tables: 123
Charts: 57
  • Formats*:

  • pdf

    Single User License, Five User
    License & Enterprise User License

  • xls

    Data Pack Excel License

  • ppt

    It comes with the additional cost
    of $2500.00 contact sales.


The global dropshipping market was valued at $155.6 billion in 2021, and is projected to reach $1670.1 billion by 2031, growing at a CAGR of 27.1% from 2022 to 2031.

Dropshipping is a type of retail fulfillment method for online stores, where retailers sell products to customers, then pass on the sales order to a third-party supplier, who then ships the order directly to customers on behalf of the retailer. In addition, there is a fast-growing trend of online middlemen that keeps change between wholesale and retail price and cost extra money. Retailers that use dropshipping forfeit some control over customer experience; therefore, having exceptional customer support is critical for buyer retention. Factors such as increase in smartphone penetration, coupled with rise in consumer disposable income contribute toward growth of the e-commerce market, which propels demand for dropshipping services.

Dropshipping Market

In addition, lower capital investments in inventory and logistics has led to increased demand for dropshipping in retailers. However, fraudulent or illegal transactions are the factors that hinder growth of the dropshipping market. Security in terms of payment is one of the key concerns faced in the industry as dropshipping mainly involves online transactions. Payment gateways are liable to cyberattacks or security breaches, which are anticipated to act as a challenge for the market. To minimize loss of goods, damage, and late deliveries, dropshipping services need a proper delivery infrastructure. As a result, difficulties in product shipping and logistics are expected to limit expansion of the global dropshipping market in the years to come. Moreover, growing e-commerce industry offers several opportunities for selling various quality products such as electronics, food, and personal care & appliances as customers can compare a broad product portfolio, get discounts, and request easy returns.

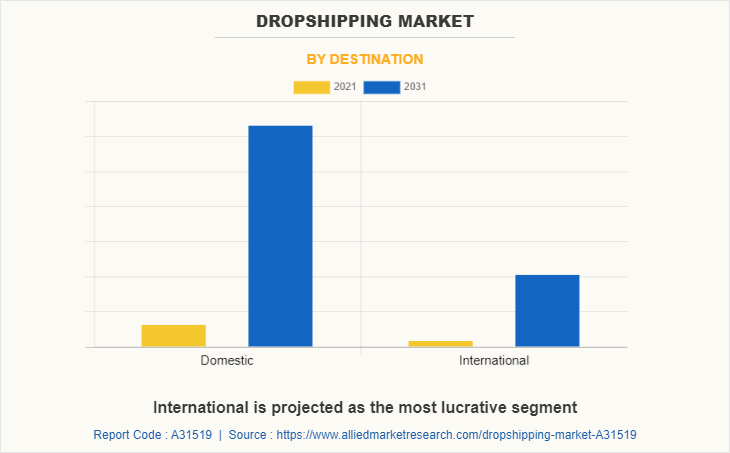
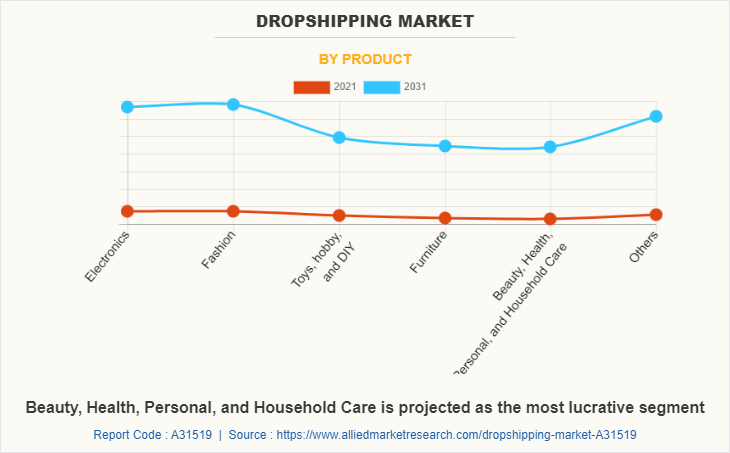
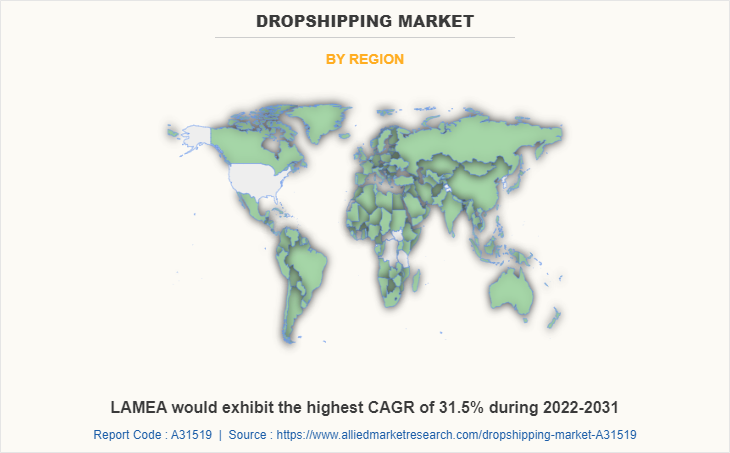
The dropshipping market is segmented into product, destination and region. On the basis of product, it is divided into electronics, fashion, toys, hobby, and DIY, furniture, beauty, health, personal, and household care and others. On the basis of destination, it is segmented into domestic and international. Region wise, this market is analyzed across North America, Europe, Asia-Pacific, and LAMEA.
Dropshipping Market

Key players operating in this dropshipping market include AliDropship, Doba Inc., Inventory Source, Megagoods, Inc, Modalyst, Inc, SaleHoo Group Limited, Shopify Inc., Sunrise Wholesale Merchandise, LLC, Printify, Cin7 Orderhive Inc., and Wholesale2b.

Growth in e-commerce industry

In the current scenario, the e-commerce industry is growing rapidly, owing to increase in penetration of the internet. People can buy and sell virtually everything such as books, electronics, clothing, software, and furniture with the help of the internet. For instance, in May 2021, according to the United Nations Conference on Trade and Development (UNCTAD), share of the global e-commerce sector's retail sales increased dramatically from 16% to 19% in 2020. Similarly, according to the IBEF (India Brand Equity Foundation) organization, India's e-commerce is expected to reach $99 billion by 2024, growing 27% from 2019–2024, with food and fashion apparel likely to be major products in it.

According to the Organization for Economic Co-operation and Development (OECD), Austria, Belgium, Chile, Ireland, Israel, and the UK all expanded their fiber connections by more than 50% in 2020. Similarly, according to the World Bank organization, by 2022, total annual Internet usage is expected to increase by approximately 50% from 2020 levels to reach 4.8 zettabytes, equivalent to 150,000 GB per second. Thus, as a result of growth of the e-commerce industry, infrastructure of the shipping industry is improving, owing to rise in internet penetration globally, which helps consumers to shop through online platforms. Hence, these factors are expected to propel the dropshipping market growth during the forecast period.
Dropshipping Market

Increase in demand for fast delivery of packages

With the advent of online shopping along with inclination of customers toward buying products through an online source, demand for better and more efficient delivery service for products has increased. With the advent of the COVID-19 pandemic, preference of customers for online shipping of daily necessities has increased, which has supplemented growth of the dropshipping market. For instance, there has been a spike in e-grocery orders in China, owing to inclination to consumers toward e-commerce companies such as JD.com, Alibaba Group, and MTDP to shop virtually for their household needs. In addition, to curb need to avoid direct contact among individuals, JD.com in China has offered a platform for customers to deal with directly to manufacturers in Wuhan to handle grocery and medical package deliveries. Thus, increase in demand for fast delivery of packages further boosts growth of the dropshipping industry across the globe.

Security concerns regarding online payments

Increase in online frauds globally has led to increase in awareness regarding security pertaining to online payments, which is expected to hamper growth of the global dropshipping market during the forecast period. For instance, in May 2021, cybercrime department of the government of India mentioned that the department received more than 61,100 complaints regarding digital frauds. In addition, 50% of these complaints were related to UPI frauds. Similarly, in 2019, the Merchant Risk Council organization mentioned in a report that 6.2% of total revenue lost in payment frauds globally. Furthermore, increase in number of scams regarding fake dropshipping stores on e-commerce platforms are being witnessed throughout the world. Thus, rise in number of payment frauds globally and increase in number of fake dropshipping stores on e-commerce platforms are anticipated to restraint the market growth during the forecast period.
Dropshipping Market

Consumer inclination toward online shopping

In the past few years, the consumers have shown increased inclination towards online shopping due the high convenience offered by online shopping platforms, increased adoption of smartphones/tablets, and rising penetration of internet globally. For instance, in 2022, the global internet penetration is around 69%, and the total internet users are about 5,473 million.

In all the regions the Asia-Pacific region is the leading region with highest internet user 2,934 million, and North America region is the leading region in terms of internet penetration with 93.4%. The rapid adoption of internet in all over the world support the dropshipping market during the forecast period.

The lockdown has significantly boosted adoption of dropshipping among consumers for buying medicines and other essentials products online. For instance, according to the United Nations Conference on Trade and Development (UNCTAD), average share of internet users who made purchases online increased from 53% before the pandemic (2019) to 60% following the onset of the pandemic (2020/21), across 66 countries. In addition, the U.S. and China, which contribute toward growth of dropshipping, have been hit hardest by the COVID-19 pandemic. The economic uncertainty, partial shutdown of businesses and low consumer confidence impacted demand for numerous products. The supply chain got hampered during the pandemic along with delayed logistics activities. The dropshipping market is expected to regain its pace during the post pandemic scenario, owing to ease in restrictions and increase in number of e-commerce platforms. For instance, according to Shopify, in 2020, only 17.8% of sales were made from online purchases. This number is expected to reach 21% in 2022, a 17.9% increase in the e-commerce market share over two years.

Key Benefits For Stakeholders

  • This study presents analytical depiction of the global dropshipping market analysis along with current trends and future estimations to depict imminent investment pockets.

  • The overall dropshipping market opportunity is determined by understanding profitable trends to gain a stronger foothold.

  • The report presents information related to the key drivers, restraints, and opportunities of the global dropshipping market with a detailed impact analysis.

  • The current dropshipping market is quantitatively analyzed from 2022 to 2031 to benchmark the financial competency.

  • Porter’s five forces analysis illustrates the potency of the buyers and suppliers in the industry

Dropshipping Market Report Highlights

Aspects Details
Market Size By 2031 USD 1670.1 billion
Growth Rate CAGR of 27.1%
Forecast period 2021 - 2031
Report Pages 197
By Destination
  • Domestic
  • International
By Product
  • Electronics
  • Fashion
  • Toys, hobby, and DIY
  • Furniture
  • Beauty, Health, Personal, and Household Care
  • Others
By Region
  • North America  (U.S., Canada, Mexico)
  • Europe  (UK, France, Germany, Italy, Spain, Rest Of Europe)
  • Asia-Pacific  (China, India, Japan, South Korea, Australia, Rest Of Asia-Pacific)
  • LAMEA  (Latin America, Middle East, Africa)
Key Market Players Megagoods Inc., Cin7 Orderhive Inc., Sunrise Wholesale Merchandise LLC, Modalyst Inc., Doba Inc., Alidropship, Wholesale2b, SaleHoo Group Limited, Printify, Inventory Source, Shopify Inc.
 
  • CHAPTER 1:INTRODUCTION

    • 1.1.Report description

    • 1.2.Key market segments

    • 1.3.Key benefits to the stakeholders

    • 1.4.Research Methodology

      • 1.4.1.Secondary research

      • 1.4.2.Primary research

      • 1.4.3.Analyst tools and models

  • CHAPTER 2:EXECUTIVE SUMMARY

    • 2.1.Key findings of the study

    • 2.2.CXO Perspective

  • CHAPTER 3:MARKET OVERVIEW

    • 3.1.Market definition and scope

    • 3.2.Key findings

      • 3.2.1.Top investment pockets

    • 3.3.Porter’s five forces analysis

    • 3.4.Top player positioning

    • 3.5.Market dynamics

      • 3.5.1.Drivers

      • 3.5.2.Restraints

      • 3.5.3.Opportunities

    • 3.6.COVID-19 Impact Analysis on the market

  • CHAPTER 4: DROPSHIPPING MARKET, BY PRODUCT

    • 4.1 Overview

      • 4.1.1 Market size and forecast

    • 4.2 Electronics

      • 4.2.1 Key market trends, growth factors and opportunities

      • 4.2.2 Market size and forecast, by region

      • 4.2.3 Market analysis by country

    • 4.3 Fashion

      • 4.3.1 Key market trends, growth factors and opportunities

      • 4.3.2 Market size and forecast, by region

      • 4.3.3 Market analysis by country

    • 4.4 Toys, hobby, and DIY

      • 4.4.1 Key market trends, growth factors and opportunities

      • 4.4.2 Market size and forecast, by region

      • 4.4.3 Market analysis by country

    • 4.5 Furniture

      • 4.5.1 Key market trends, growth factors and opportunities

      • 4.5.2 Market size and forecast, by region

      • 4.5.3 Market analysis by country

    • 4.6 Beauty, Health, Personal, and Household Care

      • 4.6.1 Key market trends, growth factors and opportunities

      • 4.6.2 Market size and forecast, by region

      • 4.6.3 Market analysis by country

    • 4.7 Others

      • 4.7.1 Key market trends, growth factors and opportunities

      • 4.7.2 Market size and forecast, by region

      • 4.7.3 Market analysis by country

  • CHAPTER 5: DROPSHIPPING MARKET, BY DESTINATION

    • 5.1 Overview

      • 5.1.1 Market size and forecast

    • 5.2 Domestic

      • 5.2.1 Key market trends, growth factors and opportunities

      • 5.2.2 Market size and forecast, by region

      • 5.2.3 Market analysis by country

    • 5.3 International

      • 5.3.1 Key market trends, growth factors and opportunities

      • 5.3.2 Market size and forecast, by region

      • 5.3.3 Market analysis by country

  • CHAPTER 6: DROPSHIPPING MARKET, BY REGION

    • 6.1 Overview

      • 6.1.1 Market size and forecast

    • 6.2 North America

      • 6.2.1 Key trends and opportunities

      • 6.2.2 North America Market size and forecast, by Product

      • 6.2.3 North America Market size and forecast, by Destination

      • 6.2.4 North America Market size and forecast, by country

        • 6.2.4.1 U.S.
          • 6.2.4.1.1 Market size and forecast, by Product
          • 6.2.4.1.2 Market size and forecast, by Destination
        • 6.2.4.2 Canada
          • 6.2.4.2.1 Market size and forecast, by Product
          • 6.2.4.2.2 Market size and forecast, by Destination
        • 6.2.4.3 Mexico
          • 6.2.4.3.1 Market size and forecast, by Product
          • 6.2.4.3.2 Market size and forecast, by Destination
    • 6.3 Europe

      • 6.3.1 Key trends and opportunities

      • 6.3.2 Europe Market size and forecast, by Product

      • 6.3.3 Europe Market size and forecast, by Destination

      • 6.3.4 Europe Market size and forecast, by country

        • 6.3.4.1 UK
          • 6.3.4.1.1 Market size and forecast, by Product
          • 6.3.4.1.2 Market size and forecast, by Destination
        • 6.3.4.2 France
          • 6.3.4.2.1 Market size and forecast, by Product
          • 6.3.4.2.2 Market size and forecast, by Destination
        • 6.3.4.3 Germany
          • 6.3.4.3.1 Market size and forecast, by Product
          • 6.3.4.3.2 Market size and forecast, by Destination
        • 6.3.4.4 Italy
          • 6.3.4.4.1 Market size and forecast, by Product
          • 6.3.4.4.2 Market size and forecast, by Destination
        • 6.3.4.5 Spain
          • 6.3.4.5.1 Market size and forecast, by Product
          • 6.3.4.5.2 Market size and forecast, by Destination
        • 6.3.4.6 Rest of Europe
          • 6.3.4.6.1 Market size and forecast, by Product
          • 6.3.4.6.2 Market size and forecast, by Destination
    • 6.4 Asia-Pacific

      • 6.4.1 Key trends and opportunities

      • 6.4.2 Asia-Pacific Market size and forecast, by Product

      • 6.4.3 Asia-Pacific Market size and forecast, by Destination

      • 6.4.4 Asia-Pacific Market size and forecast, by country

        • 6.4.4.1 China
          • 6.4.4.1.1 Market size and forecast, by Product
          • 6.4.4.1.2 Market size and forecast, by Destination
        • 6.4.4.2 India
          • 6.4.4.2.1 Market size and forecast, by Product
          • 6.4.4.2.2 Market size and forecast, by Destination
        • 6.4.4.3 Japan
          • 6.4.4.3.1 Market size and forecast, by Product
          • 6.4.4.3.2 Market size and forecast, by Destination
        • 6.4.4.4 South Korea
          • 6.4.4.4.1 Market size and forecast, by Product
          • 6.4.4.4.2 Market size and forecast, by Destination
        • 6.4.4.5 Australia
          • 6.4.4.5.1 Market size and forecast, by Product
          • 6.4.4.5.2 Market size and forecast, by Destination
        • 6.4.4.6 Rest of Asia-Pacific
          • 6.4.4.6.1 Market size and forecast, by Product
          • 6.4.4.6.2 Market size and forecast, by Destination
    • 6.5 LAMEA

      • 6.5.1 Key trends and opportunities

      • 6.5.2 LAMEA Market size and forecast, by Product

      • 6.5.3 LAMEA Market size and forecast, by Destination

      • 6.5.4 LAMEA Market size and forecast, by country

        • 6.5.4.1 Latin America
          • 6.5.4.1.1 Market size and forecast, by Product
          • 6.5.4.1.2 Market size and forecast, by Destination
        • 6.5.4.2 Middle East
          • 6.5.4.2.1 Market size and forecast, by Product
          • 6.5.4.2.2 Market size and forecast, by Destination
        • 6.5.4.3 Africa
          • 6.5.4.3.1 Market size and forecast, by Product
          • 6.5.4.3.2 Market size and forecast, by Destination
  • CHAPTER 7: COMPANY LANDSCAPE

    • 7.1. Introduction

    • 7.2. Top winning strategies

    • 7.3. Product Mapping of Top 10 Player

    • 7.4. Competitive Dashboard

    • 7.5. Competitive Heatmap

    • 7.6. Key developments

  • CHAPTER 8: COMPANY PROFILES

    • 8.1 Alidropship

      • 8.1.1 Company overview

      • 8.1.2 Company snapshot

      • 8.1.3 Operating business segments

      • 8.1.4 Product portfolio

      • 8.1.5 Business performance

      • 8.1.6 Key strategic moves and developments

    • 8.2 Doba Inc.

      • 8.2.1 Company overview

      • 8.2.2 Company snapshot

      • 8.2.3 Operating business segments

      • 8.2.4 Product portfolio

      • 8.2.5 Business performance

      • 8.2.6 Key strategic moves and developments

    • 8.3 Inventory Source

      • 8.3.1 Company overview

      • 8.3.2 Company snapshot

      • 8.3.3 Operating business segments

      • 8.3.4 Product portfolio

      • 8.3.5 Business performance

      • 8.3.6 Key strategic moves and developments

    • 8.4 Megagoods Inc.

      • 8.4.1 Company overview

      • 8.4.2 Company snapshot

      • 8.4.3 Operating business segments

      • 8.4.4 Product portfolio

      • 8.4.5 Business performance

      • 8.4.6 Key strategic moves and developments

    • 8.5 Modalyst Inc.

      • 8.5.1 Company overview

      • 8.5.2 Company snapshot

      • 8.5.3 Operating business segments

      • 8.5.4 Product portfolio

      • 8.5.5 Business performance

      • 8.5.6 Key strategic moves and developments

    • 8.6 SaleHoo Group Limited

      • 8.6.1 Company overview

      • 8.6.2 Company snapshot

      • 8.6.3 Operating business segments

      • 8.6.4 Product portfolio

      • 8.6.5 Business performance

      • 8.6.6 Key strategic moves and developments

    • 8.7 Shopify Inc.

      • 8.7.1 Company overview

      • 8.7.2 Company snapshot

      • 8.7.3 Operating business segments

      • 8.7.4 Product portfolio

      • 8.7.5 Business performance

      • 8.7.6 Key strategic moves and developments

    • 8.8 Sunrise Wholesale Merchandise LLC

      • 8.8.1 Company overview

      • 8.8.2 Company snapshot

      • 8.8.3 Operating business segments

      • 8.8.4 Product portfolio

      • 8.8.5 Business performance

      • 8.8.6 Key strategic moves and developments

    • 8.9 Printify

      • 8.9.1 Company overview

      • 8.9.2 Company snapshot

      • 8.9.3 Operating business segments

      • 8.9.4 Product portfolio

      • 8.9.5 Business performance

      • 8.9.6 Key strategic moves and developments

    • 8.10 Cin7 Orderhive Inc.

      • 8.10.1 Company overview

      • 8.10.2 Company snapshot

      • 8.10.3 Operating business segments

      • 8.10.4 Product portfolio

      • 8.10.5 Business performance

      • 8.10.6 Key strategic moves and developments

    • 8.11 Wholesale2b

      • 8.11.1 Company overview

      • 8.11.2 Company snapshot

      • 8.11.3 Operating business segments

      • 8.11.4 Product portfolio

      • 8.11.5 Business performance

      • 8.11.6 Key strategic moves and developments

  • LIST OF TABLES

  • TABLE 1. GLOBAL DROPSHIPPING MARKET, BY PRODUCT, 2021-2031 ($BILLION)
    TABLE 2. DROPSHIPPING MARKET, FOR ELECTRONICS, BY REGION, 2021-2031 ($BILLION)
    TABLE 3. DROPSHIPPING MARKET FOR ELECTRONICS, BY COUNTRY, 2021-2031 ($BILLION)
    TABLE 4. DROPSHIPPING MARKET, FOR FASHION, BY REGION, 2021-2031 ($BILLION)
    TABLE 5. DROPSHIPPING MARKET FOR FASHION, BY COUNTRY, 2021-2031 ($BILLION)
    TABLE 6. DROPSHIPPING MARKET, FOR TOYS, HOBBY, AND DIY, BY REGION, 2021-2031 ($BILLION)
    TABLE 7. DROPSHIPPING MARKET FOR TOYS, HOBBY, AND DIY, BY COUNTRY, 2021-2031 ($BILLION)
    TABLE 8. DROPSHIPPING MARKET, FOR FURNITURE, BY REGION, 2021-2031 ($BILLION)
    TABLE 9. DROPSHIPPING MARKET FOR FURNITURE, BY COUNTRY, 2021-2031 ($BILLION)
    TABLE 10. DROPSHIPPING MARKET, FOR BEAUTY, HEALTH, PERSONAL, AND HOUSEHOLD CARE, BY REGION, 2021-2031 ($BILLION)
    TABLE 11. DROPSHIPPING MARKET FOR BEAUTY, HEALTH, PERSONAL, AND HOUSEHOLD CARE, BY COUNTRY, 2021-2031 ($BILLION)
    TABLE 12. DROPSHIPPING MARKET, FOR OTHERS, BY REGION, 2021-2031 ($BILLION)
    TABLE 13. DROPSHIPPING MARKET FOR OTHERS, BY COUNTRY, 2021-2031 ($BILLION)
    TABLE 14. GLOBAL DROPSHIPPING MARKET, BY DESTINATION, 2021-2031 ($BILLION)
    TABLE 15. DROPSHIPPING MARKET, FOR DOMESTIC, BY REGION, 2021-2031 ($BILLION)
    TABLE 16. DROPSHIPPING MARKET FOR DOMESTIC, BY COUNTRY, 2021-2031 ($BILLION)
    TABLE 17. DROPSHIPPING MARKET, FOR INTERNATIONAL, BY REGION, 2021-2031 ($BILLION)
    TABLE 18. DROPSHIPPING MARKET FOR INTERNATIONAL, BY COUNTRY, 2021-2031 ($BILLION)
    TABLE 19. DROPSHIPPING MARKET, BY REGION, 2021-2031 ($BILLION)
    TABLE 20. NORTH AMERICA DROPSHIPPING MARKET, BY PRODUCT, 2021-2031 ($BILLION)
    TABLE 21. NORTH AMERICA DROPSHIPPING MARKET, BY DESTINATION, 2021-2031 ($BILLION)
    TABLE 22. NORTH AMERICA DROPSHIPPING MARKET, BY COUNTRY, 2021-2031 ($BILLION)
    TABLE 23. U.S. DROPSHIPPING MARKET, BY PRODUCT, 2021-2031 ($BILLION)
    TABLE 24. U.S. DROPSHIPPING MARKET, BY DESTINATION, 2021-2031 ($BILLION)
    TABLE 25. CANADA DROPSHIPPING MARKET, BY PRODUCT, 2021-2031 ($BILLION)
    TABLE 26. CANADA DROPSHIPPING MARKET, BY DESTINATION, 2021-2031 ($BILLION)
    TABLE 27. MEXICO DROPSHIPPING MARKET, BY PRODUCT, 2021-2031 ($BILLION)
    TABLE 28. MEXICO DROPSHIPPING MARKET, BY DESTINATION, 2021-2031 ($BILLION)
    TABLE 29. EUROPE DROPSHIPPING MARKET, BY PRODUCT, 2021-2031 ($BILLION)
    TABLE 30. EUROPE DROPSHIPPING MARKET, BY DESTINATION, 2021-2031 ($BILLION)
    TABLE 31. EUROPE DROPSHIPPING MARKET, BY COUNTRY, 2021-2031 ($BILLION)
    TABLE 32. UK DROPSHIPPING MARKET, BY PRODUCT, 2021-2031 ($BILLION)
    TABLE 33. UK DROPSHIPPING MARKET, BY DESTINATION, 2021-2031 ($BILLION)
    TABLE 34. FRANCE DROPSHIPPING MARKET, BY PRODUCT, 2021-2031 ($BILLION)
    TABLE 35. FRANCE DROPSHIPPING MARKET, BY DESTINATION, 2021-2031 ($BILLION)
    TABLE 36. GERMANY DROPSHIPPING MARKET, BY PRODUCT, 2021-2031 ($BILLION)
    TABLE 37. GERMANY DROPSHIPPING MARKET, BY DESTINATION, 2021-2031 ($BILLION)
    TABLE 38. ITALY DROPSHIPPING MARKET, BY PRODUCT, 2021-2031 ($BILLION)
    TABLE 39. ITALY DROPSHIPPING MARKET, BY DESTINATION, 2021-2031 ($BILLION)
    TABLE 40. SPAIN DROPSHIPPING MARKET, BY PRODUCT, 2021-2031 ($BILLION)
    TABLE 41. SPAIN DROPSHIPPING MARKET, BY DESTINATION, 2021-2031 ($BILLION)
    TABLE 42. REST OF EUROPE DROPSHIPPING MARKET, BY PRODUCT, 2021-2031 ($BILLION)
    TABLE 43. REST OF EUROPE DROPSHIPPING MARKET, BY DESTINATION, 2021-2031 ($BILLION)
    TABLE 44. ASIA-PACIFIC DROPSHIPPING MARKET, BY PRODUCT, 2021-2031 ($BILLION)
    TABLE 45. ASIA-PACIFIC DROPSHIPPING MARKET, BY DESTINATION, 2021-2031 ($BILLION)
    TABLE 46. ASIA-PACIFIC DROPSHIPPING MARKET, BY COUNTRY, 2021-2031 ($BILLION)
    TABLE 47. CHINA DROPSHIPPING MARKET, BY PRODUCT, 2021-2031 ($BILLION)
    TABLE 48. CHINA DROPSHIPPING MARKET, BY DESTINATION, 2021-2031 ($BILLION)
    TABLE 49. INDIA DROPSHIPPING MARKET, BY PRODUCT, 2021-2031 ($BILLION)
    TABLE 50. INDIA DROPSHIPPING MARKET, BY DESTINATION, 2021-2031 ($BILLION)
    TABLE 51. JAPAN DROPSHIPPING MARKET, BY PRODUCT, 2021-2031 ($BILLION)
    TABLE 52. JAPAN DROPSHIPPING MARKET, BY DESTINATION, 2021-2031 ($BILLION)
    TABLE 53. SOUTH KOREA DROPSHIPPING MARKET, BY PRODUCT, 2021-2031 ($BILLION)
    TABLE 54. SOUTH KOREA DROPSHIPPING MARKET, BY DESTINATION, 2021-2031 ($BILLION)
    TABLE 55. AUSTRALIA DROPSHIPPING MARKET, BY PRODUCT, 2021-2031 ($BILLION)
    TABLE 56. AUSTRALIA DROPSHIPPING MARKET, BY DESTINATION, 2021-2031 ($BILLION)
    TABLE 57. REST OF ASIA-PACIFIC DROPSHIPPING MARKET, BY PRODUCT, 2021-2031 ($BILLION)
    TABLE 58. REST OF ASIA-PACIFIC DROPSHIPPING MARKET, BY DESTINATION, 2021-2031 ($BILLION)
    TABLE 59. LAMEA DROPSHIPPING MARKET, BY PRODUCT, 2021-2031 ($BILLION)
    TABLE 60. LAMEA DROPSHIPPING MARKET, BY DESTINATION, 2021-2031 ($BILLION)
    TABLE 61. LAMEA DROPSHIPPING MARKET, BY COUNTRY, 2021-2031 ($BILLION)
    TABLE 62. LATIN AMERICA DROPSHIPPING MARKET, BY PRODUCT, 2021-2031 ($BILLION)
    TABLE 63. LATIN AMERICA DROPSHIPPING MARKET, BY DESTINATION, 2021-2031 ($BILLION)
    TABLE 64. MIDDLE EAST DROPSHIPPING MARKET, BY PRODUCT, 2021-2031 ($BILLION)
    TABLE 65. MIDDLE EAST DROPSHIPPING MARKET, BY DESTINATION, 2021-2031 ($BILLION)
    TABLE 66. AFRICA DROPSHIPPING MARKET, BY PRODUCT, 2021-2031 ($BILLION)
    TABLE 67. AFRICA DROPSHIPPING MARKET, BY DESTINATION, 2021-2031 ($BILLION)
    TABLE 68.ALIDROPSHIP: COMPANY SNAPSHOT
    TABLE 69.ALIDROPSHIP: OPERATING SEGMENTS
    TABLE 70.ALIDROPSHIP: PRODUCT PORTFOLIO
    TABLE 71.ALIDROPSHIP: NET SALES,
    TABLE 72.ALIDROPSHIP: KEY STRATERGIES
    TABLE 73.DOBA INC.: COMPANY SNAPSHOT
    TABLE 74.DOBA INC.: OPERATING SEGMENTS
    TABLE 75.DOBA INC.: PRODUCT PORTFOLIO
    TABLE 76.DOBA INC.: NET SALES,
    TABLE 77.DOBA INC.: KEY STRATERGIES
    TABLE 78.INVENTORY SOURCE: COMPANY SNAPSHOT
    TABLE 79.INVENTORY SOURCE: OPERATING SEGMENTS
    TABLE 80.INVENTORY SOURCE: PRODUCT PORTFOLIO
    TABLE 81.INVENTORY SOURCE: NET SALES,
    TABLE 82.INVENTORY SOURCE: KEY STRATERGIES
    TABLE 83.MEGAGOODS INC.: COMPANY SNAPSHOT
    TABLE 84.MEGAGOODS INC.: OPERATING SEGMENTS
    TABLE 85.MEGAGOODS INC.: PRODUCT PORTFOLIO
    TABLE 86.MEGAGOODS INC.: NET SALES,
    TABLE 87.MEGAGOODS INC.: KEY STRATERGIES
    TABLE 88.MODALYST INC.: COMPANY SNAPSHOT
    TABLE 89.MODALYST INC.: OPERATING SEGMENTS
    TABLE 90.MODALYST INC.: PRODUCT PORTFOLIO
    TABLE 91.MODALYST INC.: NET SALES,
    TABLE 92.MODALYST INC.: KEY STRATERGIES
    TABLE 93.SALEHOO GROUP LIMITED: COMPANY SNAPSHOT
    TABLE 94.SALEHOO GROUP LIMITED: OPERATING SEGMENTS
    TABLE 95.SALEHOO GROUP LIMITED: PRODUCT PORTFOLIO
    TABLE 96.SALEHOO GROUP LIMITED: NET SALES,
    TABLE 97.SALEHOO GROUP LIMITED: KEY STRATERGIES
    TABLE 98.SHOPIFY INC.: COMPANY SNAPSHOT
    TABLE 99.SHOPIFY INC.: OPERATING SEGMENTS
    TABLE 100.SHOPIFY INC.: PRODUCT PORTFOLIO
    TABLE 101.SHOPIFY INC.: NET SALES,
    TABLE 102.SHOPIFY INC.: KEY STRATERGIES
    TABLE 103.SUNRISE WHOLESALE MERCHANDISE LLC: COMPANY SNAPSHOT
    TABLE 104.SUNRISE WHOLESALE MERCHANDISE LLC: OPERATING SEGMENTS
    TABLE 105.SUNRISE WHOLESALE MERCHANDISE LLC: PRODUCT PORTFOLIO
    TABLE 106.SUNRISE WHOLESALE MERCHANDISE LLC: NET SALES,
    TABLE 107.SUNRISE WHOLESALE MERCHANDISE LLC: KEY STRATERGIES
    TABLE 108.PRINTIFY: COMPANY SNAPSHOT
    TABLE 109.PRINTIFY: OPERATING SEGMENTS
    TABLE 110.PRINTIFY: PRODUCT PORTFOLIO
    TABLE 111.PRINTIFY: NET SALES,
    TABLE 112.PRINTIFY: KEY STRATERGIES
    TABLE 113.CIN7 ORDERHIVE INC.: COMPANY SNAPSHOT
    TABLE 114.CIN7 ORDERHIVE INC.: OPERATING SEGMENTS
    TABLE 115.CIN7 ORDERHIVE INC.: PRODUCT PORTFOLIO
    TABLE 116.CIN7 ORDERHIVE INC.: NET SALES,
    TABLE 117.CIN7 ORDERHIVE INC.: KEY STRATERGIES
    TABLE 118.WHOLESALE2B: COMPANY SNAPSHOT
    TABLE 119.WHOLESALE2B: OPERATING SEGMENTS
    TABLE 120.WHOLESALE2B: PRODUCT PORTFOLIO
    TABLE 121.WHOLESALE2B: NET SALES,
    TABLE 122.WHOLESALE2B: KEY STRATERGIES
  • LIST OF FIGURES

  • FIGURE 1.DROPSHIPPING MARKET SEGMENTATION
    FIGURE 2.DROPSHIPPING MARKET,2021-2031
    FIGURE 3.DROPSHIPPING MARKET,2021-2031
    FIGURE 4. TOP INVESTMENT POCKETS, BY REGION
    FIGURE 5.PORTER FIVE-1
    FIGURE 6.PORTER FIVE-2
    FIGURE 7.PORTER FIVE-3
    FIGURE 8.PORTER FIVE-4
    FIGURE 9.PORTER FIVE-5
    FIGURE 10.TOP PLAYER POSITIONING
    FIGURE 11.DROPSHIPPING MARKET:DRIVERS, RESTRAINTS AND OPPORTUNITIES
    FIGURE 12.DROPSHIPPING MARKET,BY PRODUCT,2021(%)
    FIGURE 13.COMPARATIVE SHARE ANALYSIS OF ELECTRONICS DROPSHIPPING MARKET,2021-2031(%)
    FIGURE 14.COMPARATIVE SHARE ANALYSIS OF FASHION DROPSHIPPING MARKET,2021-2031(%)
    FIGURE 15.COMPARATIVE SHARE ANALYSIS OF TOYS, HOBBY, AND DIY DROPSHIPPING MARKET,2021-2031(%)
    FIGURE 16.COMPARATIVE SHARE ANALYSIS OF FURNITURE DROPSHIPPING MARKET,2021-2031(%)
    FIGURE 17.COMPARATIVE SHARE ANALYSIS OF BEAUTY, HEALTH, PERSONAL, AND HOUSEHOLD CARE DROPSHIPPING MARKET,2021-2031(%)
    FIGURE 18.COMPARATIVE SHARE ANALYSIS OF OTHERS DROPSHIPPING MARKET,2021-2031(%)
    FIGURE 19.DROPSHIPPING MARKET,BY DESTINATION,2021(%)
    FIGURE 20.COMPARATIVE SHARE ANALYSIS OF DOMESTIC DROPSHIPPING MARKET,2021-2031(%)
    FIGURE 21.COMPARATIVE SHARE ANALYSIS OF INTERNATIONAL DROPSHIPPING MARKET,2021-2031(%)
    FIGURE 22.DROPSHIPPING MARKET BY REGION,2021
    FIGURE 23.U.S. DROPSHIPPING MARKET,2021-2031($BILLION)
    FIGURE 24.CANADA DROPSHIPPING MARKET,2021-2031($BILLION)
    FIGURE 25.MEXICO DROPSHIPPING MARKET,2021-2031($BILLION)
    FIGURE 26.UK DROPSHIPPING MARKET,2021-2031($BILLION)
    FIGURE 27.FRANCE DROPSHIPPING MARKET,2021-2031($BILLION)
    FIGURE 28.GERMANY DROPSHIPPING MARKET,2021-2031($BILLION)
    FIGURE 29.ITALY DROPSHIPPING MARKET,2021-2031($BILLION)
    FIGURE 30.SPAIN DROPSHIPPING MARKET,2021-2031($BILLION)
    FIGURE 31.REST OF EUROPE DROPSHIPPING MARKET,2021-2031($BILLION)
    FIGURE 32.CHINA DROPSHIPPING MARKET,2021-2031($BILLION)
    FIGURE 33.INDIA DROPSHIPPING MARKET,2021-2031($BILLION)
    FIGURE 34.JAPAN DROPSHIPPING MARKET,2021-2031($BILLION)
    FIGURE 35.SOUTH KOREA DROPSHIPPING MARKET,2021-2031($BILLION)
    FIGURE 36.AUSTRALIA DROPSHIPPING MARKET,2021-2031($BILLION)
    FIGURE 37.REST OF ASIA-PACIFIC DROPSHIPPING MARKET,2021-2031($BILLION)
    FIGURE 38.LATIN AMERICA DROPSHIPPING MARKET,2021-2031($BILLION)
    FIGURE 39.MIDDLE EAST DROPSHIPPING MARKET,2021-2031($BILLION)
    FIGURE 40.AFRICA DROPSHIPPING MARKET,2021-2031($BILLION)
    FIGURE 41. TOP WINNING STRATEGIES, BY YEAR
    FIGURE 42. TOP WINNING STRATEGIES, BY DEVELOPMENT
    FIGURE 43. TOP WINNING STRATEGIES, BY COMPANY
    FIGURE 44.PRODUCT MAPPING OF TOP 10 PLAYERS
    FIGURE 45.COMPETITIVE DASHBOARD
    FIGURE 46.COMPETITIVE HEATMAP OF TOP 10 KEY PLAYERS
    FIGURE 47.ALIDROPSHIP.: NET SALES ,($BILLION)
    FIGURE 48.DOBA INC..: NET SALES ,($BILLION)
    FIGURE 49.INVENTORY SOURCE.: NET SALES ,($BILLION)
    FIGURE 50.MEGAGOODS INC..: NET SALES ,($BILLION)
    FIGURE 51.MODALYST INC..: NET SALES ,($BILLION)
    FIGURE 52.SALEHOO GROUP LIMITED.: NET SALES ,($BILLION)
    FIGURE 53.SHOPIFY INC..: NET SALES ,($BILLION)
    FIGURE 54.SUNRISE WHOLESALE MERCHANDISE LLC.: NET SALES ,($BILLION)
    FIGURE 55.PRINTIFY.: NET SALES ,($BILLION)
    FIGURE 56.CIN7 ORDERHIVE INC..: NET SALES ,($BILLION)
    FIGURE 57.WHOLESALE2B.: NET SALES ,($BILLION)


According to CXOs of leading companies, presently, the dropshipping market is witnessing a steady growth. Nowadays, consumers prefer online shopping as there are many websites to choose products from. In addition, e-commerce platforms also help many businesses reach their customers easily, achieving necessary in-store presence. This sector is driven by rise in importance of online marketing tools such as Google Ads and Facebook Ads. E-commerce is one of the mature industries in the U.S. and consumers are leaning toward the same. According to the Census Bureau of the Department of Commerce, U.S. retail e-commerce sales were $257.3 billion for the second quarter of 2022, an increase of 2.7% from the first quarter of 2022.

Rise in penetration of e-commerce platforms, various retailers are opting for dropshipping services to reduce capital costs of inventory purchases. Rise in demand for numerous products, such as electronics and fashion, opens up several avenues for dropshipping. For instance, Dropshipzone, an India based dropshipping company offers hardware, home storage, kitchenware, men's apparel, and mobile accessories in product category. Furthermore, less overhead costs and broad product portfolio are some of the factors projected to fuel the market growth. Moreover, fewer capital investments in inventory and logistics have resulted in an increased demand for dropshipping among retailers.

Among the analyzed regions, North America is the highest revenue contributor, followed by Asia-Pacific, Europe, and LAMEA. On the basis of forecast analysis, LAMEA is expected to grow at a significant rate during the forecast period, owing to the expansion in the e-commerce industry. Furthermore, extensive utilization of various electronic goods to place an order, inflating disposable incomes, rising consumer expenditure power, and strategic collaborations amongst key players are the significant factors propelling the market growth.

PURCHASE OPTIONS

Call or Email us

U.S.-Canada Toll-free: +1-800-792-5285
Int'l : +1-503-894-6022
Europe : +44-845-528-1300
Email : help@alliedmarketresearch.com
 
FREQUENTLY ASKED QUESTIONS?

A. The global dropshipping market was valued at $155.6 billion in 2021, and is projected to reach $1,670.1 billion by 2031, registering a CAGR of 27.1% from 2022 to 2031

A. The leading players operating in the dropshipping market are AliDropship, Doba Inc., Inventory Source, Megagoods, Inc, Modalyst, Inc, SaleHoo Group Limited, Shopify Inc., Sunrise Wholesale Merchandise, LLC, Printify, Cin7 Orderhive Inc. and Wholesale2b

A. North America is the largest regional market for dropshipping

A. Usage in Beauty, Health, Personal, & Household Care industries is the leading application of dropshipping market

A. Increased usage in different industries are the upcoming trends of dropshipping market in the world

Looking for Customization?

 Customization Request

Have a Question?

 Speak with Analyst

Any Confusion?

 Inquire Before Buying

Have a glance of the Report

  Request Sample
RELATED TAGS

Purchase Full Report of
Dropshipping Market

Start reading instantly.
This Report and over 66,782+ more Reports, Available with Avenue Library. T&C*.

  • Online Only
  • $3,570
  • Online cloud access only
  • Restricted print, copy, paste & download
  • Read only
  • Free industry update
    (Within 180 days)
  • Free report update in next update cycle
    (Oct 2023 - Oct 2024)
  • Data Pack
  • $3,840
  • Restricted to one authorized user
  • One print only
  • Available in
    Excel
  • Free industry update
    (Within 180 days)
  •   Free report update in next update cycle
    (Oct 2023 - Oct 2024)
  • Single User
  • $5,730
  • Restricted to one authorized user
  • One print only
  • Available in
    PDF
  • Free industry update
    (Within 180 days)
  •   Free report update in next update cycle
    (Oct 2023 - Oct 2024)
  • Five Users
  • $6,450
  • Limited to five authorized users
  • Print upto five copies
  • Available in
    PDF
  • Free industry update
    (Within 180 days)
  •   Free report update in next update cycle
    (Oct 2023 - Oct 2024)
  • Enterprise
    License/PDF

  • $9,600
  • Unlimited
    within
    company/enterprise
  • Available in Excel & PDF
  • Free industry update
    (Within 180 days)
  •   Free report update in next update cycle
    (Oct 2023 - Oct 2024)
  • Library
    Membership

  • $999 $ 1,175
    Per User/ Per month/ Billed annually
  • Published Content
    E-access
  • Company Profiles
    E-access
  • Newly Added Content Access
  • 10 PDF
    Downloads
  • 5 Excel Data
    Pack Downloads
  • 250 Company Profiles PDF Downloads
  • Buy Now

*Taxes/Fees, if applicable will be added during checkout. All prices in USD

RELATED REPORTS
 

Why Allied Market Research?


Infallible Methodology

To ensure high-level data integrity, accurate analysis, and impeccable forecasts

Analyst Support

For complete satisfaction

Customization

On-demand customization of scope of the report to exactly meet your needs

TARGETED MARKET VIEW

Targeted market view to provide pertinent information and save time of readers

Get fresh content delivered

Get insights on topics that are crucial for your business. Stay abreast of your interest areas.

Get Industry Data Alerts

Why Allied Market Research?

Infallible Methodology

To ensure high-level data integrity, accurate analysis, and impeccable forecasts

Analyst Support

For complete satisfaction

Customization

On-demand customization of scope of the report to exactly meet your needs

TARGETED MARKET VIEW

Targeted market view to provide pertinent information and save time of readers