
E-SUV Market Statistics 2030 -
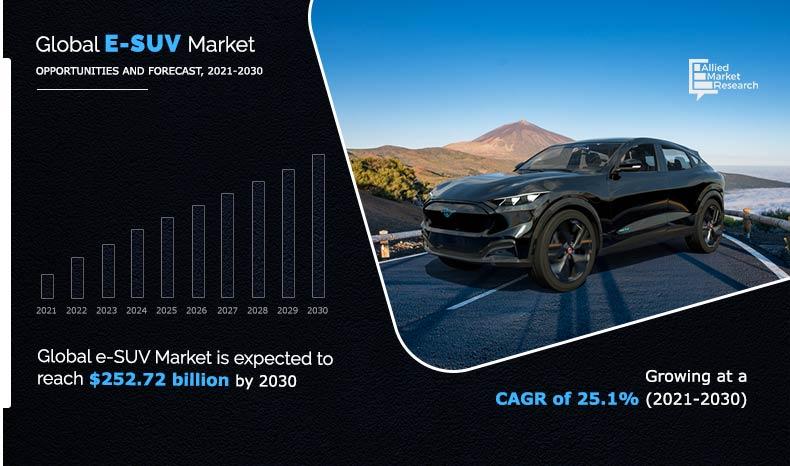
The global e-SUV market was valued at $35,572.5 million in 2020, and is projected to reach $252,721.7 million by 2030, registering a CAGR of 25.1%. Asia-Pacific was the highest revenue contributor, accounting for $13,926.6 million in 2020, and is estimated to reach $111,071.2 million by 2030, with a CAGR of 27.0%.
E-SUV refers to the electric sports utility vehicle, which drives through the hybrid or battery electric propulsion systems that combines off-road vehicle as well as road-going passenger vehicle. E-SUV are equipped with all-wheel drive (AWD) or four-wheel drive system (4WD) to operate on both rough terrain surface and public roads to attain operational requirements. E-SUV is a popular amongst the electric passenger vehicle owners, owing to its operational capability, high end technology enabled vehicles, along with improved safety. E-SUV has several benefits over conventional automotive, including improved vehicle dynamics, reduced fuel consumption, and low noise electric drive. However, e-SUV is associated with high cost from all aspects such as acquisition cost and maintenance cost compared to other passenger vehicles.
Factors, such as increase in penetration of fuel-efficient mobility solution and decrease in battery cost per KWH are expected to drive growth of the e-SUV market. However, decrease in sales and production of automotive and high manufacturing cost of electric driven SUV restrain the market growth. On the contrary, growth in developing nations, and development of e-SUV integrated with high-end technologies are projected to offer lucrative growth opportunities for the market players.
The global e-SUV market is segmented on the basis of propulsion, type, seating capacity, and region. On the basis of propulsion, the market is divided into battery electric vehicle and hybrid vehicle. On the basis of type, it is categorized into compact crossover, crossover, mid-size, and full-size. By seating capacity, it is fragmented into 5-seater, and 6-seater, and above. Region-wise, the market is analyzed across North America, Europe, Asia-Pacific, and LAMEA.
Leading players and their key business strategies have been analyzed in the report to gain a competitive insight into the market. Key players covered in the report include BMW Group, BYD Company Limited, Daimler AG, Ford Motor Company, Groupe Renault, Honda Motor Co., Ltd, Kia Corporation, Tata Motors, Tesla, Volkswagen AG, and Volvo Car Corporation.
Increase in penetration of fuel-efficient mobility solution
In the recent years, the automotive industry has witnessed drastic change in terms of technological evolution. To cater to the changing demands of consumers, OEMs are relying on electrical components, owing to their output efficiency and lightweight; thus, making vehicle electrification a fuel economic solution. In addition, hybrid and electric vehicles are fuel efficient transportation solution as compare to gasoline-driven vehicles. Moreover, emission from vehicles is a crucial factor, as harmful greenhouse gases are released, which increase environmental and health concerns. Thus, governments across the globe are implementing vehicle emission norms to control greenhouse emission and maintain environmental balance. Manufacturers need to comply with these regulations to control the emission level. For instance, from April 2020, the Government of India implemented the BS6 emission standard to control the outflow of air pollutants from vehicles. Furthermore, electrification is the future step as majority of the carmakers are in-lining toward the hybrid driven vehicles development to cater the changing requirement of the end users and policy makers to cope up with green mobility requirements. For instance, in 2021, Groupe Renault goals to achieve 35% from hybrid models and 30% of sales from fully electric cars by 2025. Thus, all these factors collectively escalate the demand for e-SUV in the near future.
By Propulsion
Hybrid Vehicle segment is projected as the most lucrative segments
Decrease in sales and production of automotive
The automotive industry has witnessed decline in the overall growth from the last straight three years, which results in reduced sales as well as production of automotive. This is majorly attributed to changes in manufacturing standard of the automotive and low consumer confidence for buying the vehicles due to uncertainty in the government regulations regarding emission and safety, which, in turn, increases the prices of automotive. The growth of the e-SUV market movement is completely dependent on the automotive industry outlook. Thus, lowering automotive demand and weaken vehicle sales outlook is expected to hamper the growth of the overall market. According to OICA (Organisation Internationale des Constructeurs d'Automobiles) registered total automotive production of 95.6 Mn units in 2018, and it has reached 77.6 Mn units in 2020. Moreover, the automotive industry is witnessing slower growth than expected, which is likely to downturn the demand for e-SUV market in the upcoming years.
By Type
Mid-Size segment is projected as the most lucrative segments
High manufacturing cost of electric driven SUV
Electric driven vehicles are advantageous over conventional engine driven vehicles, but the cost of electric vehicles is much higher than internal combustion engine-powered vehicles. The main shortcomings of the existing lithium-ion battery technologies are their low energy density and high costs of manufacturing (a significant fraction of the total electric vehicle price). Electric vehicles are getting immensely popular across the globe. However, due to their high costs, the battery-powered vehicles have managed to occupy a low share in the sales of automobile in several countries. For instance, consumers in the UK purchased more than 75,000 electric cars in till October 2020. However, the UK market share of battery-powered cars was still only 5.5%. The cheapest electric cars available in the Europe market start at around $25,000. This is about twice the price of an entry-level gasoline-powered car. Electric sports utility vehicles are much spacious than the compact and mid-size passenger cars which directly influence the overall pricing of the vehicle by considering the material requirements and manufacturing cost. The high-cost factor associated with e-SUV is anticipated to hamper the growth of the e-SUV market over the forecast timeframe.
By Seating Capacity
5 seater segment is projected as the most lucrative segments
Development of e-SUV integrated with high-end technologies
Since their introduction, electric sports utility vehicles have witnessed several technological advancements in battery technologies, charging efficiency, and range. The improved efficiency of electric sports utility vehicles has resulted in the launch of several all-electric and hybrid models in the market. The International Energy Agency (IEA) predicts that the number of electric vehicles across the globe will be 125 million by 2030. Although the advancements in lithium-ion battery technologies have been quite slow over the years, the on-going improvements in the higher-yield fabrication process, anode & cathode material, cell chemistry, and economies of scale are anticipated to result in a significant reduction in battery cost over the years. Moreover, developments regarding the search for outdated lithium-ion battery alternatives, such as miniaturized solid oxide fuel cells, micro-capacitors, gold nanowire technology, aluminum-graphite, and graphene polymer, are anticipated to offer more efficient and viable electric sports utility vehicles over the years. A major issue with the current fleet of electric sports utility vehicles is the high charging time. To overcome this issue, companies, such as, Porche has developed a supercharging solution that can recharge the car in 15 minutes. Other players are also anticipated to deploy charging stations to provide hassle-free and fast recharging for electric sports utility vehicles across Europe. Such vital technological developments are projected to bolster the growth of the sports utility vehicles market over the forecast timeframe.
By Region
Asia-Pacific would exhibit the highest CAGR of 24.7% during 2021-2030.
Key Benefits For Stakeholders
This study presents analytical depiction of the global e-SUV market analysis along with the current trends and future estimations to depict imminent investment pockets.
The overall e-SUV market opportunity is determined by understanding profitable trends to gain a stronger foothold.
The report presents information related to key drivers, restraints, and opportunities of the global e-SUV market with a detailed impact analysis.
The current e-SUV market is quantitatively analyzed from 2020 to 2030 to benchmark the financial competency.
Porter’s five forces analysis illustrates the potency of the buyers and suppliers in the industry.
Key Market Segments
By propulsion
- Battery Electric Vehicle
- Hybrid Vehicle
By type
- Compact crossover
- Crossover
- Mid-size
- Full-size
By seating capacity
- 5 seater
- 6 seater and above
By Region
- North America
- US
- Canada
- Mexico
- Europe
- UK
- Germany
- France
- Spain
- Rest of Europe
- Asia-Pacific
- China
- Japan
- India
- South Korea
- Rest of Asia Pacific
- LAMEA
- Latin America
- Middle East
- Africa
Key Players
- BMW Group
- BYD Company Limited
- Daimler AG
- Ford Motor Company
- Groupe Renault
- Honda Motor Co., Ltd.
- Kia Corporation
- Tata Motors
- Tesla
- Volkswagen AG
- Volvo Car Corporation
E-SUV Market Report Highlights
| Aspects | Details |
| By PROPULSION |
|
| By TYPE |
|
| By SEATING CAPACITY |
|
| By Region |
|
| Key Market Players | BMW GROUP, BYD COMPANY LIMITED, FORD MOTOR COMPANY, GROUPE RENAULT, VOLKSWAGEN AG, TATA MOTORS, VOLVO CAR CORPORATION, TESLA, HONDA MOTOR CO., LTD., KIA CORPORATION, DAIMLER AG |
Analyst Review
The global e-SUV market is expected to witness significant growth, owing to adoption of electric mobility solution and attractive design solutions along with positive consumer sentiments as it is a symbol of status and wealth. SUV is witnessing significant growth in India, Germany and China due to changing consumer preferences toward SUV, improved safety & comfort, and becoming a status symbol of the end users. In Africa, rapid economic development and growing urbanization are anticipated to spur the demand for SUVs over the last decade. The dramatic shift toward heavier and bigger cars has led to doubling the SUVs market share over the decade, which in turn support the eSUV over the forecast period.
The global e-SUV market is a fairly consolidated market in which countable market participants are operating in the global market. Market participants are focused to introduce new product lines of e-SUV to cope up with changing requirement of end users and develop their sales footprints by expanding dealer network. Numerous developments have been carried out by top companies, such as BMW Group, BYD, Daimler AG, Ford Motor Company, and Renault which supplements growth of the global e-SUV market. Impacts of COVID-19 significantly affected the global e-SUV market in 2020. Furthermore, the market witnessed negative growth or significant downfall in 2020, and is expected to witness a recovery in 2022.
The global e-SUV market was valued at $35,572.5 million in 2020, and is projected to reach $252,721.7 million by 2030, registering a CAGR of 25.1%.
Market players are entering into developping nations to acquire the untapped potential of the market
The report sample for global e-SUV market report can be obtained on demand from the website.
Tesla, Volkswagen AG are the leading market participants of global e-SUV market
High peneration of electric vehicles and changing consumer prefence has witnessed significant growth in the global market. As per AMR analysis, the market is epxected to witness CAGR of 25.1% over the forecast period
The company profiles of the top players of the market can be obtained from the company profile section mentioned in the report. This section includes analysis of top ten player’s operating in the industry along with their last three-year revenue, segmental revenue, product offerings, key strategies adopted, and geographical revenue generated
Increase in penetration of fuel-efficient mobility solution, and Decrease in battery cost per KWH are the leadig drivers of the global market ehich create significant opportunity in the near future.
BMW Group, BYD Company Limited, Daimler AG, Ford Motor Company, Groupe Renault, Honda Motor Co., Ltd, Kia Corporation, Tata Motors, Tesla, Volkswagen AG, and Volvo Car Corporation are the leading manufacturers of the e-SUV
U.S., Germany and China are the key matured markets growing in the e-SUV market
Decrease in sales and production of automotive,Decrease in battery cost per KWH and high penetration of the electrifies vehicles are the known and unknown adjacencies impacting the e-SUV market
Loading Table Of Content...

