Report Code: A00483 | Jun 2021 | Pages: 239 | ||
Tables: 103 | Charts: 67 |
|
Pandemic disrupted the entire world and affected many industries.
Get detailed COVID-19 impact analysis on the E-waste Management Market
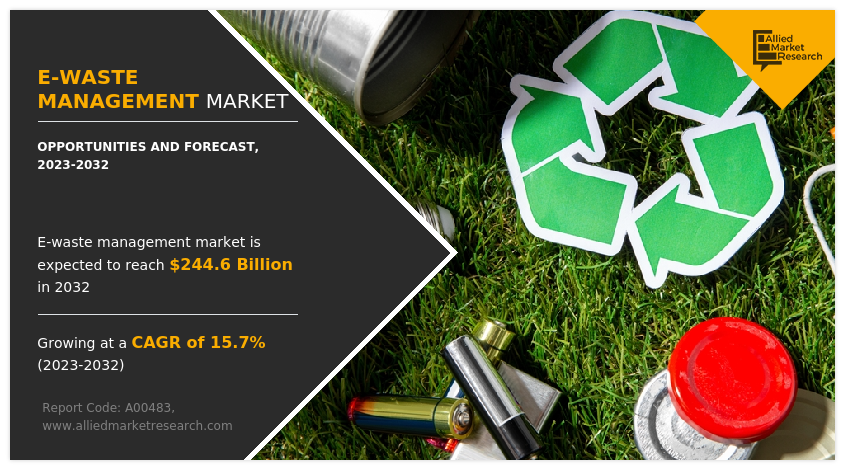
Request Now !The global e-waste management market size was valued at $49,880 million in 2020, and is projected to reach $143,870 million by 2028, registering a CAGR of 14.3% from 2021 to 2028. Ever increasing demand and scarcity of rare metals has been leading to rapid rise in prices of these metals. Such metals need to be recovered from e-waste for reuse in another production. For instance, in one million mobile phones in e-waste, there is around 250 kg of silver, 24 kg of gold, and nine tons of copper that can be recovered. This also benefits manufacturers to produce electronic devices with lower cost and gain cost advantages over competitors.
With offices and enterprises adopting mandatory work from home policies, there has been a greater adoption of laptops and mobile devices, thereby lowering the usage of office desktop and computers. This scenario has resulted in creating a recycling option for these equipment, which in turn is set to favor the market growth during the forecast period.Mandatory work from home polices adopted by both private and public organizations has boosted the adoption of mobile devices. For instance, as per the analysis by AMR, around 60 % businesses in Europe are planning to allow employees to work from home in the future. This scenario is estimated to create a lower adoption rate for enterprise IT equipment and accessories. For instance, in 2020, around 29% office desktop PC’s were abandoned and over 23% PCs are not expected to be required over the next year
E-waste contains special and precious metals including silver, gold, palladium, platinum, indium, and gallium. These scarce elements are widely used in production of consumer electronics and IT & communication devices. Due to scarcity of these metals, prices associated with their products is also high. This has increased the need to reuse, refurbish, and recycle devices made from metals. Thus, these issues certainly force manufacturers of electronic devices to look for raw materials available from recycled e-waste. This also benefits nations to reduce greenhouse gas emissions and certainly help reduce hazards of global warming.
Nature of electronic devices is such that they get obsolete or need repair from time to time. This is a major cause for the generation of e-waste. The cost of replacing an electronic device is lesser than those getting repaired. Therefore, it has been observed that there is a growth in tendency to purchase a new product rather than repairing them. This increased obsolescence rate is leading to huge generation of e-waste currently. This leads to reuse, refurbishment, and recycle of waste generated and creates the need to setup wide network of collection zones. In emerging countries, with strict regulatory frameworks and initiatives of electronic product manufacturers, there are expected to be more opportunities for management of obsolete products.
By processed material type, the global e-waste management market share was dominated by the metal segment in 2020, and is expected to maintain its dominance in the upcoming years. As electronic scrap has increased over the past decade due to revolutionary changes in electric and electronic sector, incineration and recycling of these materials have gained high traction. Moreover, increase in health hazards such as kidney damage, bronchitis, and other diseases, owing to scarce discharge of toxic materials from incineration and scrap has increased need for efficient scrap management techniques. Aforementioned factors are expected to drive growth of the segment in the global market during the forecast period.
By source type, the global e-waste management market was dominated by the household appliances segment in 2020, and is expected to maintain its dominance in the upcoming years. Household appliances constitute a major part of the e-waste across the world. This has generated need to formulate effective policies to manage tremendous volume of e-waste. Several countries have mandated manufacturers and importers to take-back electronic products for end-of-life management. Manufacturers can sell electronic scrap for reuse or forward it to other companies for recycling. For instance, in Japan under Home Appliances Recycling Law, consumers of appliances such as refrigerators, air conditioners, and washing machines have to forward them to retailers to send them to companies. These policies are creating conducive environment for recycling e-waste.
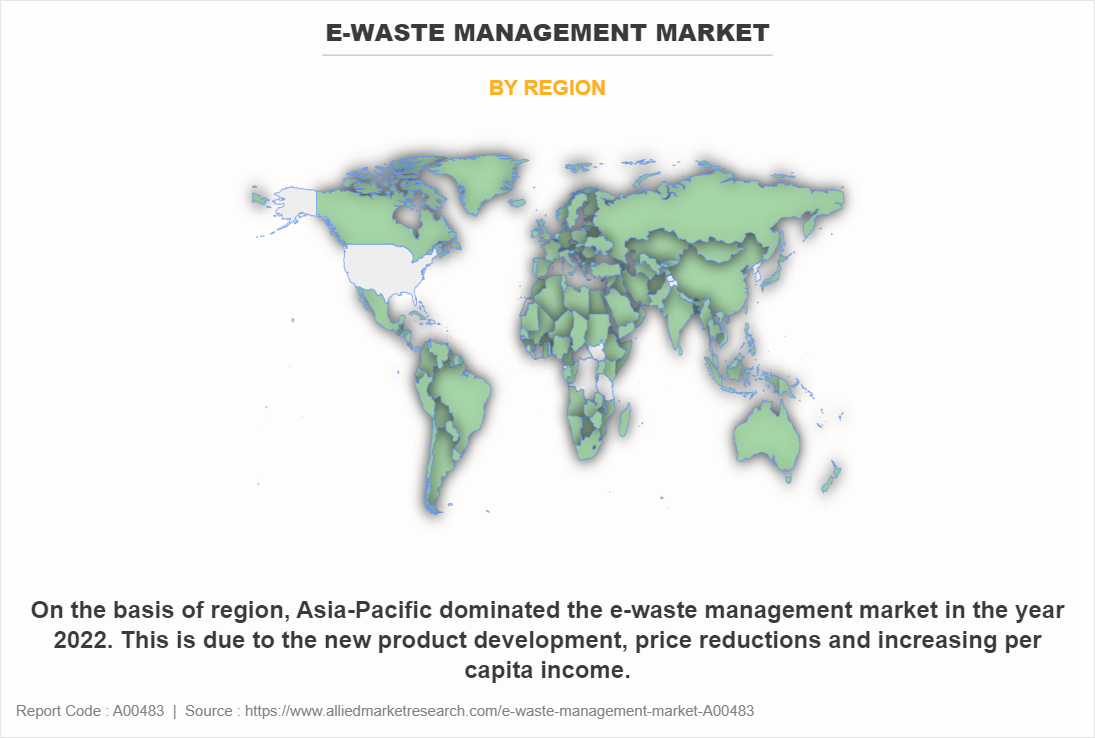
Asia-Pacific dominates the e-waste management market, owing to various factors such as new product developments due to continuous innovations and constant decline in prices of electronic products. This has considerably affected actual life span of electronic products such as computers and mobiles. In addition, increase in per capita income across many countries of this region has led to frequent switching to upgraded versions of the products. These factors are collectively responsible for increase in sales of electronic devices such as mobiles phones, refrigerators, and computers in the last decade, which ultimately increase e-waste in the region.
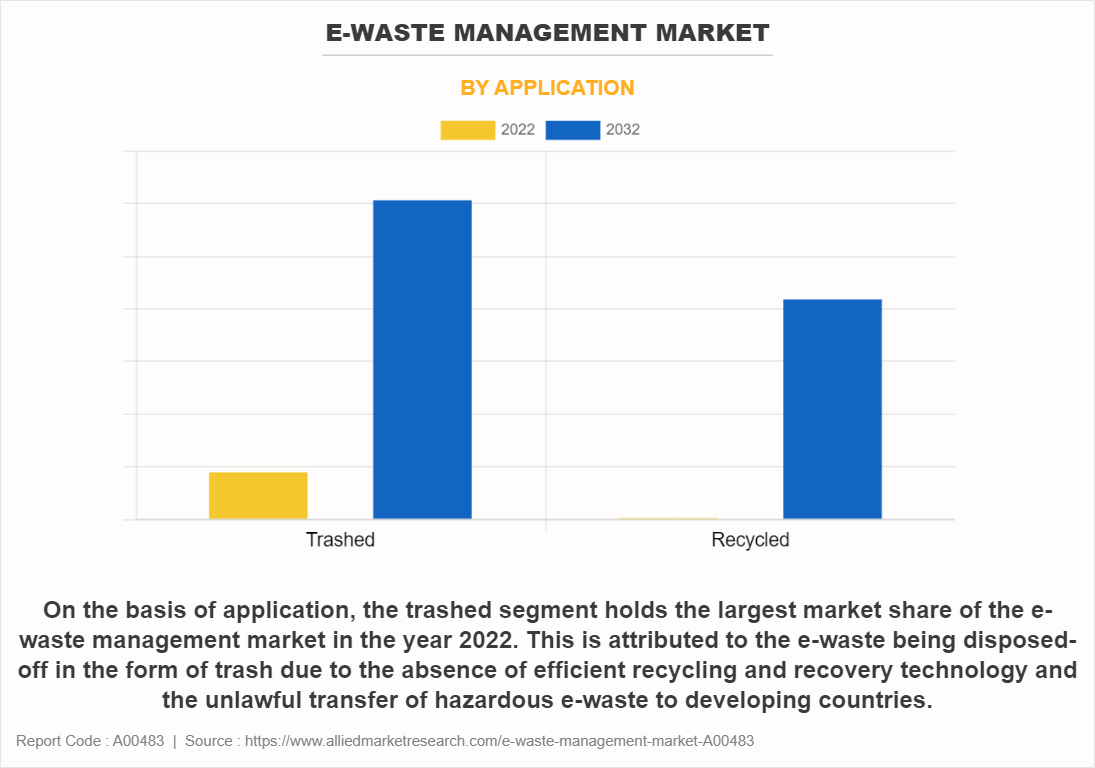
Rise in sales of electronic and electrical devices as well as hesitance to repair defective devices increase the volume of e-waste each year. Users often refrain from repair of defective or obsolete products, as in some cases, the repair cost exceeds price of a brand new device. This results in rapid increase of e-waste each year. In addition, dumping of e-waste from developed regions to developing countries such as India, China, and Pakistan, is creating numerous opportunities for effective management of e-waste.
The report focuses on growth prospects, restraints, and e-waste management market analysis. The study provides Porter’s five forces analysis of the e-waste management to understand impact of various factors such as bargaining power of suppliers, competitive intensity of competitors, threat of new entrants, threat of substitutes, and bargaining power of buyers on the media & entertainment storage market trends.
The e-waste management market is segmented on the basis of processed material type, source type, application, and region. By processed material type, it is categorized into metal, plastic, glass, and others. By source type, it is classified into household appliances, industrial electronics, and consumer electronics. Depending on household appliance, the market is divided into refrigerator, washing machines, television, air conditioners, and others. By industrial electronics, it is bifurcated into IT & telecom equipment and medical equipment. Region wise, it is analyzed across North America, Europe, Asia-Pacific, and LAMEA.
Post COVID-19, size of the e-waste management market is estimated to grow from 49,880 million in 2020 and projected to reach $143,870 million by 2028, at a CAGR of 14.3%. The current estimation of 2028 is projected to be higher than pre-COVID-19 estimates. In terms of economic impact, the market has experienced a positive growth trend, adoption of work from home policies has led to increased demand for mobile computing devices, which has reduced the usage of stationary desktop and devices, thus in order to reduce the operational cost, enterprises have been focusing on recycling these systems, creating an immense opportunity for the overall market growth.
With this growing opportunity, various companies have been actively investing in e-waste management. For instance, in January 2021, Petonic Infotech announced half a million-dollar investment in Prometheus e-waste Recycling. With this investment, Petonic Infotech aims to help Prometheus e-waste promote sustainable e-waste management across India. Furthermore, the funding will help Prometheus e-Waste bring a safe, hassle-free, and results-driven solution to tackle India's e-waste problem.
Driving forces that have direct implication on e-waste industry include decrease in life span of electronic devices that drive the growth of the e-waste management market, scarcity of precious metals that make recycling of e-waste essential, and high rate of obsolescence that adds e-waste in tremendous volume. However, high cost of recycling restricts e-waste management and less number of sufficient waste collection zones are some of the factors that could hinder market growth in the coming years. Furthermore, rise in initiatives by electronic manufacturers across the globe is an opportunistic factor for the growth of the global market.
Rapid technology advancement and frequent innovations in the product lead to surge in the sale of electronic products. Especially mobile devices, televisions, and computer devices are experiencing fast growth across the world. There is a continuous increase in the sale of these electronics with increase in purchasing power and rise in trend of disposable income. In addition, new product launches with updated features and additional services attract the customers to upgrade their old products with new products. This has reduced the life span of these devices to about 3-4 years. Thus, this is adding more and more e-waste at a tremendous rate, thereby encouraging industry players to expand their business and enable them build wide network for e-waste collection and setup more processing facilities. The ongoing sale of electronic products, especially in emerging countries would provide lucrative environment for e-waste management in the coming years. Moreover, rapid technology advancements and constant innovations in the product are enabling the electronic industry players to launch new products every day, which results in decreasing life of all white goods. In addition, with the increase in disposable income, the customers are able to afford the premium priced electronic devices, which in turn drives the demand for these devices.
Ever increasing demand and scarcity of rare metals has been leading to rapid rise in the prices of these metals. Such metals need to be recovered from e-waste for reuse in another production. For example, in one million waste of mobile phones, there is near about 250 kg of silver, 24 kg of gold, and nine tons of copper that can be recovered. This would also benefit the manufacturers to produce the electronic devices with lower cost and gain cost advantages over competitors.
E-waste contains special and precious metals including silver, gold, palladium, platinum, indium, and gallium. These scarce elements are widely used in the production of consumer electronics and IT & communication devices. Due to scarcity of these metals, the prices associated with their products is also high. This has increased the need to reuse, refurbish, and recycle the devices made from metals. Thus, these issues would certainly force the manufacturers of electronic devices to look for raw materials available from recycled e-waste. This would also benefit the nations to reduce greenhouse gas emissions and certainly help to reduce the danger of global warming. The nature of electronic devices is such that they get obsolete or need repair from time to time. This is a major cause for the generation of e-waste. The cost of replacing an electronic device is lesser than those getting repaired. Therefore, it has been observed that there is a growing tendency to purchase a new product rather than repairing those. This increased obsolescence rate is leading to huge generation of e-waste currently. This leads to reuse, refurbishment, and recycle of waste generated. This creates the need to setup wide network of collection zones. In emerging countries, with strict regulatory frameworks and initiatives of electronic product manufacturers, there would be more opportunities for management of obsolete products.
Key Benefits For Stakeholders
E-Waste Management Market Report Highlights
Aspects | Details |
---|---|
By Material |
|
By Source Type |
|
By Application |
|
By Region |
|
Key Market Players | ENIRO-HUB HOLDINGS LTD., UMICORE AG & CO. KG, MRI E-CYCLE SOLUTIONS, SEMBCORP ENVIRONMENTAL MANAGEMENT, WM INTELLECTUAL PROPERTY HOLDINGS, L.L.C., VEOLIA, ERI, CAPITAL ENVIRONMENT HOLDINGS LIMITED, TES, TETRONICS TECHNOLOGIES LIMITED |
CHAPTER 1:INTRODUCTION
1.1.REPORT DESCRIPTION
1.1.1.Key benefits for stakeholders
1.1.2.Key market segments
1.2.RESEARCH METHODOLOGY
1.2.1.Secondary research
1.2.2.Primary research
1.2.3.Analyst tools & models
CHAPTER 2:EXECUTIVE SUMMARY
2.1.KEY FINDINGS
2.1.1.Top impacting factors
2.1.2.Top investment pockets
2.2.CXO PERSPECTIVE
CHAPTER 3:MARKET OVERVIEW
3.1.MARKET DEFINITION AND SCOPE
3.2.KEY FORCES SHAPING THE GLOBAL E-WASTE MANAGEMENT MARKET
3.2.1.Low-to- Moderate bargaining power of suppliers
3.2.2.Moderate-to-high bargaining power of buyer
3.2.3.Low-to-Moderate threat of substitutes
3.2.4.Moderate-to-high threat of new entrants
3.2.5.Low-to-Moderate competitive rivalry
3.3.VALUE CHAIN ANALYSIS
3.4.MARKET DYNAMICS
3.4.1.Drivers
3.4.1.1.Reduction in life span of electronic devices
3.4.1.2.Scarcity of sources of precious metals
3.4.2.Restraint
3.4.2.1.Increase in recycling cost incurred due to inadequacy of infrastructure
3.4.3.Opportunity
3.4.3.1.E-waste initiatives by electronic manufacturers across the globe
3.5.INDUSTRY ROADMAP OF E-WASTE MANAGEMENT
3.6.IMPACT OF GOVERNMENT REGULATIONS ON THE GLOBAL E-WASTE MANAGEMENT MARKET
3.6.1.Home appliance recycling law
3.7.IMPACT OF COVID
3.7.1.Impact on Market Size
3.7.2.Consumer Trends, Preference and Budget Impact
3.7.3.Regulatory Framework
3.7.4.Economic Impact
3.7.5.Key Player strategies to tackle negative impact
3.7.6.Opportunity Window
3.7.7.Electronics Recycling Associations
CHAPTER 4:E-WASTE MANAGEMENT MARKET, BY PROCESSED MATERIAL TYPE
4.1.OVERVIEW
4.2.METAL
4.2.1.Key market trends, growth factors, and opportunities
4.2.2.Market size and forecast, by region
4.2.3.Market analysis, by country
4.3.PLASTIC
4.3.1.Key market trends, growth factors, and opportunities
4.3.2.Market size and forecast, by region
4.3.3.Market analysis, by country
4.4.GLASS
4.4.1.Key market trends, growth factors, and opportunities
4.4.2.Market size and forecast, by region
4.4.3.Market analysis, by country
4.5.OTHER
4.5.1.Key market trends, growth factors, and opportunities
4.5.2.Market size and forecast, by region
4.5.3.Market analysis, by country
CHAPTER 5:E-WASTE MANAGEMENT MARKET, BY SOURCE TYPE
5.1.OVERVIEW
5.2.HOUSEHOLD APPLIANCES
5.2.1.Key market trends, growth factors, and opportunities
5.2.2.Market size and forecast, by region
5.2.3.Market analysis, by country
5.2.4.E-waste management market for household appliances, by source type
5.3.INDUSTRIAL ELECTRONICS
5.3.1.Key market trends, growth factors, and opportunities
5.3.2.Market size and forecast, by region
5.3.3.Market analysis, by country
5.3.4.E-waste management market for industrial electronics, by source type
5.4.CONSUMER ELECTRONICS
5.4.1.Key market trends, growth factors, and opportunities
5.4.2.Market size and forecast, by region
5.4.3.Market analysis, by country
5.4.4.E-waste management market for consumer electronics, by source type
CHAPTER 6:E-WASTE MANAGEMENT MARKET, BY APPLICATION
6.1.OVERVIEW
6.2.TRASHED
6.2.1.Key market trends, growth factors, and opportunities
6.3.RECYCLED
6.3.1.Key market trends, growth factors, and opportunities
CHAPTER 7:E-WASTE MANAGEMENT MARKET, BY REGION
7.1.OVERVIEW
7.1.1.Market size and forecast, by region
7.2.NORTH AMERICA
7.2.1.Key market trends, growth factors, and opportunities
7.2.2.Market size and forecast, by processed material type
7.2.3.Market size and forecast, by source type
7.2.4.Market analysis, by country
7.2.4.1.U.S.
7.2.4.1.1.Market size and forecast, by processed material type
7.2.4.1.2.Market size and forecast, by source type
7.2.4.2.Canada
7.2.4.2.1.Market size and forecast, by processed material type
7.2.4.2.2.Market size and forecast, by source type
7.3.EUROPE
7.3.1.Key market trends, growth factors, and opportunities
7.3.2.Market size and forecast, by processed material type
7.3.3.Market size and forecast, by source type
7.3.4.Market analysis, by country
7.3.4.1.Germany
7.3.4.1.1.Market size and forecast, by processed material type
7.3.4.1.2.Market size and forecast, by source type
7.3.4.2.France
7.3.4.2.1.Market size and forecast, by processed material type
7.3.4.2.2.Market size and forecast, by source type
7.3.4.3.UK
7.3.4.3.1.Market size and forecast, by processed material type
7.3.4.3.2.Market size and forecast, by source type
7.3.4.4.Russia
7.3.4.4.1.Market size and forecast, by processed material type
7.3.4.4.2.Market size and forecast, by source type
7.3.4.5.Italy
7.3.4.5.1.Market size and forecast, by processed material type
7.3.4.5.2.Market size and forecast, by source type
7.3.4.6.Rest of Europe
7.3.4.6.1.Market size and forecast, by processed material type
7.3.4.6.2.Market size and forecast, by source type
7.4.ASIA-PACIFIC
7.4.1.Key market trends, growth factors, and opportunities
7.4.2.Market size and forecast, by processed material type
7.4.3.Market size and forecast, by source type
7.4.4.Market analysis, by country
7.4.4.1.Japan
7.4.4.1.1.Market size and forecast, by processed material type
7.4.4.1.2.Market size and forecast, by source type
7.4.4.2.China
7.4.4.2.1.Market size and forecast, by processed material type
7.4.4.2.2.Market size and forecast, by source type
7.4.4.3.India
7.4.4.3.1.Market size and forecast, by processed material type
7.4.4.3.2.Market size and forecast, by source type
7.4.4.4.South Korea
7.4.4.4.1.Market size and forecast, by processed material type
7.4.4.4.2.Market size and forecast, by source type
7.4.4.5.Australia
7.4.4.5.1.Market size and forecast, by processed material type
7.4.4.5.2.Market size and forecast, by source type
7.4.4.6.Rest of Asia-Pacific
7.4.4.6.1.Market size and forecast, by processed material type
7.4.4.6.2.Market size and forecast, by source type
7.5.LAMEA
7.5.1.Key market trends, growth factors, and opportunities
7.5.2.Market size and forecast, by processed material type
7.5.3.Market size and forecast, by source type
7.5.4.Market analysis, by country
7.5.4.1.Latin America
7.5.4.1.1.Market size and forecast, by processed material type
7.5.4.1.2.Market size and forecast, by source type
7.5.4.2.Middle East
7.5.4.2.1.Market size and forecast, by processed material type
7.5.4.2.2.Market size and forecast, by source type
7.5.4.3.Africa
7.5.4.3.1.Market size and forecast, by processed material type
7.5.4.3.2.Market size and forecast, by source type
CHAPTER 8:COMPETITIVE LANDSCAPE
8.1.KEY PLAYERS POSITIONING ANALYSIS, 2019
8.2.TOP WINNING STRATEGIES
8.3.KEY DEVELOPMENTS
8.3.1.Partnership
8.3.2.Acquisition
8.3.3.Collaboration
CHAPTER 9:COMPANY PROFILES
9.1.CAPITAL ENVIRONMENT HOLDINGS LIMITED
9.1.1.Company overview
9.1.2.Key executives
9.1.3.Company snapshot
9.1.4.Operating business segments
9.1.5.Product portfolio
9.1.6.Business performance
9.1.7.Key strategic moves and developments
9.2.ERI
9.2.1.Company overview
9.2.2.Key executives
9.2.3.Company snapshot
9.2.4.Product portfolio
9.2.5.Key strategic moves and developments
9.3.ENIRO-HUB HOLDINGS LTD.
9.3.1.Company overview
9.3.2.Key executives
9.3.3.Company snapshot
9.3.4.Operating business segments
9.3.5.Product portfolio
9.3.6.Business performance
9.4.MRI E-CYCLE SOLUTIONS
9.4.1.Company overview
9.4.2.Key executives
9.4.3.Company snapshot
9.4.4.Product portfolio
9.4.5.Key strategic moves and developments
9.5.SEMBCORP ENVIRONMENTAL MANAGEMENT
9.5.1.Company overview
9.5.2.Key executives
9.5.3.Company snapshot
9.5.4.Operating business segments
9.5.5.Product portfolio
9.5.6.Business performance
9.5.7.Key strategic moves and developments
9.6.TES
9.6.1.Company overview
9.6.2.Key Executives
9.6.3.Company snapshot
9.6.4.Product portfolio
9.6.5.Key strategic moves and developments
9.7.TETRONICS TECHNOLOGIES LIMITED
9.7.1.Company overview
9.7.2.Key executives
9.7.3.Company snapshot
9.7.4.Product portfolio
9.8.UMICORE AG & CO. KG
9.8.1.Company overview
9.8.2.Key executives
9.8.3.Company snapshot
9.8.4.Operating business segments
9.8.5.Product portfolio
9.8.6.Business performance
9.8.7.Key strategic moves and developments
9.9.VEOLIA
9.9.1.Company overview
9.9.2.Key executives
9.9.3.Company snapshot
9.9.4.Operating business segments
9.9.5.Product portfolio
9.9.6.R&D expenditure
9.9.7.Business performance
9.9.8.Key strategic moves and developments
9.10.WM INTELLECTUAL PROPERTY HOLDINGS, L.L.C.
9.10.1.Company overview
9.10.2.Key executives
9.10.3.Company snapshot
9.10.4.Operating business segments
9.10.5.Product portfolio
9.10.6.Business performance
9.10.7.Key strategic moves and developments
List of tables
TABLE 01.GLOBAL E-WASTE MANAGEMENT MARKET REVENUE, BY PROCESSED MATERIAL TYPE,
2020-2028 ($BILLION)
TABLE 02.GLOBAL E-WASTE MANAGEMENT MARKET VOLUME, BY PROCESSED MATERIAL TYPE,
2020-2028 (MILLION TONS)
TABLE 03.E-WASTE MANAGEMENT MARKET REVENUE FOR METAL, BY REGION, 2020-2028 ($BILLION)
TABLE 04.E-WASTE MANAGEMENT MARKET REVENUE FOR PLASTIC, BY REGION, 2020-2028 ($BILLION)
TABLE 05.E-WASTE MANAGEMENT MARKET REVENUE FOR GLASS, BY REGION, 2020-2028 ($BILLION)
TABLE 06.E-WASTE MANAGEMENT MARKET REVENUE FOR OTHER, BY REGION, 2020-2028 ($BILLION)
TABLE 07.GLOBAL E-WASTE MANAGEMENT MARKET REVENUE, BY SOURCE TYPE, 2020-2028 ($BILLION)
TABLE 08.GLOBAL E-WASTE MANAGEMENT MARKET VOLUME, BY SOURCE TYPE, 2020-2028 (MILLION TONS)
TABLE 09.E-WASTE MANAGEMENT MARKET REVENUE FOR HOUSEHOLD APPLIANCES, BY REGION,
2020-2028 ($BILLION)
TABLE 10.E-WASTE MANAGEMENT MARKET REVENUE FOR HOUSEHOLD APPLIANCES, BY SOURCE TYPE,
2020-2028 ($BILLION)
TABLE 11.E-WASTE MANAGEMENT MARKET REVENUE FOR INDUSTRIAL ELECTRONICS, BY REGION,
2020-2028 ($BILLION)
TABLE 12.E-WASTE MANAGEMENT MARKET REVENUE FOR INDUSTRIAL ELECTRONICS, BY SOURCE TYPE,
2020-2028 ($BILLION)
TABLE 13.E-WASTE MANAGEMENT MARKET REVENUE FOR CONSUMER ELECTRONICS, BY REGION,
2020-2028 ($BILLION)
TABLE 14.E-WASTE MANAGEMENT MARKET REVENUE FOR CONSUMER ELECTRONICS, BY SOURCE TYPE,
2020-2028 ($BILLION)
TABLE 15.GLOBAL E-WASTE MANAGEMENT MARKET VOLUME, BY APPLICATION, 2020-2028 (MILLION TONS)
TABLE 16.E-WASTE MANAGEMENT MARKET REVENUE, BY REGION, 2020-2028 ($BILLION)
TABLE 17.E-WASTE MANAGEMENT MARKET VOLUME, BY REGION, 2020-2028 (MILLION TONS)
TABLE 18.NORTH AMERICA E-WASTE MANAGEMENT MARKET REVENUE, BY PROCESSED MATERIAL TYPE,
2020-2028 ($BILLION)
TABLE 19.NORTH AMERICA E-WASTE MANAGEMENT MARKET REVENUE, BY SOURCE TYPE 2020-2028 ($BILLION)
TABLE 20.NORTH AMERICA E-WASTE MANAGEMENT MARKET REVENUE, BY COUNTRY, 2020-2028 ($BILLION)
TABLE 21.U.S. E-WASTE MANAGEMENT MARKET REVENUE, BY PROCESSED MATERIAL TYPE
2020-2028 ($BILLION)
TABLE 22.U.S. E-WASTE MANAGEMENT MARKET REVENUE, BY SOURCE TYPE 2020-2028 ($BILLION)
TABLE 23.CANADA E-WASTE MANAGEMENT MARKET REVENUE, BY PROCESSED MATERIAL TYPE
2020-2028 ($BILLION)
TABLE 24.CANADA E-WASTE MANAGEMENT MARKET REVENUE, BY SOURCE TYPE 2020-2028 ($BILLION)
TABLE 25.EUROPE E-WASTE MANAGEMENT MARKET REVENUE, BY PROCESSED MATERIAL TYPE
2020-2028 ($BILLION)
TABLE 26.EUROPE E-WASTE MANAGEMENT MARKET REVENUE, BY SOURCE TYPE 2020-2028 ($BILLION)
TABLE 27.EUROPE E-WASTE MANAGEMENT MARKET REVENUE, BY COUNTRY, 2020-2028 ($BILLION)
TABLE 28.GERMANY E-WASTE MANAGEMENT MARKET REVENUE, BY PROCESSED MATERIAL TYPE
2020-2028 ($BILLION)
TABLE 29.GERMANY E-WASTE MANAGEMENT MARKET REVENUE, BY SOURCE TYPE 2020-2028 ($BILLION)
TABLE 30.FRANCE E-WASTE MANAGEMENT MARKET REVENUE, BY PROCESSED MATERIAL TYPE
2020-2028 ($BILLION)
TABLE 31.FRANCE E-WASTE MANAGEMENT MARKET REVENUE, BY SOURCE TYPE 2020-2028 ($BILLION)
TABLE 32.UK E-WASTE MANAGEMENT MARKET REVENUE, BY PROCESSED MATERIAL TYPE
2020-2028 ($BILLION)
TABLE 33.UK E-WASTE MANAGEMENT MARKET REVENUE, BY SOURCE TYPE 2020-2028 ($BILLION)
TABLE 34.RUSSIA E-WASTE MANAGEMENT MARKET REVENUE, BY PROCESSED MATERIAL TYPE
2020-2028 ($BILLION)
TABLE 35.RUSSIA E-WASTE MANAGEMENT MARKET REVENUE, BY SOURCE TYPE 2020-2028 ($BILLION)
TABLE 36.ITALY E-WASTE MANAGEMENT MARKET REVENUE, BY PROCESSED MATERIAL TYPE
2020-2028 ($BILLION)
TABLE 37.ITALY E-WASTE MANAGEMENT MARKET REVENUE, BY SOURCE TYPE 2020-2028 ($BILLION)
TABLE 38.REST OF EUROPE E-WASTE MANAGEMENT MARKET REVENUE, BY PROCESSED MATERIAL TYPE
2020-2028 ($BILLION)
TABLE 39.REST OF EUROPE E-WASTE MANAGEMENT MARKET REVENUE, BY SOURCE TYPE 2020-2028 ($BILLION)
TABLE 40.ASIA-PACIFIC E-WASTE MANAGEMENT MARKET REVENUE, BY PROCESSED MATERIAL TYPE
2020-2028 ($BILLION)
TABLE 41.ASIA-PACIFIC E-WASTE MANAGEMENT MARKET REVENUE, BY SOURCE TYPE 2020-2028 ($BILLION)
TABLE 42.ASIA-PACIFIC E-WASTE MANAGEMENT MARKET REVENUE, BY COUNTRY, 2020-2028 ($BILLION)
TABLE 43.JAPAN E-WASTE MANAGEMENT MARKET REVENUE, BY PROCESSED MATERIAL TYPE
2020-2028 ($BILLION)
TABLE 44.JAPAN E-WASTE MANAGEMENT MARKET REVENUE, BY SOURCE TYPE 2020-2028 ($BILLION)
TABLE 45.CHINA E-WASTE MANAGEMENT MARKET REVENUE, BY PROCESSED MATERIAL TYPE
2020-2028 ($BILLION)
TABLE 46.CHINA E-WASTE MANAGEMENT MARKET REVENUE, BY SOURCE TYPE 2020-2028 ($BILLION)
TABLE 47.INDIA E-WASTE MANAGEMENT MARKET REVENUE, BY PROCESSED MATERIAL TYPE
2020-2028 ($BILLION)
TABLE 48.INDIA E-WASTE MANAGEMENT MARKET REVENUE, BY SOURCE TYPE 2020-2028 ($BILLION)
TABLE 49.SOUTH KOREA E-WASTE MANAGEMENT MARKET REVENUE, BY PROCESSED MATERIAL TYPE
2020-2028 ($BILLION)
TABLE 50.SOUTH KOREA E-WASTE MANAGEMENT MARKET REVENUE, BY SOURCE TYPE 2020-2028 ($BILLION)
TABLE 51.AUSTRALIA E-WASTE MANAGEMENT MARKET REVENUE, BY PROCESSED MATERIAL TYPE
2020-2028 ($BILLION)
TABLE 52.AUSTRALIA E-WASTE MANAGEMENT MARKET REVENUE, BY SOURCE TYPE 2020-2028 ($BILLION)
TABLE 53.REST OF ASIA-PACIFIC E-WASTE MANAGEMENT MARKET REVENUE, BY PROCESSED MATERIAL TYPE
2020-2028 ($BILLION)
TABLE 54.REST OF ASIA-PACIFIC E-WASTE MANAGEMENT MARKET REVENUE, BY SOURCE TYPE
2020-2028 ($BILLION)
TABLE 55.LAMEA E-WASTE MANAGEMENT MARKET REVENUE, BY PROCESSED MATERIAL TYPE
2020-2028 ($BILLION)
TABLE 56.LAMEA E-WASTE MANAGEMENT MARKET REVENUE, BY SOURCE TYPE 2020-2028 ($BILLION)
TABLE 57.LAMEA E-WASTE MANAGEMENT MARKET REVENUE, BY COUNTRY, 2020-2028 ($BILLION)
TABLE 58.LATIN AMERICA E-WASTE MANAGEMENT MARKET REVENUE, BY PROCESSED MATERIAL TYPE
2020-2028 ($BILLION)
TABLE 59.LATIN AMERICA E-WASTE MANAGEMENT MARKET REVENUE, BY SOURCE TYPE 2020-2028 ($BILLION)
TABLE 60.MIDDLE EAST E-WASTE MANAGEMENT MARKET REVENUE, BY PROCESSED MATERIAL TYPE
2020-2028 ($BILLION)
TABLE 61.MIDDLE EAST E-WASTE MANAGEMENT MARKET REVENUE, BY SOURCE TYPE 2020-2028 ($BILLION)
TABLE 62.AFRICA E-WASTE MANAGEMENT MARKET REVENUE, BY PROCESSED MATERIAL TYPE
2020-2028 ($BILLION)
TABLE 63.AFRICA E-WASTE MANAGEMENT MARKET REVENUE, BY SOURCE TYPE 2020-2028 ($BILLION)
TABLE 64.PARTNERSHIP (2018-2020)
TABLE 65.KEY ACQUISITION (2018-2020)
TABLE 66.KEY COLLABORATION (2018-2020)
TABLE 67.CAPITAL ENVIRONMENT HOLDINGS LIMITED: KEY EXECUTIVES
TABLE 68.CAPITAL ENVIRONMENT HOLDINGS LIMITED: COMPANY SNAPSHOT
TABLE 69.CAPITAL ENVIRONMENT HOLDINGS LIMITED: OPERATING SEGMENTS
TABLE 70.CAPITAL ENVIRONMENT HOLDINGS LIMITED: PRODUCT PORTFOLIO
TABLE 71.ERI: KEY EXECUTIVES
TABLE 72.ERI: COMPANY SNAPSHOT
TABLE 73.ERI: PRODUCT PORTFOLIO
TABLE 76.ENIRO-HUB HOLDINGS LTD.: OPERATING SEGMENTS
TABLE 78.MRI E-CYCLE SOLUTIONS: KEY EXECUTIVES
TABLE 79.MRI E-CYCLE SOLUTIONS: COMPANY SNAPSHOT
TABLE 80.MRI E-CYCLE SOLUTIONS: PRODUCT PORTFOLIO
TABLE 81.SEMBCORP INDUSTRIES: KEY EXECUTIVES
TABLE 82.SEMBCORP INDUSTRIES: COMPANY SNAPSHOT
TABLE 83.SEMBCORP INDUSTRIES: OPERATING SEGMENTS
TABLE 84.SEMBCORP INDUSTRIES: PRODUCT PORTFOLIO
TABLE 85.TES: KEY EXECUTIVES
TABLE 86.TES: COMPANY SNAPSHOT
TABLE 87.TES: PRODUCT PORTFOLIO
TABLE 88.TETRONICS TECHNOLOGIES LIMITED: KEY EXECUTIVES
TABLE 89.TETRONICS TECHNOLOGIES LIMITED: COMPANY SNAPSHOT
TABLE 90.TETRONICS TECHNOLOGIES LIMITED: PRODUCT PORTFOLIO
TABLE 91.UMICORE AG & CO. KG: KEY EXECUTIVES
TABLE 92.UMICORE AG & CO. KG: COMPANY SNAPSHOT
TABLE 93.UMICORE AG & CO. KG: OPERATING SEGMENTS
TABLE 94.UMICORE AG & CO. KG: PRODUCT PORTFOLIO
TABLE 95.VEOLIA: KEY EXECUTIVES
TABLE 96.VEOLIA: COMPANY SNAPSHOT
TABLE 97.VEOLIA: OPERATING SEGMENTS
TABLE 98.VEOLIA: PRODUCT PORTFOLIO
TABLE 99.WM INTELLECTUAL PROPERTY HOLDINGS, L.L.C.: KEY EXECUTIVES
TABLE 100.WM INTELLECTUAL PROPERTY HOLDINGS, L.L.C.: COMPANY SNAPSHOT
TABLE 101.WM INTELLECTUAL PROPERTY HOLDINGS, L.L.C.: OPERATING SEGMENTS
TABLE 102.WM INTELLECTUAL PROPERTY HOLDINGS, L.L.C.: PRODUCT PORTFOLIO
TABLE 103.WM INTELLECTUAL PROPERTY HOLDINGS, L.L.C.: KEY STRATEGIC MOVES AND DEVELOPMENTS
LIST OF FIGURES
FIGURE 01.KEY MARKET SEGMENTS
FIGURE 02.GLOBAL E-WASTE MANAGEMENT MARKET REVENUE, 2020-2028
FIGURE 03.GLOBAL E-WASTE MANAGEMENT MARKET VOLUME, 2020-2028
FIGURE 04.E-WASTE MANAGEMENT MARKET REVENUE, BY REGION, 2020-2028
FIGURE 05.TOP IMPACTING FACTORS
FIGURE 06.TOP INVESTMENT POCKETS
FIGURE 07.TOP PLAYERS OF THE GLOBAL E-WASTE MANAGEMENT MARKET
FIGURE 08.LOW-TO-MODERATE BARGAINING POWER OF SUPPLIERS
FIGURE 09.MODERATE-TO-HIGH BARGAINING POWER OF BUYER
FIGURE 10.LOW-TO-MODERATE THREAT OF SUBSTITUTES
FIGURE 11.MODERATE-TO-HIGH THREAT OF NEW ENTRANTS
FIGURE 12.LOW-TO-MODERATE COMPETITIVE RIVALRY
FIGURE 13.VALUE CHAIN ANALYSIS OF E-WASTE MANAGEMENT MARKET
FIGURE 14.MARKET DYNAMICS: GLOBAL E-WASTE MANAGEMENT MARKET
FIGURE 15.INDUSTRY ROADMAP OF E-WASTE MANAGEMENT MARKET
FIGURE 16.GLOBAL E-WASTE MANAGEMENT MARKET REVENUE, BY PROCESSED MATERIAL TYPE,
2020-2028 ($BILLION)
FIGURE 17.GLOBAL E-WASTE MANAGEMENT MARKET VOLUME, BY PROCESSED MATERIAL TYPE,
2020-2028 (MILLION TONS)
FIGURE 18.COMPARATIVE SHARE ANALYSIS OF GLOBAL E-WASTE MANAGEMENT MARKET FOR METAL,
BY COUNTRY, 2019 & 2027 (%)
FIGURE 19.COMPARATIVE SHARE ANALYSIS OF GLOBAL E-WASTE MANAGEMENT MARKET FOR PLASTIC,
BY COUNTRY, 2019 & 2027 (%)
FIGURE 20.COMPARATIVE SHARE ANALYSIS OF GLOBAL E-WASTE MANAGEMENT MARKET FOR GLASS,
BY COUNTRY, 2019 & 2027 (%)
FIGURE 21.COMPARATIVE SHARE ANALYSIS OF GLOBAL E-WASTE MANAGEMENT MARKET FOR OTHER,
BY COUNTRY, 2019 & 2027 (%)
FIGURE 22.GLOBAL E-WASTE MANAGEMENT MARKET REVENUE, BY SOURCE TYPE, 2020-2028 ($BILLION)
FIGURE 23.GLOBAL E-WASTE MANAGEMENT MARKET VOLUME, BY SOURCE TYPE, 2020-2028 (MILLION TONS)
FIGURE 24.COMPARATIVE SHARE ANALYSIS OF GLOBAL E-WASTE MANAGEMENT MARKET FOR HOUSEHOLD APPLIANCES, BY COUNTRY, 2019 & 2027 (%)
FIGURE 25.COMPARATIVE SHARE ANALYSIS OF GLOBAL E-WASTE MANAGEMENT MARKET FOR INDUSTRIAL ELECTRONICS, BY COUNTRY, 2019 & 2027 (%)
FIGURE 26.COMPARATIVE SHARE ANALYSIS OF GLOBAL E-WASTE MANAGEMENT MARKET CONSUMER
ELECTRONICS, BY COUNTRY, 2019 & 2027 (%)
FIGURE 27.GLOBAL E-WASTE MANAGEMENT MARKET VOLUME, BY APPLICATION, 2020-2028 (MILLION TONS)
FIGURE 28.U.S. E-WASTE MANAGEMENT MARKET REVENUE, 2020-2028 ($BILLION)
FIGURE 29.CANADA E-WASTE MANAGEMENT MARKET REVENUE, 2020-2028 ($BILLION)
FIGURE 30.GERMANY E-WASTE MANAGEMENT MARKET REVENUE, 2020-2028 ($BILLION)
FIGURE 31.FRANCE E-WASTE MANAGEMENT MARKET REVENUE, 2020-2028 ($BILLION)
FIGURE 32.UK E-WASTE MANAGEMENT MARKET REVENUE, 2020-2028 ($BILLION)
FIGURE 33.RUSSIA E-WASTE MANAGEMENT MARKET REVENUE, 2020-2028 ($BILLION)
FIGURE 34.ITALY E-WASTE MANAGEMENT MARKET REVENUE, 2020-2028 ($BILLION)
FIGURE 35.REST OF EUROPE E-WASTE MANAGEMENT MARKET REVENUE, 2020-2028 ($BILLION)
FIGURE 36.JAPAN E-WASTE MANAGEMENT MARKET REVENUE, 2020-2028 ($BILLION)
FIGURE 37.CHINA E-WASTE MANAGEMENT MARKET REVENUE, 2020-2028 ($BILLION)
FIGURE 38.INDIA E-WASTE MANAGEMENT MARKET REVENUE, 2020-2028 ($BILLION)
FIGURE 39.SOUTH KOREA E-WASTE MANAGEMENT MARKET REVENUE, 2020-2028 ($BILLION)
FIGURE 40.AUSTRALIA E-WASTE MANAGEMENT MARKET REVENUE, 2020-2028 ($BILLION)
FIGURE 41.REST OF ASIA-PACIFIC E-WASTE MANAGEMENT MARKET REVENUE, 2020-2028 ($BILLION)
FIGURE 42.LATIN AMERICA E-WASTE MANAGEMENT MARKET REVENUE, 2020-2028 ($BILLION)
FIGURE 43.MIDDLE EAST E-WASTE MANAGEMENT MARKET REVENUE, 2020-2028 ($BILLION)
FIGURE 44.AFRICA E-WASTE MANAGEMENT MARKET REVENUE, 2020-2028 ($BILLION)
FIGURE 45.KEY PLAYER POSITIONING ANLYSIS: GLOBAL E-WASTE MANAGEMENT MARKET
FIGURE 46.TOP WINNING STRATEGIES, BY YEAR, 2018-2021
FIGURE 47.TOP WINNING STRATEGIES, BY DEVELOPMENT, 2017-2019
FIGURE 48.TOP WINNING STRATEGIES, BY COMPANY, 2017-2019
FIGURE 49.COMPETITIVE HEATMAP OF KEY PLAYERS
FIGURE 50.CAPITAL ENVIRONMENT HOLDINGS LIMITED: REVENUE, 2017-2019 ($MILLION)
FIGURE 51.CAPITAL ENVIRONMENT HOLDINGS LIMITED: REVENUE SHARE BY SEGMENT, 2019 (%)
FIGURE 52.CAPITAL ENVIRONMENT HOLDINGS LIMITED: REVENUE SHARE BY REGION, 2019 (%)
FIGURE 56.SEMBCORP INDUSTRIES: REVENUE, 2018–2020 ($MILLION)
FIGURE 57.SEMBCORP INDUSTRIES: REVENUE SHARE BY SEGMENT, 2020 (%)
FIGURE 58.SEMBCORP INDUSTRIES: REVENUE SHARE BY REGION, 2020 (%)
FIGURE 59.UMICORE AG & CO. KG: REVENUE, 2018–2020 ($MILLION)
FIGURE 60.UMICORE AG & CO. KG: REVENUE SHARE BY SEGMENT, 2020 (%)
FIGURE 61.UMICORE AG & CO. KG: REVENUE SHARE BY REGION, 2020 (%)
FIGURE 62.R&D EXPENDITURE, 2018–2020 ($MILLION)
FIGURE 63.VEOLIA: REVENUE, 2018–2020 ($MILLION)
FIGURE 64.VEOLIA: REVENUE SHARE BY SEGMENTS, 2020 (%)
FIGURE 65.VEOLIA: REVENUE SHARE BY REGION, 2020 (%)
FIGURE 66.WM INTELLECTUAL PROPERTY HOLDINGS, L.L.C.: REVENUE, 2018–2020 ($MILLION)
Figure 67.WM Intellectual Property Holdings, L.L.C.: Revenue share BY Region, 2020 (%)
According to CXOs of the major companies, the e-waste management market is experiencing a rapid growth, Rapid technology advancement and frequent innovations in the product lead to surge in the sale of electronic products. Especially mobile devices, televisions, and computer devices are experiencing fast growth across the world. There is a continuous increase in the sale of these electronics with increase in purchasing power and rise in trend of disposable income. In addition, new product launches with updated features and additional services attract the customers to upgrade their old products with new products. This has reduced the life span of these devices to about 3-4 years. Thus, this is adding more and more e-waste at a tremendous rate, thereby encouraging industry players to expand their business and enable them build wide network for e-waste collection and setup more processing facilities. The ongoing sale of electronic products, especially in emerging countries would provide lucrative environment for e-waste management in the coming years.
Moreover, rapid technology advancements and constant innovations in the product are enabling the electronic industry players to launch new products every day, which results in decreasing life of all white goods. In addition, with the increase in disposable income, the customers are able to afford the premium priced electronic devices, which in turn drives the demand for these devices.
According to CXOs of leading companies, the e-waste management market is experiencing a colossal shift and growth, backed by ever increasing demand and scarcity of rare metals has been leading to rapid rise in the prices of these metals. Such metals need to be recovered from e-waste for reuse in another production. For example, in one million waste of mobile phones, there is near about 250 kg of silver, 24 kg of gold, and nine tons of copper that can be recovered. This would also benefit the manufacturers to produce the electronic devices with lower cost and gain cost advantages over competitors.
E-waste contains special and precious metals including silver, gold, palladium, platinum, indium, and gallium. These scarce elements are widely used in the production of consumer electronics and IT & communication devices. Due to scarcity of these metals, the prices associated with their products is also high. This has increased the need to reuse, refurbish, and recycle the devices made from metals. Thus, these issues would certainly force the manufacturers of electronic devices to look for raw materials available from recycled e-waste. This would also benefit the nations to reduce greenhouse gas emissions and certainly help to reduce the danger of global warming. The nature of electronic devices is such that they get obsolete or need repair from time to time. This is a major cause for the generation of e-waste. The cost of replacing an electronic device is lesser than those getting repaired. Therefore, it has been observed that there is a growing tendency to purchase a new product rather than repairing those. This increased obsolescence rate is leading to huge generation of e-waste currently. This leads to reuse, refurbishment, and recycle of waste generated. This creates the need to setup wide network of collection zones. In emerging countries, with strict regulatory frameworks and initiatives of electronic product manufacturers, there would be more opportunities for management of obsolete products.
The e-waste management market is competitive and comprises a number of regional and global vendors competing based on factors such as cost of solutions & services, reliability, efficiency of products, and support services. The market is concentrated with major players consuming 30-45% of the share. The degree of concentration is expected to remain same during the forecast period. On the other hand, ever-increasing demand and scarcity of rare metals has been leading to rapid rise in the prices of these metals. Such metals need to be recovered from e-waste for reuse in another production.
Start reading instantly.
This Report and over 66,905+ more Reports, Available with Avenue Library. T&C*.
Enterprise
License/PDF
Library
Membership
*Taxes/Fees, if applicable will be added during checkout. All prices in USD
To ensure high-level data integrity, accurate analysis, and impeccable forecasts
For complete satisfaction
On-demand customization of scope of the report to exactly meet your needs
Targeted market view to provide pertinent information and save time of readers
Get insights on topics that are crucial for your business. Stay abreast of your interest areas.
Get Industry Data AlertsTo ensure high-level data integrity, accurate analysis, and impeccable forecasts
For complete satisfaction
On-demand customization of scope of the report to exactly meet your needs
Targeted market view to provide pertinent information and save time of readers