0
2022
Edge Ai Processor Market

Edge AI Processor Market

by Type (Central Processing Unit (CPU), Graphics Processing Unit (GPU), Application Specific Integrated Circuit (ASIC)), by Device Type (Consumer Devices, Enterprise Devices), by End Use (Automotive and Transportation, Healthcare, Consumer Electronics, Retail and Ecommerce, Manufacturing, Others): Global Opportunity Analysis and Industry Forecast, 2021-2030

Report Code: A16569
Jun 2022 | Pages: 284
Tables: 150
Charts: 67
  • Formats*:

  • pdf

    Single User License, Five User
    License & Enterprise User License

  • xls

    Data Pack Excel License

  • ppt

    It comes with the additional cost
    of $2500.00 contact sales.


Edge AI Processor Market Research, 2030

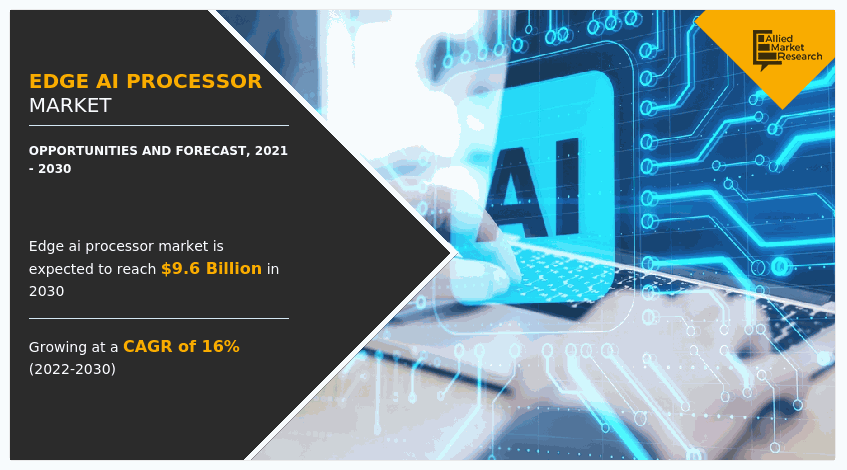
The global edge AI processor market was valued at $2.5 billion in 2021, and is projected to reach $9.6 billion by 2030, growing at a CAGR of 16% from 2022 to 2030.

COVID-19 pandemic is expected to have a positive impact on global edge AL processor market share growth. Organizations will need to reap the benefits of every technological advantage available to them as they adjust to operating in the unknown territory created by the COVID-19 pandemic. The combination of edge computing, 5G, and AI will provide them with the opportunities they require to be market responsive and thrive in the face of disruption.

Edge AI Processor Market, Edge AI Processor Industry, Edge AI Processor Market Size, Edge AI Processor Market Share, Edge AI Processor Market Growth, Edge AI Processor Market Trends, Edge AI Processor Market Analysis, Edge AI Processor Market Forecast, Edge AI Processor Market Outlook, Edge AI Processor Market Opportunity

Edge AI is a hybrid of artificial intelligence and edge computing. Locally, AI algorithms are processed, either on the device itself or on a server nearby. AI processors are specialized chips that combine artificial intelligence (AI) and machine learning to make mobile devices smart enough to mimic the human brain. Deep learning AI workloads are optimized with AI chips. Rising demand and adoption of artificial intelligence products and services are creating lucrative growth opportunities in the edge AI processor industry.

Edge AI offers many benefits and advantages which is a prime reason for edge AI processor market growth. Aside from operational timeliness, Edge has a number of other benefits, such as energy efficiency. Less data is transferred to and from the cloud as more data is processed at the Edge, resulting in lower data latency and energy usage. According to the IBV, over half of enterprises plan to adopt edge computing solutions for energy efficiency management in the coming years. Edge computing is expected to lower annual power consumption by up to 11.5% across industries in the coming years, with telecommunications and electronics businesses seeing the highest drop. AR/VR, cloud gaming, and Industry 4.0 are all examples of emerging technologies. These and a few of other new use cases have one thing in common: they all necessitate artificial intelligence at the edge (AI). Such advantages are anticipated to generate huge edge AI processor market share growth in the forecast time period.

The report highlights different factors that impact the growth of the global edge AI processor industry such as key drivers, restraints, growth opportunities, and the role of different key players.

Global Edge AI Processor Market Segmentation
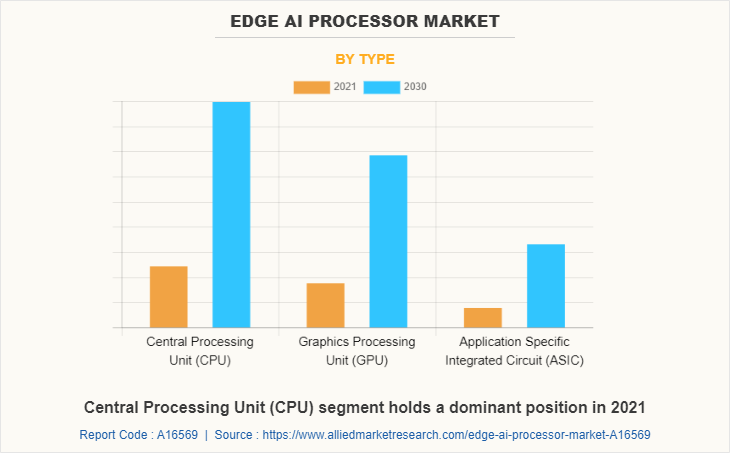
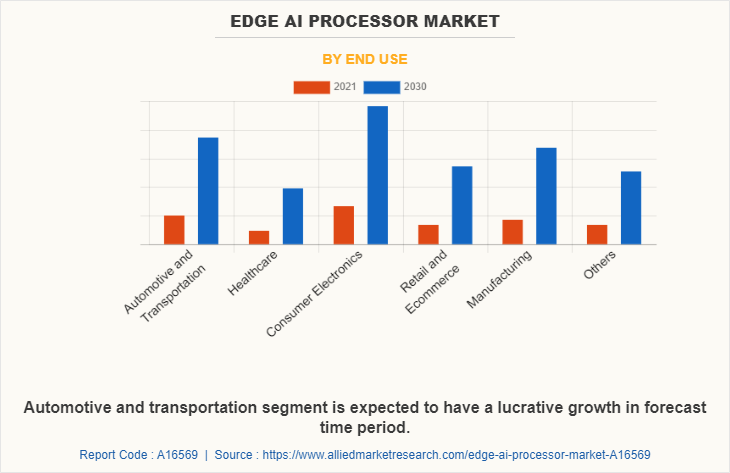
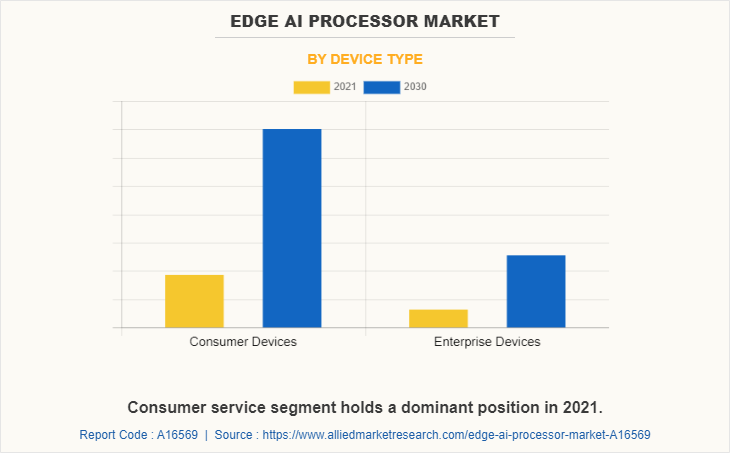
The global Edge AI processor industry is segmented on the basis of type, device type, and end-use. By type, the market is classified into central processing unit (CPU), graphics processing unit (GPU), and application specific integrated circuit (ASIC). By device type, the analysis has been divided into consumer devices and enterprise devices. By end-use the market is further divided into automotive & transportation, healthcare, consumer electronics, retail & ecommerce, manufacturing, and others. By region, the market is analyzed across North America, Europe, Asia-Pacific, and LAMEA.

Segment Review

Edge AI Processor Market

By type, the application specific integrated circuit sub-segment is predicted to be fastest growing sub-segment, with revenues exceeding $1652.0 million by 2030, up from $395.3 million in 2021. Application specific integrated circuits enable the establishment of complete mechanisms on a single chip, which is likely to boost the growth of application specific integrated circuits. This factor is expected to boost the edge AI processor market share growth in anticipated time frame.

Edge AI Processor Market

By device type, consumer devices sub-segment was the dominating sub-segment in 2021. This is attributed to its benefits, such as energy efficiency. As more data is processed at the Edge, less data is transferred to and from the cloud, resulting in reduced data latency and energy use. According to the IBV, more than half of organizations plan to use Edge computing applications for energy efficiency management in the coming years. This is one of the reasons for the growth of the Edge AI processor market size.
Edge AI Processor Market

By end-use, the healthcare sub-segment is anticipated to have the fastest growth during the forecast period. Edge computing and analytics will only become more important as they open up new ways to improve operational, clinical, and financial value across the care continuum. The expanding number of medical devices being brought into the healthcare sector will drive demand for Edge AI processors. Tablets and wearables are among them, as are health monitors and AI-powered imaging systems. These factors would be responsible for the growth of the Edge AI processor industy.

Edge AI Processor Market

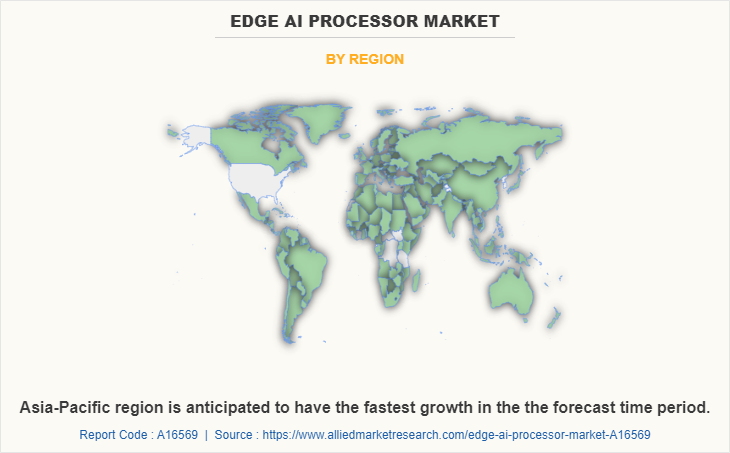
y region, North America dominated the global Edge AI processor market in 2021 and is forecasted to remain the dominant region during the forecast period. This is attributed to numerous factors such as largest production of Edge AI processors in US and Canada and wide consumer base. These factors are likely to generate huge edge AI processor market size growth in the coming few years.
The key players profiled in this report include Intel Corporation, Advanced Micro Devices, Inc., Alphabet Inc.; Intel Corporation, Qualcomm Technologies, Inc., Apple Inc, Mythic; Ltd., Arm Limited, Samsung Electronics Co., Ltd., NVIDIA Corporation, and HiSilicon (Shanghai) Technologies CO LIMITED.

IMPACT OF COVID-19 ON THE GLOBAL EDGE AI PROCESSOR MARKET

  • Organizations will need to reap the benefits of every technological advantage available to them as they adjust to operating in the unknown territory created by the COVID-19 pandemic. The combination of edge computing, 5G, and AI will provide them with the opportunities they require to be market responsive and thrive in the face of disruption.
  • A high positive impact has been witnessed in the industrial vertical, as firms have started realizing the potential of Edge AI chips in combating the impact of COVID-19.
  • Furthermore, as the world becomes more interconnected, advanced technologies such as AI gain a stronger grip on the industrial spectrum. AI chipsets, in turn, will emerge as solutions for large-scale data processing. The COVID-19 pandemic imposed new health and safety standards, altering how people interact with one another and with their immediate surroundings.
  • Increasing demand for touch-free experiences has accelerated the shift toward AI-powered systems, voice-based control, and other contactless user interfaces – bringing intelligence ever closer to the endpoint.

Key Benefits For Stakeholders

  • This report provides a quantitative analysis of the market segments, current trends, estimations, and dynamics of the edge ai processor market analysis from 2021 to 2030 to identify the prevailing edge ai processor market opportunity.
  • The market research is offered along with information related to edge AI processor market forecast and analysis regarding the future trends.
  • This report highlights the key drivers, opportunities, and restraints of the market along with the impact analysis and detailed edge AI processor market outlook during the forecast period.
  • Porter's five forces analysis highlights the potency of buyers and suppliers to enable stakeholders make profit-oriented business decisions and strengthen their supplier-buyer network.
  • In-depth analysis of the edge ai processor market segmentation assists to determine the prevailing market opportunities.
  • Major countries in each region are mapped according to their revenue contribution to the global market.
  • Market player positioning facilitates benchmarking and provides a clear understanding of the present position of the market players.
  • The report includes the analysis of the regional as well as global edge ai processor market trends, key players, market segments, application areas, and market growth strategies.

Edge AI Processor Market Report Highlights

Aspects Details
By Type
  • Central Processing Unit (CPU)
  • Graphics Processing Unit (GPU)
  • Application Specific Integrated Circuit (ASIC)
By Device Type
  • Consumer Devices
  • Enterprise Devices
By End Use
  • Automotive and Transportation
  • Healthcare
  • Consumer Electronics
  • Retail and Ecommerce
  • Manufacturing
  • Others
By Region
  • North America  (U.S., Canada, Mexico)
  • Europe  (U.K., Germany, France, Spain, Italy, Rest of Europe)
  • Asia-Pacific  (China, India, Japan, South Korea, Australia, Rest of Asia-Pacific)
  • LAMEA  (Brazil, Saudi Arabia, South Africa, Rest of LAMEA)
Key Market Players Alphabet Inc., HiSilicon(Shanghai) Technologies Co Limited, Apple Inc., Mythic, Qualcomm Technologies, Inc., Arm Limited, Advanced Micro Devices, Inc., NVIDIA Corporation, Intel Corporation, Samsung Electronics Co Ltd
 
  • CHAPTER 1:INTRODUCTION

    • 1.1.Report description

    • 1.2.Key market segments

    • 1.3.Key benefits to the stakeholders

    • 1.4.Research Methodology

      • 1.4.1.Secondary research

      • 1.4.2.Primary research

      • 1.4.3.Analyst tools and models

  • CHAPTER 2:EXECUTIVE SUMMARY

    • 2.1.Key findings of the study

    • 2.2.CXO Perspective

  • CHAPTER 3:MARKET OVERVIEW

    • 3.1.Market definition and scope

    • 3.2.Key findings

      • 3.2.1.Top investment pockets

    • 3.3.Porter’s five forces analysis

    • 3.4.Top player positioning

    • 3.5.Market dynamics

      • 3.5.1.Drivers

      • 3.5.2.Restraints

      • 3.5.3.Opportunities

    • 3.6.COVID-19 Impact Analysis on the market

    • 3.7.Value Chain Analysis

    • 3.8.Key Regulation Analysis

    • 3.9.Patent Landscape

    • 3.10.Regulatory Guidelines

    • 3.11.Market Share Analysis

  • CHAPTER 4: EDGE AI PROCESSOR MARKET, BY TYPE

    • 4.1 Overview

      • 4.1.1 Market size and forecast

    • 4.2 Central Processing Unit (CPU)

      • 4.2.1 Key market trends, growth factors and opportunities

      • 4.2.2 Market size and forecast, by region

      • 4.2.3 Market analysis by country

    • 4.3 Graphics Processing Unit (GPU)

      • 4.3.1 Key market trends, growth factors and opportunities

      • 4.3.2 Market size and forecast, by region

      • 4.3.3 Market analysis by country

    • 4.4 Application Specific Integrated Circuit (ASIC)

      • 4.4.1 Key market trends, growth factors and opportunities

      • 4.4.2 Market size and forecast, by region

      • 4.4.3 Market analysis by country

  • CHAPTER 5: EDGE AI PROCESSOR MARKET, BY DEVICE TYPE

    • 5.1 Overview

      • 5.1.1 Market size and forecast

    • 5.2 Consumer Devices

      • 5.2.1 Key market trends, growth factors and opportunities

      • 5.2.2 Market size and forecast, by region

      • 5.2.3 Market analysis by country

    • 5.3 Enterprise Devices

      • 5.3.1 Key market trends, growth factors and opportunities

      • 5.3.2 Market size and forecast, by region

      • 5.3.3 Market analysis by country

  • CHAPTER 6: EDGE AI PROCESSOR MARKET, BY END USE

    • 6.1 Overview

      • 6.1.1 Market size and forecast

    • 6.2 Automotive and Transportation

      • 6.2.1 Key market trends, growth factors and opportunities

      • 6.2.2 Market size and forecast, by region

      • 6.2.3 Market analysis by country

    • 6.3 Healthcare

      • 6.3.1 Key market trends, growth factors and opportunities

      • 6.3.2 Market size and forecast, by region

      • 6.3.3 Market analysis by country

    • 6.4 Consumer Electronics

      • 6.4.1 Key market trends, growth factors and opportunities

      • 6.4.2 Market size and forecast, by region

      • 6.4.3 Market analysis by country

    • 6.5 Retail and Ecommerce

      • 6.5.1 Key market trends, growth factors and opportunities

      • 6.5.2 Market size and forecast, by region

      • 6.5.3 Market analysis by country

    • 6.6 Manufacturing

      • 6.6.1 Key market trends, growth factors and opportunities

      • 6.6.2 Market size and forecast, by region

      • 6.6.3 Market analysis by country

    • 6.7 Others

      • 6.7.1 Key market trends, growth factors and opportunities

      • 6.7.2 Market size and forecast, by region

      • 6.7.3 Market analysis by country

  • CHAPTER 7: EDGE AI PROCESSOR MARKET, BY REGION

    • 7.1 Overview

      • 7.1.1 Market size and forecast

    • 7.2 North America

      • 7.2.1 Key trends and opportunities

      • 7.2.2 North America Market size and forecast, by Type

      • 7.2.3 North America Market size and forecast, by Device Type

      • 7.2.4 North America Market size and forecast, by End Use

      • 7.2.5 North America Market size and forecast, by country

        • 7.2.5.1 U.S.
          • 7.2.5.1.1 Market size and forecast, by Type
          • 7.2.5.1.2 Market size and forecast, by Device Type
          • 7.2.5.1.3 Market size and forecast, by End Use
        • 7.2.5.2 Canada
          • 7.2.5.2.1 Market size and forecast, by Type
          • 7.2.5.2.2 Market size and forecast, by Device Type
          • 7.2.5.2.3 Market size and forecast, by End Use
        • 7.2.5.3 Mexico
          • 7.2.5.3.1 Market size and forecast, by Type
          • 7.2.5.3.2 Market size and forecast, by Device Type
          • 7.2.5.3.3 Market size and forecast, by End Use
    • 7.3 Europe

      • 7.3.1 Key trends and opportunities

      • 7.3.2 Europe Market size and forecast, by Type

      • 7.3.3 Europe Market size and forecast, by Device Type

      • 7.3.4 Europe Market size and forecast, by End Use

      • 7.3.5 Europe Market size and forecast, by country

        • 7.3.5.1 U.K.
          • 7.3.5.1.1 Market size and forecast, by Type
          • 7.3.5.1.2 Market size and forecast, by Device Type
          • 7.3.5.1.3 Market size and forecast, by End Use
        • 7.3.5.2 Germany
          • 7.3.5.2.1 Market size and forecast, by Type
          • 7.3.5.2.2 Market size and forecast, by Device Type
          • 7.3.5.2.3 Market size and forecast, by End Use
        • 7.3.5.3 France
          • 7.3.5.3.1 Market size and forecast, by Type
          • 7.3.5.3.2 Market size and forecast, by Device Type
          • 7.3.5.3.3 Market size and forecast, by End Use
        • 7.3.5.4 Spain
          • 7.3.5.4.1 Market size and forecast, by Type
          • 7.3.5.4.2 Market size and forecast, by Device Type
          • 7.3.5.4.3 Market size and forecast, by End Use
        • 7.3.5.5 Italy
          • 7.3.5.5.1 Market size and forecast, by Type
          • 7.3.5.5.2 Market size and forecast, by Device Type
          • 7.3.5.5.3 Market size and forecast, by End Use
        • 7.3.5.6 Rest of Europe
          • 7.3.5.6.1 Market size and forecast, by Type
          • 7.3.5.6.2 Market size and forecast, by Device Type
          • 7.3.5.6.3 Market size and forecast, by End Use
    • 7.4 Asia-Pacific

      • 7.4.1 Key trends and opportunities

      • 7.4.2 Asia-Pacific Market size and forecast, by Type

      • 7.4.3 Asia-Pacific Market size and forecast, by Device Type

      • 7.4.4 Asia-Pacific Market size and forecast, by End Use

      • 7.4.5 Asia-Pacific Market size and forecast, by country

        • 7.4.5.1 China
          • 7.4.5.1.1 Market size and forecast, by Type
          • 7.4.5.1.2 Market size and forecast, by Device Type
          • 7.4.5.1.3 Market size and forecast, by End Use
        • 7.4.5.2 India
          • 7.4.5.2.1 Market size and forecast, by Type
          • 7.4.5.2.2 Market size and forecast, by Device Type
          • 7.4.5.2.3 Market size and forecast, by End Use
        • 7.4.5.3 Japan
          • 7.4.5.3.1 Market size and forecast, by Type
          • 7.4.5.3.2 Market size and forecast, by Device Type
          • 7.4.5.3.3 Market size and forecast, by End Use
        • 7.4.5.4 South Korea
          • 7.4.5.4.1 Market size and forecast, by Type
          • 7.4.5.4.2 Market size and forecast, by Device Type
          • 7.4.5.4.3 Market size and forecast, by End Use
        • 7.4.5.5 Australia
          • 7.4.5.5.1 Market size and forecast, by Type
          • 7.4.5.5.2 Market size and forecast, by Device Type
          • 7.4.5.5.3 Market size and forecast, by End Use
        • 7.4.5.6 Rest of Asia-Pacific
          • 7.4.5.6.1 Market size and forecast, by Type
          • 7.4.5.6.2 Market size and forecast, by Device Type
          • 7.4.5.6.3 Market size and forecast, by End Use
    • 7.5 LAMEA

      • 7.5.1 Key trends and opportunities

      • 7.5.2 LAMEA Market size and forecast, by Type

      • 7.5.3 LAMEA Market size and forecast, by Device Type

      • 7.5.4 LAMEA Market size and forecast, by End Use

      • 7.5.5 LAMEA Market size and forecast, by country

        • 7.5.5.1 Brazil
          • 7.5.5.1.1 Market size and forecast, by Type
          • 7.5.5.1.2 Market size and forecast, by Device Type
          • 7.5.5.1.3 Market size and forecast, by End Use
        • 7.5.5.2 Saudi Arabia
          • 7.5.5.2.1 Market size and forecast, by Type
          • 7.5.5.2.2 Market size and forecast, by Device Type
          • 7.5.5.2.3 Market size and forecast, by End Use
        • 7.5.5.3 South Africa
          • 7.5.5.3.1 Market size and forecast, by Type
          • 7.5.5.3.2 Market size and forecast, by Device Type
          • 7.5.5.3.3 Market size and forecast, by End Use
        • 7.5.5.4 Rest of LAMEA
          • 7.5.5.4.1 Market size and forecast, by Type
          • 7.5.5.4.2 Market size and forecast, by Device Type
          • 7.5.5.4.3 Market size and forecast, by End Use
  • CHAPTER 8: COMPANY LANDSCAPE

    • 8.1. Introduction

    • 8.2. Top winning strategies

    • 8.3. Product Mapping of Top 10 Player

    • 8.4. Competitive Dashboard

    • 8.5. Competitive Heatmap

    • 8.6. Key developments

  • CHAPTER 9: COMPANY PROFILES

    • 9.1 Qualcomm Technologies, Inc.

      • 9.1.1 Company overview

      • 9.1.2 Company snapshot

      • 9.1.3 Operating business segments

      • 9.1.4 Product portfolio

      • 9.1.5 Business performance

      • 9.1.6 Key strategic moves and developments

    • 9.2 Mythic

      • 9.2.1 Company overview

      • 9.2.2 Company snapshot

      • 9.2.3 Operating business segments

      • 9.2.4 Product portfolio

      • 9.2.5 Business performance

      • 9.2.6 Key strategic moves and developments

    • 9.3 Arm Limited

      • 9.3.1 Company overview

      • 9.3.2 Company snapshot

      • 9.3.3 Operating business segments

      • 9.3.4 Product portfolio

      • 9.3.5 Business performance

      • 9.3.6 Key strategic moves and developments

    • 9.4 HiSilicon(Shanghai) Technologies Co Limited

      • 9.4.1 Company overview

      • 9.4.2 Company snapshot

      • 9.4.3 Operating business segments

      • 9.4.4 Product portfolio

      • 9.4.5 Business performance

      • 9.4.6 Key strategic moves and developments

    • 9.5 Intel Corporation

      • 9.5.1 Company overview

      • 9.5.2 Company snapshot

      • 9.5.3 Operating business segments

      • 9.5.4 Product portfolio

      • 9.5.5 Business performance

      • 9.5.6 Key strategic moves and developments

    • 9.6 Advanced Micro Devices, Inc.

      • 9.6.1 Company overview

      • 9.6.2 Company snapshot

      • 9.6.3 Operating business segments

      • 9.6.4 Product portfolio

      • 9.6.5 Business performance

      • 9.6.6 Key strategic moves and developments

    • 9.7 Alphabet Inc.

      • 9.7.1 Company overview

      • 9.7.2 Company snapshot

      • 9.7.3 Operating business segments

      • 9.7.4 Product portfolio

      • 9.7.5 Business performance

      • 9.7.6 Key strategic moves and developments

    • 9.8 Apple Inc.

      • 9.8.1 Company overview

      • 9.8.2 Company snapshot

      • 9.8.3 Operating business segments

      • 9.8.4 Product portfolio

      • 9.8.5 Business performance

      • 9.8.6 Key strategic moves and developments

    • 9.9 Samsung Electronics Co Ltd

      • 9.9.1 Company overview

      • 9.9.2 Company snapshot

      • 9.9.3 Operating business segments

      • 9.9.4 Product portfolio

      • 9.9.5 Business performance

      • 9.9.6 Key strategic moves and developments

    • 9.10 NVIDIA Corporation

      • 9.10.1 Company overview

      • 9.10.2 Company snapshot

      • 9.10.3 Operating business segments

      • 9.10.4 Product portfolio

      • 9.10.5 Business performance

      • 9.10.6 Key strategic moves and developments

  • LIST OF TABLES

  • TABLE 7. EDGE AI PROCESSOR MARKET APPLICATION SPECIFIC INTEGRATED CIRCUIT (ASIC) BY COUNTRY, 2021-2030,($MILLION)
    TABLE 1. GLOBAL EDGE AI PROCESSOR MARKET, BY TYPE, 2021-2030,($MILLION)
    TABLE 2. EDGE AI PROCESSOR MARKET REVENUE, FOR CENTRAL PROCESSING UNIT (CPU), BY REGION , 2021-2030,($MILLION)
    TABLE 3. EDGE AI PROCESSOR MARKET CENTRAL PROCESSING UNIT (CPU) BY COUNTRY, 2021-2030,($MILLION)
    TABLE 4. EDGE AI PROCESSOR MARKET REVENUE, FOR GRAPHICS PROCESSING UNIT (GPU), BY REGION , 2021-2030,($MILLION)
    TABLE 5. EDGE AI PROCESSOR MARKET GRAPHICS PROCESSING UNIT (GPU) BY COUNTRY, 2021-2030,($MILLION)
    TABLE 6. EDGE AI PROCESSOR MARKET REVENUE, FOR APPLICATION SPECIFIC INTEGRATED CIRCUIT (ASIC), BY REGION , 2021-2030,($MILLION)
    TABLE 8. GLOBAL EDGE AI PROCESSOR MARKET, BY DEVICE TYPE, 2021-2030,($MILLION)
    TABLE 9. EDGE AI PROCESSOR MARKET REVENUE, FOR CONSUMER DEVICES, BY REGION , 2021-2030,($MILLION)
    TABLE 10. EDGE AI PROCESSOR MARKET CONSUMER DEVICES BY COUNTRY, 2021-2030,($MILLION)
    TABLE 11. EDGE AI PROCESSOR MARKET REVENUE, FOR ENTERPRISE DEVICES, BY REGION , 2021-2030,($MILLION)
    TABLE 12. EDGE AI PROCESSOR MARKET ENTERPRISE DEVICES BY COUNTRY, 2021-2030,($MILLION)
    TABLE 13. GLOBAL EDGE AI PROCESSOR MARKET, BY END USE, 2021-2030,($MILLION)
    TABLE 14. EDGE AI PROCESSOR MARKET REVENUE, FOR AUTOMOTIVE AND TRANSPORTATION, BY REGION , 2021-2030,($MILLION)
    TABLE 15. EDGE AI PROCESSOR MARKET AUTOMOTIVE AND TRANSPORTATION BY COUNTRY, 2021-2030,($MILLION)
    TABLE 16. EDGE AI PROCESSOR MARKET REVENUE, FOR HEALTHCARE, BY REGION , 2021-2030,($MILLION)
    TABLE 17. EDGE AI PROCESSOR MARKET HEALTHCARE BY COUNTRY, 2021-2030,($MILLION)
    TABLE 18. EDGE AI PROCESSOR MARKET REVENUE, FOR CONSUMER ELECTRONICS, BY REGION , 2021-2030,($MILLION)
    TABLE 19. EDGE AI PROCESSOR MARKET CONSUMER ELECTRONICS BY COUNTRY, 2021-2030,($MILLION)
    TABLE 20. EDGE AI PROCESSOR MARKET REVENUE, FOR RETAIL AND ECOMMERCE, BY REGION , 2021-2030,($MILLION)
    TABLE 21. EDGE AI PROCESSOR MARKET RETAIL AND ECOMMERCE BY COUNTRY, 2021-2030,($MILLION)
    TABLE 22. EDGE AI PROCESSOR MARKET REVENUE, FOR MANUFACTURING, BY REGION , 2021-2030,($MILLION)
    TABLE 23. EDGE AI PROCESSOR MARKET MANUFACTURING BY COUNTRY, 2021-2030,($MILLION)
    TABLE 24. EDGE AI PROCESSOR MARKET REVENUE, FOR OTHERS, BY REGION , 2021-2030,($MILLION)
    TABLE 25. EDGE AI PROCESSOR MARKET OTHERS BY COUNTRY, 2021-2030,($MILLION)
    TABLE 26. EDGE AI PROCESSOR MARKET, BY REGION, 2021-2030,($MILLION)
    TABLE 27. NORTH AMERICA EDGE AI PROCESSOR MARKET, BY TYPE, 2021-2030,($MILLION)
    TABLE 28. NORTH AMERICA EDGE AI PROCESSOR MARKET, BY DEVICE TYPE, 2021-2030,($MILLION)
    TABLE 29. NORTH AMERICA EDGE AI PROCESSOR MARKET, BY END USE, 2021-2030,($MILLION)
    TABLE 30. NORTH AMERICA EDGE AI PROCESSOR MARKET, BY COUNTRY, 2021-2030,($MILLION)
    TABLE 31. U.S. EDGE AI PROCESSOR MARKET BY TYPE 2021-2030,($MILLION)
    TABLE 32. U.S. EDGE AI PROCESSOR MARKET BY DEVICE TYPE 2021-2030,($MILLION)
    TABLE 33. U.S. EDGE AI PROCESSOR MARKET BY END USE 2021-2030,($MILLION)
    TABLE 34. CANADA EDGE AI PROCESSOR MARKET BY TYPE 2021-2030,($MILLION)
    TABLE 35. CANADA EDGE AI PROCESSOR MARKET BY DEVICE TYPE 2021-2030,($MILLION)
    TABLE 36. CANADA EDGE AI PROCESSOR MARKET BY END USE 2021-2030,($MILLION)
    TABLE 37. MEXICO EDGE AI PROCESSOR MARKET BY TYPE 2021-2030,($MILLION)
    TABLE 38. MEXICO EDGE AI PROCESSOR MARKET BY DEVICE TYPE 2021-2030,($MILLION)
    TABLE 39. MEXICO EDGE AI PROCESSOR MARKET BY END USE 2021-2030,($MILLION)
    TABLE 40. EUROPE EDGE AI PROCESSOR MARKET, BY TYPE, 2021-2030,($MILLION)
    TABLE 41. EUROPE EDGE AI PROCESSOR MARKET, BY DEVICE TYPE, 2021-2030,($MILLION)
    TABLE 42. EUROPE EDGE AI PROCESSOR MARKET, BY END USE, 2021-2030,($MILLION)
    TABLE 43. EUROPE EDGE AI PROCESSOR MARKET, BY COUNTRY, 2021-2030,($MILLION)
    TABLE 44. U.K. EDGE AI PROCESSOR MARKET BY TYPE 2021-2030,($MILLION)
    TABLE 45. U.K. EDGE AI PROCESSOR MARKET BY DEVICE TYPE 2021-2030,($MILLION)
    TABLE 46. U.K. EDGE AI PROCESSOR MARKET BY END USE 2021-2030,($MILLION)
    TABLE 47. GERMANY EDGE AI PROCESSOR MARKET BY TYPE 2021-2030,($MILLION)
    TABLE 48. GERMANY EDGE AI PROCESSOR MARKET BY DEVICE TYPE 2021-2030,($MILLION)
    TABLE 49. GERMANY EDGE AI PROCESSOR MARKET BY END USE 2021-2030,($MILLION)
    TABLE 50. FRANCE EDGE AI PROCESSOR MARKET BY TYPE 2021-2030,($MILLION)
    TABLE 51. FRANCE EDGE AI PROCESSOR MARKET BY DEVICE TYPE 2021-2030,($MILLION)
    TABLE 52. FRANCE EDGE AI PROCESSOR MARKET BY END USE 2021-2030,($MILLION)
    TABLE 53. SPAIN EDGE AI PROCESSOR MARKET BY TYPE 2021-2030,($MILLION)
    TABLE 54. SPAIN EDGE AI PROCESSOR MARKET BY DEVICE TYPE 2021-2030,($MILLION)
    TABLE 55. SPAIN EDGE AI PROCESSOR MARKET BY END USE 2021-2030,($MILLION)
    TABLE 56. ITALY EDGE AI PROCESSOR MARKET BY TYPE 2021-2030,($MILLION)
    TABLE 57. ITALY EDGE AI PROCESSOR MARKET BY DEVICE TYPE 2021-2030,($MILLION)
    TABLE 58. ITALY EDGE AI PROCESSOR MARKET BY END USE 2021-2030,($MILLION)
    TABLE 59. REST OF EUROPE EDGE AI PROCESSOR MARKET BY TYPE 2021-2030,($MILLION)
    TABLE 60. REST OF EUROPE EDGE AI PROCESSOR MARKET BY DEVICE TYPE 2021-2030,($MILLION)
    TABLE 61. REST OF EUROPE EDGE AI PROCESSOR MARKET BY END USE 2021-2030,($MILLION)
    TABLE 62. ASIA-PACIFIC EDGE AI PROCESSOR MARKET, BY TYPE, 2021-2030,($MILLION)
    TABLE 63. ASIA-PACIFIC EDGE AI PROCESSOR MARKET, BY DEVICE TYPE, 2021-2030,($MILLION)
    TABLE 64. ASIA-PACIFIC EDGE AI PROCESSOR MARKET, BY END USE, 2021-2030,($MILLION)
    TABLE 65. ASIA-PACIFIC EDGE AI PROCESSOR MARKET, BY COUNTRY, 2021-2030,($MILLION)
    TABLE 66. CHINA EDGE AI PROCESSOR MARKET BY TYPE 2021-2030,($MILLION)
    TABLE 67. CHINA EDGE AI PROCESSOR MARKET BY DEVICE TYPE 2021-2030,($MILLION)
    TABLE 68. CHINA EDGE AI PROCESSOR MARKET BY END USE 2021-2030,($MILLION)
    TABLE 69. INDIA EDGE AI PROCESSOR MARKET BY TYPE 2021-2030,($MILLION)
    TABLE 70. INDIA EDGE AI PROCESSOR MARKET BY DEVICE TYPE 2021-2030,($MILLION)
    TABLE 71. INDIA EDGE AI PROCESSOR MARKET BY END USE 2021-2030,($MILLION)
    TABLE 72. JAPAN EDGE AI PROCESSOR MARKET BY TYPE 2021-2030,($MILLION)
    TABLE 73. JAPAN EDGE AI PROCESSOR MARKET BY DEVICE TYPE 2021-2030,($MILLION)
    TABLE 74. JAPAN EDGE AI PROCESSOR MARKET BY END USE 2021-2030,($MILLION)
    TABLE 75. SOUTH KOREA EDGE AI PROCESSOR MARKET BY TYPE 2021-2030,($MILLION)
    TABLE 76. SOUTH KOREA EDGE AI PROCESSOR MARKET BY DEVICE TYPE 2021-2030,($MILLION)
    TABLE 77. SOUTH KOREA EDGE AI PROCESSOR MARKET BY END USE 2021-2030,($MILLION)
    TABLE 78. AUSTRALIA EDGE AI PROCESSOR MARKET BY TYPE 2021-2030,($MILLION)
    TABLE 79. AUSTRALIA EDGE AI PROCESSOR MARKET BY DEVICE TYPE 2021-2030,($MILLION)
    TABLE 80. AUSTRALIA EDGE AI PROCESSOR MARKET BY END USE 2021-2030,($MILLION)
    TABLE 81. REST OF ASIA-PACIFIC EDGE AI PROCESSOR MARKET BY TYPE 2021-2030,($MILLION)
    TABLE 82. REST OF ASIA-PACIFIC EDGE AI PROCESSOR MARKET BY DEVICE TYPE 2021-2030,($MILLION)
    TABLE 83. REST OF ASIA-PACIFIC EDGE AI PROCESSOR MARKET BY END USE 2021-2030,($MILLION)
    TABLE 84. LAMEA EDGE AI PROCESSOR MARKET, BY TYPE, 2021-2030,($MILLION)
    TABLE 85. LAMEA EDGE AI PROCESSOR MARKET, BY DEVICE TYPE, 2021-2030,($MILLION)
    TABLE 86. LAMEA EDGE AI PROCESSOR MARKET, BY END USE, 2021-2030,($MILLION)
    TABLE 87. LAMEA EDGE AI PROCESSOR MARKET, BY COUNTRY, 2021-2030,($MILLION)
    TABLE 88. BRAZIL EDGE AI PROCESSOR MARKET BY TYPE 2021-2030,($MILLION)
    TABLE 89. BRAZIL EDGE AI PROCESSOR MARKET BY DEVICE TYPE 2021-2030,($MILLION)
    TABLE 90. BRAZIL EDGE AI PROCESSOR MARKET BY END USE 2021-2030,($MILLION)
    TABLE 91. SAUDI ARABIA EDGE AI PROCESSOR MARKET BY TYPE 2021-2030,($MILLION)
    TABLE 92. SAUDI ARABIA EDGE AI PROCESSOR MARKET BY DEVICE TYPE 2021-2030,($MILLION)
    TABLE 93. SAUDI ARABIA EDGE AI PROCESSOR MARKET BY END USE 2021-2030,($MILLION)
    TABLE 94. SOUTH AFRICA EDGE AI PROCESSOR MARKET BY TYPE 2021-2030,($MILLION)
    TABLE 95. SOUTH AFRICA EDGE AI PROCESSOR MARKET BY DEVICE TYPE 2021-2030,($MILLION)
    TABLE 96. SOUTH AFRICA EDGE AI PROCESSOR MARKET BY END USE 2021-2030,($MILLION)
    TABLE 97. REST OF LAMEA EDGE AI PROCESSOR MARKET BY TYPE 2021-2030,($MILLION)
    TABLE 98. REST OF LAMEA EDGE AI PROCESSOR MARKET BY DEVICE TYPE 2021-2030,($MILLION)
    TABLE 99. REST OF LAMEA EDGE AI PROCESSOR MARKET BY END USE 2021-2030,($MILLION)
    TABLE 100.QUALCOMM TECHNOLOGIES, INC.: COMPANY SNAPSHOT
    TABLE 101.QUALCOMM TECHNOLOGIES, INC.: OPERATING SEGMENTS
    TABLE 102.QUALCOMM TECHNOLOGIES, INC.: PRODUCT PORTFOLIO
    TABLE 103.QUALCOMM TECHNOLOGIES, INC.: NET SALES,
    TABLE 104.QUALCOMM TECHNOLOGIES, INC.: KEY STRATERGIES
    TABLE 105.MYTHIC: COMPANY SNAPSHOT
    TABLE 106.MYTHIC: OPERATING SEGMENTS
    TABLE 107.MYTHIC: PRODUCT PORTFOLIO
    TABLE 108.MYTHIC: NET SALES,
    TABLE 109.MYTHIC: KEY STRATERGIES
    TABLE 110.ARM LIMITED: COMPANY SNAPSHOT
    TABLE 111.ARM LIMITED: OPERATING SEGMENTS
    TABLE 112.ARM LIMITED: PRODUCT PORTFOLIO
    TABLE 113.ARM LIMITED: NET SALES,
    TABLE 114.ARM LIMITED: KEY STRATERGIES
    TABLE 115.HISILICON(SHANGHAI) TECHNOLOGIES CO LIMITED: COMPANY SNAPSHOT
    TABLE 116.HISILICON(SHANGHAI) TECHNOLOGIES CO LIMITED: OPERATING SEGMENTS
    TABLE 117.HISILICON(SHANGHAI) TECHNOLOGIES CO LIMITED: PRODUCT PORTFOLIO
    TABLE 118.HISILICON(SHANGHAI) TECHNOLOGIES CO LIMITED: NET SALES,
    TABLE 119.HISILICON(SHANGHAI) TECHNOLOGIES CO LIMITED: KEY STRATERGIES
    TABLE 120.INTEL CORPORATION: COMPANY SNAPSHOT
    TABLE 121.INTEL CORPORATION: OPERATING SEGMENTS
    TABLE 122.INTEL CORPORATION: PRODUCT PORTFOLIO
    TABLE 123.INTEL CORPORATION: NET SALES,
    TABLE 124.INTEL CORPORATION: KEY STRATERGIES
    TABLE 125.ADVANCED MICRO DEVICES, INC.: COMPANY SNAPSHOT
    TABLE 126.ADVANCED MICRO DEVICES, INC.: OPERATING SEGMENTS
    TABLE 127.ADVANCED MICRO DEVICES, INC.: PRODUCT PORTFOLIO
    TABLE 128.ADVANCED MICRO DEVICES, INC.: NET SALES,
    TABLE 129.ADVANCED MICRO DEVICES, INC.: KEY STRATERGIES
    TABLE 130.ALPHABET INC.: COMPANY SNAPSHOT
    TABLE 131.ALPHABET INC.: OPERATING SEGMENTS
    TABLE 132.ALPHABET INC.: PRODUCT PORTFOLIO
    TABLE 133.ALPHABET INC.: NET SALES,
    TABLE 134.ALPHABET INC.: KEY STRATERGIES
    TABLE 135.APPLE INC.: COMPANY SNAPSHOT
    TABLE 136.APPLE INC.: OPERATING SEGMENTS
    TABLE 137.APPLE INC.: PRODUCT PORTFOLIO
    TABLE 138.APPLE INC.: NET SALES,
    TABLE 139.APPLE INC.: KEY STRATERGIES
    TABLE 140.SAMSUNG ELECTRONICS CO LTD: COMPANY SNAPSHOT
    TABLE 141.SAMSUNG ELECTRONICS CO LTD: OPERATING SEGMENTS
    TABLE 142.SAMSUNG ELECTRONICS CO LTD: PRODUCT PORTFOLIO
    TABLE 143.SAMSUNG ELECTRONICS CO LTD: NET SALES,
    TABLE 144.SAMSUNG ELECTRONICS CO LTD: KEY STRATERGIES
    TABLE 145.NVIDIA CORPORATION: COMPANY SNAPSHOT
    TABLE 146.NVIDIA CORPORATION: OPERATING SEGMENTS
    TABLE 147.NVIDIA CORPORATION: PRODUCT PORTFOLIO
    TABLE 148.NVIDIA CORPORATION: NET SALES,
    TABLE 149.NVIDIA CORPORATION: KEY STRATERGIES
  • LIST OF FIGURES

  • FIGURE 1.EDGE AI PROCESSOR MARKET SEGMENTATION
    FIGURE 2.EDGE AI PROCESSOR MARKET,2021-2030
    FIGURE 3.EDGE AI PROCESSOR MARKET,2021-2030
    FIGURE 4. TOP INVESTMENT POCKETS, BY REGION
    FIGURE 5.PORTER FIVE-1
    FIGURE 6.PORTER FIVE-2
    FIGURE 7.PORTER FIVE-3
    FIGURE 8.PORTER FIVE-4
    FIGURE 9.PORTER FIVE-5
    FIGURE 10.TOP PLAYER POSITIONING
    FIGURE 11.EDGE AI PROCESSOR MARKET:DRIVERS, RESTRAINTS AND OPPORTUNITIES
    FIGURE 12.VALUE CHAIN ANALYSIS
    FIGURE 13.KEY REGULATION ANALYSIS
    FIGURE 14.PATENT ANALYSIS BY COMPANY
    FIGURE 15.PATENT ANALYSIS BY COUNTRY
    FIGURE 16.REGULATORY GUIDELINES
    FIGURE 17.MARKET SHARE ANALYSIS
    FIGURE 18.EDGE AI PROCESSOR MARKET,BY TYPE,2021(%)
    FIGURE 19.COMPARATIVE SHARE ANALYSIS OF CENTRAL PROCESSING UNIT (CPU) EDGE AI PROCESSOR MARKET,2021-2030(%)
    FIGURE 20.COMPARATIVE SHARE ANALYSIS OF GRAPHICS PROCESSING UNIT (GPU) EDGE AI PROCESSOR MARKET,2021-2030(%)
    FIGURE 21.COMPARATIVE SHARE ANALYSIS OF APPLICATION SPECIFIC INTEGRATED CIRCUIT (ASIC) EDGE AI PROCESSOR MARKET,2021-2030(%)
    FIGURE 22.EDGE AI PROCESSOR MARKET,BY DEVICE TYPE,2021(%)
    FIGURE 23.COMPARATIVE SHARE ANALYSIS OF CONSUMER DEVICES EDGE AI PROCESSOR MARKET,2021-2030(%)
    FIGURE 24.COMPARATIVE SHARE ANALYSIS OF ENTERPRISE DEVICES EDGE AI PROCESSOR MARKET,2021-2030(%)
    FIGURE 25.EDGE AI PROCESSOR MARKET,BY END USE,2021(%)
    FIGURE 26.COMPARATIVE SHARE ANALYSIS OF AUTOMOTIVE AND TRANSPORTATION EDGE AI PROCESSOR MARKET,2021-2030(%)
    FIGURE 27.COMPARATIVE SHARE ANALYSIS OF HEALTHCARE EDGE AI PROCESSOR MARKET,2021-2030(%)
    FIGURE 28.COMPARATIVE SHARE ANALYSIS OF CONSUMER ELECTRONICS EDGE AI PROCESSOR MARKET,2021-2030(%)
    FIGURE 29.COMPARATIVE SHARE ANALYSIS OF RETAIL AND ECOMMERCE EDGE AI PROCESSOR MARKET,2021-2030(%)
    FIGURE 30.COMPARATIVE SHARE ANALYSIS OF MANUFACTURING EDGE AI PROCESSOR MARKET,2021-2030(%)
    FIGURE 31.COMPARATIVE SHARE ANALYSIS OF OTHERS EDGE AI PROCESSOR MARKET,2021-2030(%)
    FIGURE 32.EDGE AI PROCESSOR MARKET BY REGION,2021
    FIGURE 33.U.S. EDGE AI PROCESSOR MARKET,2021-2030($MILLION)
    FIGURE 34.CANADA EDGE AI PROCESSOR MARKET,2021-2030($MILLION)
    FIGURE 35.MEXICO EDGE AI PROCESSOR MARKET,2021-2030($MILLION)
    FIGURE 36.U.K. EDGE AI PROCESSOR MARKET,2021-2030($MILLION)
    FIGURE 37.GERMANY EDGE AI PROCESSOR MARKET,2021-2030($MILLION)
    FIGURE 38.FRANCE EDGE AI PROCESSOR MARKET,2021-2030($MILLION)
    FIGURE 39.SPAIN EDGE AI PROCESSOR MARKET,2021-2030($MILLION)
    FIGURE 40.ITALY EDGE AI PROCESSOR MARKET,2021-2030($MILLION)
    FIGURE 41.REST OF EUROPE EDGE AI PROCESSOR MARKET,2021-2030($MILLION)
    FIGURE 42.CHINA EDGE AI PROCESSOR MARKET,2021-2030($MILLION)
    FIGURE 43.INDIA EDGE AI PROCESSOR MARKET,2021-2030($MILLION)
    FIGURE 44.JAPAN EDGE AI PROCESSOR MARKET,2021-2030($MILLION)
    FIGURE 45.SOUTH KOREA EDGE AI PROCESSOR MARKET,2021-2030($MILLION)
    FIGURE 46.AUSTRALIA EDGE AI PROCESSOR MARKET,2021-2030($MILLION)
    FIGURE 47.REST OF ASIA-PACIFIC EDGE AI PROCESSOR MARKET,2021-2030($MILLION)
    FIGURE 48.BRAZIL EDGE AI PROCESSOR MARKET,2021-2030($MILLION)
    FIGURE 49.SAUDI ARABIA EDGE AI PROCESSOR MARKET,2021-2030($MILLION)
    FIGURE 50.SOUTH AFRICA EDGE AI PROCESSOR MARKET,2021-2030($MILLION)
    FIGURE 51.REST OF LAMEA EDGE AI PROCESSOR MARKET,2021-2030($MILLION)
    FIGURE 52. TOP WINNING STRATEGIES, BY YEAR
    FIGURE 53. TOP WINNING STRATEGIES, BY DEVELOPMENT
    FIGURE 54. TOP WINNING STRATEGIES, BY COMPANY
    FIGURE 55.PRODUCT MAPPING OF TOP 10 PLAYERS
    FIGURE 56.COMPETITIVE DASHBOARD
    FIGURE 57.COMPETITIVE HEATMAP OF TOP 10 KEY PLAYERS
    FIGURE 58.QUALCOMM TECHNOLOGIES, INC..: NET SALES ,($MILLION)
    FIGURE 59.MYTHIC.: NET SALES ,($MILLION)
    FIGURE 60.ARM LIMITED.: NET SALES ,($MILLION)
    FIGURE 61.HISILICON(SHANGHAI) TECHNOLOGIES CO LIMITED.: NET SALES ,($MILLION)
    FIGURE 62.INTEL CORPORATION.: NET SALES ,($MILLION)
    FIGURE 63.ADVANCED MICRO DEVICES, INC..: NET SALES ,($MILLION)
    FIGURE 64.ALPHABET INC..: NET SALES ,($MILLION)
    FIGURE 65.APPLE INC..: NET SALES ,($MILLION)
    FIGURE 66.SAMSUNG ELECTRONICS CO LTD.: NET SALES ,($MILLION)
    FIGURE 67.NVIDIA CORPORATION.: NET SALES ,($MILLION)


According to the analysts of the leading companies, the global Edge AI processor market possesses a substantial scope for growth in the future. Continuous increase in the application of Edge AI processors in healthcare industry is expected to drive the global edge AI processor market. Edge computing and analytics will only grow in importance as they provide new opportunities to increase operational, clinical, and financial value across the care continuum. The demand in the edge AI processor market will grow due to the growing number of medical devices being introduced into the healthcare sector. These include everything from tablets and wearables to health monitors and AI-powered imaging systems. However, shortage of skilled professionals is a major limitation to its growth. Artificial intelligence (AI) is becoming more widely used; recent improvements in education, healthcare, marketing, telecommunications, transportation, consumer electronics, and a variety of other fields have AI as a key. The value that AI solutions bring to customers can be used to gauge their success in the consumer electronic (CE) market. According to the CXOs, Asia-Pacific is projected to register faster growth as compared to North American and European markets.   

PURCHASE OPTIONS

Call or Email us

U.S.-Canada Toll-free: +1-800-792-5285
Int'l : +1-503-894-6022
Europe : +44-845-528-1300
Email : help@alliedmarketresearch.com
 
FREQUENTLY ASKED QUESTIONS?

A. Rapid expansion of electrical industry in the Edge AI processor sector, along with growing demand for AI mobile processors power computational imaging applications in drones, wearable electronics, robots, and self-driving cars, may create lucrative opportunities for the market

A. Edge AI Processor Market is widely used in industries like electronics, retail and e commerce and automotive industries.

A. North America is the largest regional market for Edge AI Processor market.

A. The global Edge AI processor market was valued at $2483.7 million in 2021 and is projected to reach $9566.3 million by 2030, growing at a CAGR of 16.0% from 2022 to 2030.

A. Intel Corporation, Advanced Micro Devices, Inc., Alphabet Inc.; Intel Corporation, Qualcomm Technologies, Inc., Apple Inc, Mythic; Ltd., Arm Limited, Samsung Electronics Co., Ltd., NVIDIA Corporation, and HiSilicon (Shanghai) Technologies CO LIMITED. are the leading market players active in the Edge AI processor market.

Looking for Customization?

 Customization Request

Have a Question?

 Speak with Analyst

Any Confusion?

 Inquire Before Buying

Have a glance of the Report

  Request Sample
RELATED TAGS

Purchase Full Report of
Edge Ai Processor Market

Start reading instantly.
This Report and over 68,245+ more Reports, Available with Avenue Library. T&C*.

  • Online Only
  • $3,456
  • Online cloud access only
  • Restricted print, copy, paste & download
  • Read only
  • Free industry update
    (Within 180 days)
  • Free report update in next update cycle
    (Jun 2023 - Jun 2024)
  • Data Pack
  • $3,840
  • Restricted to one authorized user
  • One print only
  • Available in
    Excel
  • Free industry update
    (Within 180 days)
  •   Free report update in next update cycle
    (Jun 2023 - Jun 2024)
  • Single User
  • $5,769
  • Restricted to one authorized user
  • One print only
  • Available in
    PDF
  • Free industry update
    (Within 180 days)
  •   Free report update in next update cycle
    (Jun 2023 - Jun 2024)
  • Five Users
  • $6,450
  • Limited to five authorized users
  • Print upto five copies
  • Available in
    PDF
  • Free industry update
    (Within 180 days)
  •   Free report update in next update cycle
    (Jun 2023 - Jun 2024)
  • Enterprise
    License/PDF

  • $10,995
  • Unlimited
    within
    company/enterprise
  • Available in Excel & PDF
  • Free industry update
    (Within 180 days)
  •   Free report update in next update cycle
    (Jun 2023 - Jun 2024)
  • Library
    Membership

  • $999 $ 1,175
    Per User/ Per month/ Billed annually
  • Published Content
    E-access
  • Company Profiles
    E-access
  • Newly Added Content Access
  • 10 PDF
    Downloads
  • 5 Excel Data
    Pack Downloads
  • 250 Company Profiles PDF Downloads
  • Buy Now

*Taxes/Fees, if applicable will be added during checkout. All prices in USD

RELATED REPORTS
 

Why Allied Market Research?


Infallible Methodology

To ensure high-level data integrity, accurate analysis, and impeccable forecasts

Analyst Support

For complete satisfaction

Customization

On-demand customization of scope of the report to exactly meet your needs

TARGETED MARKET VIEW

Targeted market view to provide pertinent information and save time of readers

Get fresh content delivered

Get insights on topics that are crucial for your business. Stay abreast of your interest areas.

Get Industry Data Alerts

Why Allied Market Research?

Infallible Methodology

To ensure high-level data integrity, accurate analysis, and impeccable forecasts

Analyst Support

For complete satisfaction

Customization

On-demand customization of scope of the report to exactly meet your needs

TARGETED MARKET VIEW

Targeted market view to provide pertinent information and save time of readers