
Electric Cargo Bike Market Insights, 2032
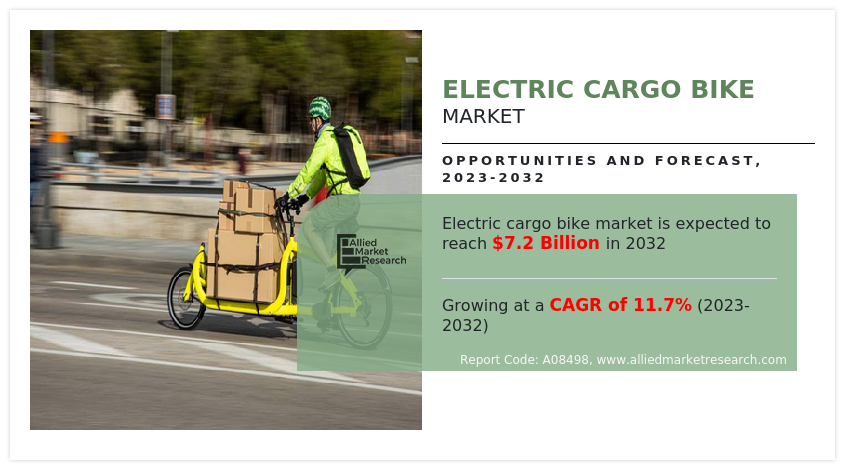
The global electric cargo bike market size was valued at $2.4 billion in 2022, and is projected to reach $7.2 billion by 2032, growing at a CAGR of 11.7% from 2023 to 2032.
Report Key Highlighters:
The study covers regions such as North America, LAMEA, Europe, and Asia-Pacific. The research includes regional and segment analysis of each country in terms of value ($million) for the projected period 2023-2032.
The study integrated high-quality data, professional opinions and analysis, and critical independent perspectives. The research approach is intended to provide a balanced view of global markets and to assist stakeholders in making educated decisions in order to achieve their most ambitious growth objectives.
Over 3,700 product literature, annual reports, industry statements, and other comparable materials from major industry participants were reviewed to gain a better understanding of the market.
The electric cargo bike market share is highly fragmented, into several players including Riese & Mller GmbH, Xtracycle Cargo Bikes, Xtracycle Cargo Bikes, Xtracycle Cargo Bikes, Yuba Bikes, Tern, Aventon Bikes, Amsterdam Bicycle Company, Pon, and Bunch Bikes. The companies have adopted strategies such as product launches, contracts, expansions, agreements, and others to improve their market positioning.
Electric cargo bike is an electric bike designed to carry cargo, freight, or heavy loads. It is fitted with an electric motor that aids the pedaling efforts of a rider. The electric cargo bike facilitates the transportation of large loads and enhances maneuverability in urban settings. The use of an electric bicycle extends pedaling duration compared to a standard bike, enabling greater distances. The components of electric cargo bikes include electric motor, battery, brakes, frame, fenders, drivetrain, and others.
The types of electric cargo bike comprise front loaders, mid-drive loaders, rear loaders, and others. Electric cargo bikes are becoming increasingly popular as eco-friendly alternatives to traditional delivery vehicles, especially in urban areas. Factors such as increase in demand for electric cargo bikes to reduce traffic congestion, surge in sustainability and environmental awareness to reduce carbon emission, and developments in e-commerce and last-mile delivery drive the growth of the electric cargo bike industry. However, lack of infrastructure and challenges related to charging, and high initial cost hinder the growth of the market. Furthermore, favorable government initiatives and regulatory support, and technological advancements offer remarkable growth opportunities for the players operating in the market. Electric cargo bike market trends are on the rise as more businesses embrace sustainable and efficient transportation solutions.
The electric cargo bike market is segmented on the basis of type, application, range, and region. By type, it is bifurcated into front loader, and longtail. By application, it is fragmented into personal use, delivery & courier, waste & municipal services, and others. By range, it is divided into less than 50 km, and more than 50 km. By region, the market is analyzed across North America, Europe, Asia-Pacific, and LAMEA.

The leading companies profiled in the e-cargo bike market report include Riese & Mller GmbH, Xtracycle Cargo Bikes, Butchers & Bicycles, Rad Power Bikes Inc., Yuba Bikes, Tern, Aventon Bikes, Amsterdam Bicycle Company, Pon, and Bunch Bikes. The companies have adopted strategies such as product development, partnership, product launch, and others to improve their market positioning.
Key Developments in Electric Cargo Bike Industry
The leading companies are adopting strategies such as acquisition, agreement, expansion, partnership, contracts, and product launches to strengthen their market position.
- In July 2023, Xtracycle Cargo Bikes launched an off-road electric cargo bike that is capable of holding up to three passengers also. It is equipped with a long rear rack that is designed to do pull double duty as both a cargo platform and a kid carrier.
- In June 2023, Tern launched a new HSD compact cargo bike with convenient features and stronger and smarter than the old HSD model. It is completely re-worked and upgraded, featuring the new Bosch Smart System
- In May 2023, Pon, through its subsidiary Urban Arrow entered into partnership with Zoomo to expand the latter's hardware offerings available on the Zoomo platform. The partnership meets the needs of the growing urban logistics delivery sector by offering customers a diverse range of vehicle types including Urban Arrow e-cargo bikes (the Cargo L and XL Cargo Line Rohloff).
- In February 2023, Aventon Bikes developed an electric cargo bike, the Abound. It is equipped with a 750-watt motor, a variety of accessories, and a total weight rating of 440 lbs or 199.5 kg with price range $2,199.
Surge in Sustainability and Environmental Awareness to Reduce Carbon Emission
The market is experiencing significant growth due to the escalating focus on sustainability and increased environmental consciousness. This momentum has evolved into a powerful force propelling market expansion. A collective effort from individuals, businesses, and governments is directed toward finding avenues to minimize carbon emissions and embrace greener practices as awareness about climate change and environmental well-being gain momentum. According to the researchers at the University of Westminster, cut carbon emissions by 90% compared with diesel vans, and 33% compared with electric vans.

Moreover, according to a study by Transport for Quality of Life, the impact of cargo e-bikes on reducing CO2 emissions varied depending on their deployment location. The study revealed that emissions were lowered by a significant range of 22% to 75%. In addition, businesses are astutely acknowledging the value of aligning with eco-conscious strategies. They recognize that incorporating environment-friendly practices not only enhances their brand image but also resonates deeply with customers who prioritize sustainability. There is a growing emphasis on embracing environment-friendly alternatives with the acceleration of climate change concerns. Electric cargo bikes, offering emission-free transportation solutions, are optimally positioned to meet this demand, which is expected to boost the growth of the market.
Rise of e-Commerce and Last-Mile Delivery
The surge in e-commerce has emerged as a potential driver for the expansion of the market. According to Morgan Stanley, the e-commerce sector possesses significant potential for expansion, with the possibility of scaling up from its current value of $3.3 trillion to a projected $5.4 trillion by the year 2026. Moreover, according to Forbes, the global e-commerce market is expected to reach $6.3 trillion in 2023. E-commerce sales are expected to grow 10.4% in 2023, and 20.8% of retail purchases are expected to take place online in 2023. As online shopping gains increasing prevalence, there is an increase in the need for swift and reliable delivery services. With the rise of e-commerce, the volume of parcels being transported has surged, creating a need for vehicles such as e- cargo bikes.
They function effectively within high-density networks featuring frequent stops within proximity, as this approach tends to yield favorable financial outcomes. The adaptability of parking electric cargo bikes is a significant advantage. Furthermore, e-cargo bikes are suitable for time-sensitive and last-mile deliveries, as their compact size allows them to maneuver through congested areas more efficiently, thereby enhancing their reliability. Therefore, these advantages are expected to accelerate the electric cargo bike market demand during the forecast period.

Lack of Infrastructure and Challenges Related to Charging.
While electric cargo bikes offer a sustainable solution for urban transportation, their adoption is partially dependent on the availability of charging infrastructure. Establishing a comprehensive network of charging stations for these bikes may pose challenges, especially in areas with limited infrastructure development. Moreover, the existing charging infrastructure may need to be upgraded to accommodate the growing number of electric cargo bikes. This could potentially hinder market growth, as inadequate charging options might deter businesses and individuals from transitioning to electric cargo bikes.
Favorable Government Initiatives and Regulatory Support
Favorable government initiatives and regulatory support present a significant opportunity for driving the growth of the electric cargo bike market. As governments worldwide increasingly prioritize sustainable transportation solutions and the reduction of carbon emissions, they are introducing policies and incentives that directly benefit the adoption of electric cargo bikes. Moreover, the government of various countries funds and supports projects to promote the adoption of electric cargo bikes. For instance, in June 2023, Siemens Stiftung and Impact Hub Accra collaboratively drove a transformative initiative in Ghana. Through their joint efforts, they are actively advancing the implementation of the "Made in Ghana" e-cargo bikes project, which received co-funding support from the German government's International Climate Initiative (IKI).

The central objective of this project is to contribute to the crucial decarbonization of Ghana's transportation sector. In addition, the government takes initiatives to increase the use of flexible and adaptable solution for transportation needs such as cargo bikes and e-cargo bikes. Government initiatives include subsidies, grants, tax incentives, and regulatory adjustments specifically tailored to encourage the adoption of electric cargo bikes. For instance, in August 2023, Dublin City Council announced a range of new initiatives to boost the use of cargo bikes in the city. This project aims to extend electric cargo bikes to non-profit organizations, encompassing community groups, charities, and sports clubs.
These electric cargo bikes will be accessible on a loan basis, allowing usage for a duration of up to 12 months. The e-cargo Bikes for Business pilot initiative transitioned into a permanent offering. The local businesses are able to experiment with electric cargo bikes for an extended period of up to 12 months. Dublin City Council plays a pivotal role by providing a substantial 60% subsidy on rental costs. Such government initiatives and regulatory frameworks with the electric cargo bike are expected to significantly boost market penetration.
Key Benefits For Stakeholders
- This report provides a quantitative analysis of the market segments, current trends, estimations, and dynamics of the electric cargo bike market analysis from 2022 to 2032 to identify the prevailing market opportunities.
- The market research is offered along with information related to key drivers, restraints, and opportunities.
- Porter's five forces analysis highlights the potency of buyers and suppliers to enable stakeholders make profit-oriented business decisions and strengthen their supplier-buyer network.
- In-depth analysis of the market segmentation assists to determine the prevailing market opportunities.
- Major countries in each region are mapped according to their revenue contribution to the global market.
- Market player positioning facilitates benchmarking and provides a clear understanding of the present position of the market players.
- The report includes the analysis of the regional as well as global market trends, key players, market segments, application areas, and market growth strategies.
Electric Cargo Bike Market Report Highlights
| Aspects | Details |
| Market Size By 2032 | USD 7.2 billion |
| Growth Rate | CAGR of 11.7% |
| Forecast period | 2022 - 2032 |
| Report Pages | 218 |
| By Type |
|
| By Application |
|
| By Range |
|
| By Region |
|
| Key Market Players | Riese & Mller GmbH, Pon, Amsterdam Bicycle Company, Yuba Bikes, Bunch Bikes, Rad Power Bikes Inc.,, Butchers & Bicycles, Aventon Bikes, Tern, Xtracycle Cargo Bikes |
Longtail electric cargo bike is the upcoming trends of electric cargo bike market in the world.
Personal use is the leading application of electric cargo bike market.
Asia-Pacific is the largest regional market for electric cargo bike.
The global electric cargo bike market was valued at $2,385.5 million in 2022, and is projected to reach $7,228.2 million by 2032, registering a CAGR of 11.7% from 2023 to 2032.
The leading companies profiled in the report include Riese & Mller GmbH, Xtracycle Cargo Bikes, Butchers & Bicycles, Rad Power Bikes Inc., Yuba Bikes, Tern, Aventon Bikes, Amsterdam Bicycle Company, Pon, and Bunch Bikes.
Loading Table Of Content...
Loading Research Methodology...

