0
New
New
2023
Electric Vehicle Charger Market

Electric Vehicle Charger Market

by Vehicle Type (Battery Electric Vehicle (BEV), Plug-in Hybrid Electric Vehicle (PHEV), Hybrid Electric Vehicle (HEV)), by End User (Residential, Commercial), by Charging Type (On-board Chargers, Off-board Chargers): Global Opportunity Analysis and Industry Forecast, 2023-2032

Report Code: A03738
May 2023 | Pages: 380
Tables: 124
Charts: 79
  • Formats*:

  • pdf

    Single User License, Five User
    License & Enterprise User License

  • xls

    Data Pack Excel License

  • ppt

    It comes with the additional cost
    of $2500.00 contact sales.


EV Charger Market 2022-2032:

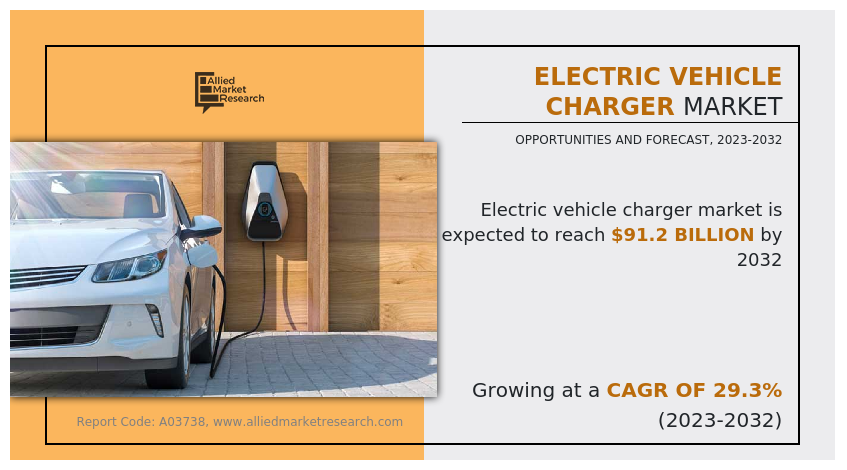
The global electric vehicle charger market size was valued at $7.2 billion in 2022, and is projected to reach $91.2 billion by 2032, growing at a CAGR of 29.3% from 2023 to 2032.

Report Key Highlighters:

  • The electric vehicle charger market study covers more than 15 countries. The research includes a segment analysis of each country in terms of value ($million) for the projected period 2022-2032.
  • The study integrated high-quality data, professional opinions and analysis, and critical independent perspectives. The research approach is intended to provide a balanced view of global markets and to assist stakeholders in making educated decisions to achieve their most ambitious growth objectives.
  • Over 3,700 product literature, annual reports, industry statements, and other comparable materials from major industry participants were reviewed to gain a better understanding of the market.
  • The electric vehicle charger market is highly fragmented, with several players including Chargemaster, Chroma ATE Inc, Delphi Technologies, Robert Bosch GmbH, AeroVironment, Inc., Schaffner Holding AG, Pod Point, ABB, Siemens, and ChargePoint, Inc. Key strategies such as product launch, expansion, agreement, partnership of the players operating in the market are tracked and monitored.

An electric vehicle charger is a device that supplies the required electrical energy to recharge an electric battery of the vehicle. It is a crucial part of the infrastructure for charging electric vehicles and enables recharging of vehicles at home, at work, or in public areas such as charging stations or parking lots. An electric vehicle (EV) charger charges electric vehicles with a battery and an electrical source that helps to charge the battery. Charging of such vehicles is achieved through various levels of charging, that is, level 1, level 2, and level 3. The cost in addition to the maintenance cost of electric vehicles is lower compared to conventional petrol/diesel cars. It typically consists of an input power connector, a power conversion unit, control electronics, and an output connector compatible with charging port of the EV.

Electric Vehicle Charger Market

Factors such as the implementation of stringent government regulations to limit environmental pollution, increase in penetration of electric vehicles, and increase in government initiatives for the development of electric vehicle charging infrastructure boost the growth of the electric vehicle charger market. However, limited number of EV charging stations and lack of standardization of EV charging is anticipated to hinder the market growth. Surge in demand for luxurious & feature-enabled vehicles, and wireless charging for electric vehicles, on the other hand, provide a remarkable growth opportunity for the market players operating in the EV charger market.

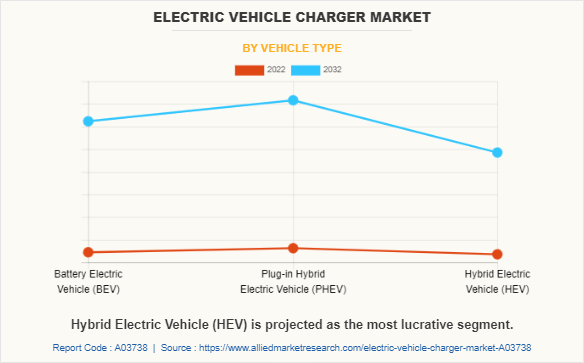
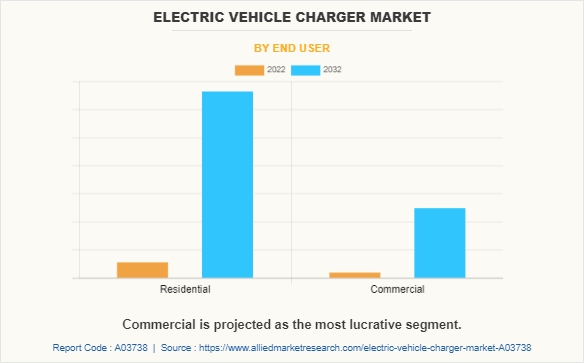
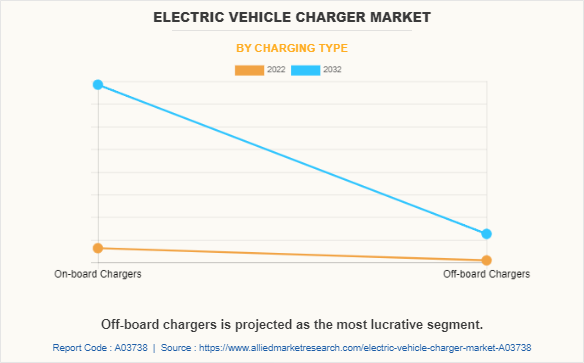
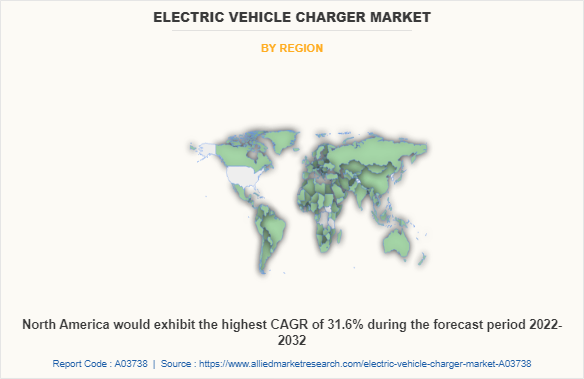
The electric vehicle charger market is segmented on the basis of vehicle type, charging type, end user, and region. On the basis of vehicle type, the market is divided into battery electric vehicles (BEV), plug-in electric vehicles (PHEV), and hybrid electric vehicles (HEV). On the basis of end user, it is bifurcated into residential and commercial chargers. On the basis of charging type, it is classified into on-board chargers, and off-board chargers. On the basis of region, the market is analyzed across North America, Europe, Asia-Pacific, and LAMEA.

Electric Vehicle Charger Market

The leading companies profiled in the electric vehicle charger market report include Chargemaster, Chroma ATE Inc, Delphi Technologies, Robert Bosch GmbH, AeroVironment, Inc., Schaffner Holding AG, Pod Point, ABB, Siemens, and ChargePoint, Inc. The market players invest in research and development, expansion in charging networks; and collaborate with automobile companies to increase the EV charger market share.

Asia-Pacific includes countries such as China, India, Japan, South Korea, and the rest of Asia-Pacific. Numerous countries in the region have implemented policies and incentives to promote electric vehicle adoption. These include subsidies, tax benefits, and the establishment of charging infrastructure. Favorable government policies related to electric vehicles are thus expected to accelerate the development of electric vehicle chargers.
The development of an extensive and reliable charging infrastructure is crucial for the widespread adoption of electric vehicles. Governments, businesses, and charging infrastructure providers are actively investing in the expansion of charging networks across the region. Therefore, such initiatives to develop charging infrastructure support the growth of the EV charger market. China has been actively expanding its charging infrastructure network. The government and private companies have invested heavily in building charging stations, including fast-charging stations along highways.

The rise in popularity of electric vehicles in China drives the demand for EV chargers. For instance, according to a 2023 report from the International Energy Agency, electric car sales reached over 10 million units globally in 2022. China accounted for approximately 60% of the electric car market, indicating its dominance in electric vehicle sales. The need for a robust and widespread charging infrastructure grows as more individuals and businesses adopt electric vehicles. Moreover, Chinese companies are at the forefront of developing EV charging technologies. They have made significant advancements in fast-charging technologies, battery-swapping solutions, and smart charging systems. Therefore, this creates opportunities for the expansion of the EV charger market.

Electric Vehicle Charger Market

According to data by Japan Automobile Dealers Association and Japan Light Motor Vehicle and Motorcycle Association, the sales of electric vehicles (EVs) within the country experienced a significant increase in March. Specifically, light passenger EV sales surged more than 30 times compared to 2022, reaching approximately 4,500 units. The surge in EV sales encourages the expansion of the charging network and the development of chargers. Moreover, the government has actively promoted the adoption of electric vehicles and the development of charging infrastructure. For instance, in January 2023, Japan announced plans to ease regulations on fast electric vehicle (EV) chargers in an effort to accelerate the deployment of charging infrastructure across the country. This move aims to boost the growth of the EV charger market and support the widespread adoption of electric vehicles in Japan.
Implementation of stringent government regulations to limit environmental pollution

The conventional gas-powered vehicle makes use of an internal combustion engine to generate power. In an ideal scenario, the combustion system completely incinerates the fuel and emits carbon dioxide and water as waste; however, the combustion system generates various greenhouse gases, leading to environmental pollution. However, an electric vehicle uses an electric motor powered via a continuous supply of current, therefore, it does not lead to emission of pollutants. 

Various countries across the globe have implemented emission regulations for vehicles, including regulations targeting greenhouse gas emissions. These regulations are primarily driven by environmental concerns and the need to address climate change. For instance, in April 2023, the United States Environmental Protection Agency (EPA) implemented regulations that set standards for greenhouse gas emissions from vehicles. These regulations are made to reduce the amount of carbon dioxide and other greenhouse gases emitted during vehicle operation. Moreover, in April 2023, the U.S. government put forth a proposal for stringent automobile pollution limits that would necessitate up to two-thirds of new vehicles sold in the U.S. to be electric by 2032.

In addition, Indian government has already launched initiatives, such as, Faster Adoption of Manufacturing of Electric Vehicles Scheme – II (FAME – II) and Production Linked Incentive Scheme (PLI) to promote the adoption of electric vehicles. Numerous initiatives, regulations, and subsidiaries for electric vehicles to control emissions are thus expected to drive the growth of the market.

Increase in penetration of electric vehicles

Gasoline being a fossil fuel is not a renewable source of energy and is expected to exhaust in the future. It is important to develop and use alternative sources of fuel to support sustainable development. This involves the use of electric vehicles, which do not use gas and are more economical compared to conventional vehicles. According to the International Global Electric Vehicle Outlook of Energy Agency, global sales of electric cars surpassed 10 million units in 2022. Moreover, the report projects a further 35% growth in sales for the year 2023, with an estimated 14 million electric cars expected to be sold worldwide.

Furthermore, by 2030, electric vehicles (EVs) are projected to make up more than 10% of the total road vehicle fleet. The sales of EVs are expected to exceed 20 million units in 2025 and surpass 40 million units in 2030. These figures represent over 20% and 30% of all vehicle sales worldwide, respectively. Therefore, the demand for fuel-efficient vehicles has increased, owing to the rise in the price of petrol and diesel. This is attributed to the depletion of fossil fuel reserves and environmental concerns. Thus, these factors boost the need for advanced fuel-efficient technologies, leading to a surge in demand for electrically powered vehicles, which, in turn, propels the demand for electric vehicle chargers.
Electric Vehicle Charger Market

Limited number of EV charging stations 

Establishing a robust charging infrastructure network necessitates substantial investments and a considerable amount of time. The installation of charging stations entails intricate procedures such as acquiring permits, identifying appropriate locations, and ensuring access to reliable electrical grids. Given the relatively recent acceleration in the adoption of electric vehicles, the development of charging infrastructure still strives to meet the increase in demand. Insufficient availability of charging stations may impede the widespread adoption of electric vehicles in specific regions or countries.

The absence of adequate charging infrastructure may create reluctance among potential buyers to transition to electric vehicles, thereby hampering the overall growth of the EV market and subsequently reducing the demand for EV chargers. The lack of presence of an adequate number of EV charging stations is thus anticipated to hamper the market growth of the market.

Surge in demand for luxurious & feature-enabled vehicles

There is a significant increase in consumer interest and purchasing preferences toward high-end vehicles that offer advanced features, technology, and luxury amenities. Luxurious vehicles provide integration of state-of-the-art technologies, including advanced infotainment systems, driver-assistance features, premium audio systems, and the use of high-quality materials and superior craftsmanship. These vehicles provide an elevated level of comfort, aesthetics, and prestige that surpasses standard vehicles. 

Moreover, manufacturers and automakers are responding to this surge in demand by introducing new models and variants that cater to the luxury segment. For instance, in April 2023, Volkswagen, an automobile manufacturer, introduced an electric luxury sedan as part of its commitment to electrification and sustainable mobility. The vehicle is designed to offer a luxurious driving experience while being powered by an electric drivetrain, aligning with the global shift towards electric vehicles (EVs) and reducing dependence on fossil fuels. 

The surge in demand for luxurious vehicles drives luxury car manufacturers to introduce electric models specifically tailored to meet the preferences of luxury car buyers. As a result, there is a rise in demand for EV chargers as owners of luxury electric vehicles seek reliable, convenient, and efficient charging solutions to accommodate their high-end vehicles. The rapid escalation in penetration of luxurious and feature-enabled EVs across the globe is thus expected to boost the growth of the electric vehicle charger market.
The electric vehicle charger market is segmented into Vehicle Type, End User and Charging Type.

Electric Vehicle Charger Market

Recent Developments

  • In January 2023, ABB expanded its production of EV chargers in South Carolina. This significantly reduces delivery and lead times for DC fast chargers in the US, enabling charging developers, owners, and operators to deploy reliable chargers rapidly.
  • In January 2023, ChargePoint, Inc. signed an agreement with Stem, one of the global leaders in AI-driven clean energy solutions and services to accelerate the deployment of EV charging and battery storage solutions for highway corridor DC fast charging and other EV charging applications.
  • In April 2023, ChargePoint Holdings Inc signed an agreement with ALD Automotive to establish a new EV charging business in Europe, aiming to accelerate corporate fleet electrification by providing a comprehensive charging solution for drivers with access to over 485,000 charging ports through a single app and charging card.
  • In May 2023, Siemens entered into an agreement to acquire the EV division of Mumbai-based Mass-Tech Controls Private Limited. The division is engaged in the design, engineering, and manufacturing of a wide range of AC chargers, and 30 to 300kW capacity DC chargers for various end applications for EVs.
  • In July 2023, Robert Bosch GmbH launched electric vehicle (EV) chargers, the EV300 Level 2 EV Charging Station, and EV3000 DC Fast Charger. Both chargers were created to provide a more affordable charging option without compromising safety & amp, charging capabilities.

The outbreak of COVID-19 resulted in disrupted global supply chains, and a halt in the manufacturing and distribution of electric vehicle chargers. Moreover, the restrictions and lockdown measures imposed in numerous countries limited the installation and expansion of charging infrastructure. However, post-pandemic, governments of various countries across the globe recognized the role of electric vehicles in achieving sustainability goals and economic recovery. Post-pandemic, governments introduced stimulus packages and incentives to promote the electric vehicle industry, which accelerated the growth of the electric vehicle charger market.

Key Benefits For Stakeholders

  • This report provides a quantitative analysis of the market segments, current trends, estimations, and dynamics of the electric vehicle charger market analysis from 2022 to 2032 to identify the prevailing electric vehicle charger market opportunities.
  • The market research is offered along with information related to key drivers, restraints, and opportunities.
  • Porter's five forces analysis highlights the potency of buyers and suppliers to enable stakeholders make profit-oriented business decisions and strengthen their supplier-buyer network.
  • In-depth analysis of the electric vehicle charger market segmentation assists to determine the prevailing market opportunities.
  • Major countries in each region are mapped according to their revenue contribution to the global market.
  • Market player positioning facilitates benchmarking and provides a clear understanding of the present position of the market players.
  • The report includes the analysis of the regional as well as global electric vehicle charger market trends, key players, market segments, application areas, and market growth strategies.

Electric Vehicle Charger Market Report Highlights

Aspects Details
Market Size By 2032 USD 91.2 billion
Growth Rate CAGR of 29.3%
Forecast period 2022 - 2032
Report Pages 380
By Vehicle Type
  • Battery Electric Vehicle (BEV)
  • Plug-in Hybrid Electric Vehicle (PHEV)
  • Hybrid Electric Vehicle (HEV)
By End User
  • Residential
  • Commercial
By Charging Type
  • On-board Chargers
  • Off-board Chargers
By Region
  • North America  (U.S., Canada, Mexico)
  • Europe  (UK, Germany, France, Netherlands, Norway, Rest of Europe)
  • Asia-Pacific  (China, Japan, India, South Korea, Rest of Asia-Pacific)
  • LAMEA  (Latin America, Middle East, Africa)
Key Market Players Chargemaster, Siemens, AeroVironment, Inc., ABB, Delphi Technologies PLC, Pod Point, Chroma ATE Inc., Robert Bosch GmbH., Schaffner Holding AG., ChargePoint, Inc.

Analyst Review

The global electric vehicle charger market is expected to witness growth owing to a rise in electric vehicle adoption, and favorable government initiatives to build charging infrastructure.

Charging infrastructure is vital for the mass adoption of electric vehicles. Several government initiatives have been undertaken to provide EV charging stations across the world. Governments across the globe have recognized the importance of building a robust charging network to facilitate the widespread adoption of EVs. As a result, they have implemented various initiatives to accelerate the development of charging infrastructure. For instance, in September 2022, the U.S. government announced the approval of the first 35 state plans to build out electric vehicle (EV) charging infrastructure. The plans are part of the broader efforts to accelerate the adoption of electric vehicles and support the transition to cleaner transportation. 

Moreover, there is a rise in the efforts and actions taken by governments to support and promote the expansion of charging infrastructure for electric vehicles (EVs). For instance, in October 2022, the German government approved a plan to allocate $6.9 billion (6.3 billion euros) over three years for the purpose of rapidly expanding the number of charging stations. This investment is in line with the commitment of Germany to achieving net-zero emissions from the transportation sector, and it aims to accelerate the transition toward electric mobility by ensuring an extensive and accessible charging infrastructure network. Therefore, government initiatives for the development of electric vehicle charging infrastructure play a crucial role in driving the growth of the market.

 
  • CHAPTER 1: INTRODUCTION

    • 1.1. Report description

    • 1.2. Key market segments

    • 1.3. Key benefits to the stakeholders

    • 1.4. Research Methodology

      • 1.4.1. Primary research

      • 1.4.2. Secondary research

      • 1.4.3. Analyst tools and models

  • CHAPTER 2: EXECUTIVE SUMMARY

    • 2.1. CXO Perspective

  • CHAPTER 3: MARKET OVERVIEW

    • 3.1. Market definition and scope

    • 3.2. Key findings

      • 3.2.1. Top impacting factors

      • 3.2.2. Top investment pockets

    • 3.3. Porter’s five forces analysis

      • 3.3.1. Low bargaining power of suppliers

      • 3.3.2. Low threat of new entrants

      • 3.3.3. Low threat of substitutes

      • 3.3.4. Low intensity of rivalry

      • 3.3.5. Low bargaining power of buyers

    • 3.4. Market dynamics

      • 3.4.1. Drivers

        • 3.4.1.1. Implementation of stringent government regulations to limit environmental pollution.
        • 3.4.1.2. Increase in penetration of electric vehicles
        • 3.4.1.3. Increase in government initiatives for the development of electric vehicle charging infrastructure

      • 3.4.2. Restraints

        • 3.4.2.1. Limited number of EV charging stations
        • 3.4.2.2. Lack of standardization of EV charging

      • 3.4.3. Opportunities

        • 3.4.3.1. Surge in demand for luxurious & feature-enabled vehicles
        • 3.4.3.2. Wireless charging for electric vehicle

    • 3.5. COVID-19 Impact Analysis on the market

  • CHAPTER 4: ELECTRIC VEHICLE CHARGER MARKET, BY VEHICLE TYPE

    • 4.1. Overview

      • 4.1.1. Market size and forecast

    • 4.2. Battery Electric Vehicle (BEV)

      • 4.2.1. Key market trends, growth factors and opportunities

      • 4.2.2. Market size and forecast, by region

      • 4.2.3. Market share analysis by country

    • 4.3. Plug-in Hybrid Electric Vehicle (PHEV)

      • 4.3.1. Key market trends, growth factors and opportunities

      • 4.3.2. Market size and forecast, by region

      • 4.3.3. Market share analysis by country

    • 4.4. Hybrid Electric Vehicle (HEV)

      • 4.4.1. Key market trends, growth factors and opportunities

      • 4.4.2. Market size and forecast, by region

      • 4.4.3. Market share analysis by country

  • CHAPTER 5: ELECTRIC VEHICLE CHARGER MARKET, BY END USER

    • 5.1. Overview

      • 5.1.1. Market size and forecast

    • 5.2. Residential

      • 5.2.1. Key market trends, growth factors and opportunities

      • 5.2.2. Market size and forecast, by region

      • 5.2.3. Market share analysis by country

    • 5.3. Commercial

      • 5.3.1. Key market trends, growth factors and opportunities

      • 5.3.2. Market size and forecast, by region

      • 5.3.3. Market share analysis by country

  • CHAPTER 6: ELECTRIC VEHICLE CHARGER MARKET, BY CHARGING TYPE

    • 6.1. Overview

      • 6.1.1. Market size and forecast

    • 6.2. On-board Chargers

      • 6.2.1. Key market trends, growth factors and opportunities

      • 6.2.2. Market size and forecast, by region

      • 6.2.3. Market share analysis by country

    • 6.3. Off-board Chargers

      • 6.3.1. Key market trends, growth factors and opportunities

      • 6.3.2. Market size and forecast, by region

      • 6.3.3. Market share analysis by country

  • CHAPTER 7: ELECTRIC VEHICLE CHARGER MARKET, BY REGION

    • 7.1. Overview

      • 7.1.1. Market size and forecast By Region

    • 7.2. North America

      • 7.2.1. Key market trends, growth factors and opportunities

      • 7.2.2. Market size and forecast, by Vehicle Type

      • 7.2.3. Market size and forecast, by End User

      • 7.2.4. Market size and forecast, by Charging Type

      • 7.2.5. Market size and forecast, by country

        • 7.2.5.1. U.S.
          • 7.2.5.1.1. Market size and forecast, by Vehicle Type
          • 7.2.5.1.2. Market size and forecast, by End User
          • 7.2.5.1.3. Market size and forecast, by Charging Type
        • 7.2.5.2. Canada
          • 7.2.5.2.1. Market size and forecast, by Vehicle Type
          • 7.2.5.2.2. Market size and forecast, by End User
          • 7.2.5.2.3. Market size and forecast, by Charging Type
        • 7.2.5.3. Mexico
          • 7.2.5.3.1. Market size and forecast, by Vehicle Type
          • 7.2.5.3.2. Market size and forecast, by End User
          • 7.2.5.3.3. Market size and forecast, by Charging Type
    • 7.3. Europe

      • 7.3.1. Key market trends, growth factors and opportunities

      • 7.3.2. Market size and forecast, by Vehicle Type

      • 7.3.3. Market size and forecast, by End User

      • 7.3.4. Market size and forecast, by Charging Type

      • 7.3.5. Market size and forecast, by country

        • 7.3.5.1. UK
          • 7.3.5.1.1. Market size and forecast, by Vehicle Type
          • 7.3.5.1.2. Market size and forecast, by End User
          • 7.3.5.1.3. Market size and forecast, by Charging Type
        • 7.3.5.2. Germany
          • 7.3.5.2.1. Market size and forecast, by Vehicle Type
          • 7.3.5.2.2. Market size and forecast, by End User
          • 7.3.5.2.3. Market size and forecast, by Charging Type
        • 7.3.5.3. France
          • 7.3.5.3.1. Market size and forecast, by Vehicle Type
          • 7.3.5.3.2. Market size and forecast, by End User
          • 7.3.5.3.3. Market size and forecast, by Charging Type
        • 7.3.5.4. Netherlands
          • 7.3.5.4.1. Market size and forecast, by Vehicle Type
          • 7.3.5.4.2. Market size and forecast, by End User
          • 7.3.5.4.3. Market size and forecast, by Charging Type
        • 7.3.5.5. Norway
          • 7.3.5.5.1. Market size and forecast, by Vehicle Type
          • 7.3.5.5.2. Market size and forecast, by End User
          • 7.3.5.5.3. Market size and forecast, by Charging Type
        • 7.3.5.6. Rest of Europe
          • 7.3.5.6.1. Market size and forecast, by Vehicle Type
          • 7.3.5.6.2. Market size and forecast, by End User
          • 7.3.5.6.3. Market size and forecast, by Charging Type
    • 7.4. Asia-Pacific

      • 7.4.1. Key market trends, growth factors and opportunities

      • 7.4.2. Market size and forecast, by Vehicle Type

      • 7.4.3. Market size and forecast, by End User

      • 7.4.4. Market size and forecast, by Charging Type

      • 7.4.5. Market size and forecast, by country

        • 7.4.5.1. China
          • 7.4.5.1.1. Market size and forecast, by Vehicle Type
          • 7.4.5.1.2. Market size and forecast, by End User
          • 7.4.5.1.3. Market size and forecast, by Charging Type
        • 7.4.5.2. Japan
          • 7.4.5.2.1. Market size and forecast, by Vehicle Type
          • 7.4.5.2.2. Market size and forecast, by End User
          • 7.4.5.2.3. Market size and forecast, by Charging Type
        • 7.4.5.3. India
          • 7.4.5.3.1. Market size and forecast, by Vehicle Type
          • 7.4.5.3.2. Market size and forecast, by End User
          • 7.4.5.3.3. Market size and forecast, by Charging Type
        • 7.4.5.4. South Korea
          • 7.4.5.4.1. Market size and forecast, by Vehicle Type
          • 7.4.5.4.2. Market size and forecast, by End User
          • 7.4.5.4.3. Market size and forecast, by Charging Type
        • 7.4.5.5. Rest of Asia-Pacific
          • 7.4.5.5.1. Market size and forecast, by Vehicle Type
          • 7.4.5.5.2. Market size and forecast, by End User
          • 7.4.5.5.3. Market size and forecast, by Charging Type
    • 7.5. LAMEA

      • 7.5.1. Key market trends, growth factors and opportunities

      • 7.5.2. Market size and forecast, by Vehicle Type

      • 7.5.3. Market size and forecast, by End User

      • 7.5.4. Market size and forecast, by Charging Type

      • 7.5.5. Market size and forecast, by country

        • 7.5.5.1. Latin America
          • 7.5.5.1.1. Market size and forecast, by Vehicle Type
          • 7.5.5.1.2. Market size and forecast, by End User
          • 7.5.5.1.3. Market size and forecast, by Charging Type
        • 7.5.5.2. Middle East
          • 7.5.5.2.1. Market size and forecast, by Vehicle Type
          • 7.5.5.2.2. Market size and forecast, by End User
          • 7.5.5.2.3. Market size and forecast, by Charging Type
        • 7.5.5.3. Africa
          • 7.5.5.3.1. Market size and forecast, by Vehicle Type
          • 7.5.5.3.2. Market size and forecast, by End User
          • 7.5.5.3.3. Market size and forecast, by Charging Type
  • CHAPTER 8: COMPETITIVE LANDSCAPE

    • 8.1. Introduction

    • 8.2. Top winning strategies

    • 8.3. Product Mapping of Top 10 Player

    • 8.4. Competitive Dashboard

    • 8.5. Competitive Heatmap

    • 8.6. Top player positioning, 2022

  • CHAPTER 9: COMPANY PROFILES

    • 9.1. ABB

      • 9.1.1. Company overview

      • 9.1.2. Key Executives

      • 9.1.3. Company snapshot

      • 9.1.4. Operating business segments

      • 9.1.5. Product portfolio

      • 9.1.6. Business performance

      • 9.1.7. Key strategic moves and developments

    • 9.2. Chargemaster

      • 9.2.1. Company overview

      • 9.2.2. Key Executives

      • 9.2.3. Company snapshot

      • 9.2.4. Operating business segments

      • 9.2.5. Product portfolio

      • 9.2.6. Business performance

      • 9.2.7. Key strategic moves and developments

    • 9.3. Chroma ATE Inc.

      • 9.3.1. Company overview

      • 9.3.2. Key Executives

      • 9.3.3. Company snapshot

      • 9.3.4. Operating business segments

      • 9.3.5. Product portfolio

      • 9.3.6. Business performance

      • 9.3.7. Key strategic moves and developments

    • 9.4. Delphi Technologies PLC

      • 9.4.1. Company overview

      • 9.4.2. Key Executives

      • 9.4.3. Company snapshot

      • 9.4.4. Operating business segments

      • 9.4.5. Product portfolio

      • 9.4.6. Business performance

    • 9.5. Pod Point

      • 9.5.1. Company overview

      • 9.5.2. Key Executives

      • 9.5.3. Company snapshot

      • 9.5.4. Operating business segments

      • 9.5.5. Product portfolio

      • 9.5.6. Business performance

    • 9.6. Robert Bosch GmbH.

      • 9.6.1. Company overview

      • 9.6.2. Key Executives

      • 9.6.3. Company snapshot

      • 9.6.4. Operating business segments

      • 9.6.5. Product portfolio

      • 9.6.6. Business performance

      • 9.6.7. Key strategic moves and developments

    • 9.7. Schaffner Holding AG.

      • 9.7.1. Company overview

      • 9.7.2. Key Executives

      • 9.7.3. Company snapshot

      • 9.7.4. Operating business segments

      • 9.7.5. Product portfolio

      • 9.7.6. Business performance

    • 9.8. Siemens

      • 9.8.1. Company overview

      • 9.8.2. Key Executives

      • 9.8.3. Company snapshot

      • 9.8.4. Operating business segments

      • 9.8.5. Product portfolio

      • 9.8.6. Business performance

      • 9.8.7. Key strategic moves and developments

    • 9.9. AeroVironment, Inc.

      • 9.9.1. Company overview

      • 9.9.2. Key Executives

      • 9.9.3. Company snapshot

      • 9.9.4. Operating business segments

      • 9.9.5. Product portfolio

      • 9.9.6. Business performance

    • 9.10. ChargePoint, Inc.

      • 9.10.1. Company overview

      • 9.10.2. Key Executives

      • 9.10.3. Company snapshot

      • 9.10.4. Operating business segments

      • 9.10.5. Product portfolio

      • 9.10.6. Business performance

      • 9.10.7. Key strategic moves and developments

  • LIST OF TABLES

  • TABLE 01. GLOBAL ELECTRIC VEHICLE CHARGER MARKET, BY VEHICLE TYPE, 2022-2032 ($MILLION)
    TABLE 02. ELECTRIC VEHICLE CHARGER MARKET FOR BATTERY ELECTRIC VEHICLE (BEV), BY REGION, 2022-2032 ($MILLION)
    TABLE 03. ELECTRIC VEHICLE CHARGER MARKET FOR PLUG-IN HYBRID ELECTRIC VEHICLE (PHEV), BY REGION, 2022-2032 ($MILLION)
    TABLE 04. ELECTRIC VEHICLE CHARGER MARKET FOR HYBRID ELECTRIC VEHICLE (HEV), BY REGION, 2022-2032 ($MILLION)
    TABLE 05. GLOBAL ELECTRIC VEHICLE CHARGER MARKET, BY END USER, 2022-2032 ($MILLION)
    TABLE 06. ELECTRIC VEHICLE CHARGER MARKET FOR RESIDENTIAL, BY REGION, 2022-2032 ($MILLION)
    TABLE 07. ELECTRIC VEHICLE CHARGER MARKET FOR COMMERCIAL, BY REGION, 2022-2032 ($MILLION)
    TABLE 08. GLOBAL ELECTRIC VEHICLE CHARGER MARKET, BY CHARGING TYPE, 2022-2032 ($MILLION)
    TABLE 09. ELECTRIC VEHICLE CHARGER MARKET FOR ON-BOARD CHARGERS, BY REGION, 2022-2032 ($MILLION)
    TABLE 10. ELECTRIC VEHICLE CHARGER MARKET FOR OFF-BOARD CHARGERS, BY REGION, 2022-2032 ($MILLION)
    TABLE 11. ELECTRIC VEHICLE CHARGER MARKET, BY REGION, 2022-2032 ($MILLION)
    TABLE 12. NORTH AMERICA ELECTRIC VEHICLE CHARGER MARKET, BY VEHICLE TYPE, 2022-2032 ($MILLION)
    TABLE 13. NORTH AMERICA ELECTRIC VEHICLE CHARGER MARKET, BY END USER, 2022-2032 ($MILLION)
    TABLE 14. NORTH AMERICA ELECTRIC VEHICLE CHARGER MARKET, BY CHARGING TYPE, 2022-2032 ($MILLION)
    TABLE 15. NORTH AMERICA ELECTRIC VEHICLE CHARGER MARKET, BY COUNTRY, 2022-2032 ($MILLION)
    TABLE 16. U.S. ELECTRIC VEHICLE CHARGER MARKET, BY VEHICLE TYPE, 2022-2032 ($MILLION)
    TABLE 17. U.S. ELECTRIC VEHICLE CHARGER MARKET, BY END USER, 2022-2032 ($MILLION)
    TABLE 18. U.S. ELECTRIC VEHICLE CHARGER MARKET, BY CHARGING TYPE, 2022-2032 ($MILLION)
    TABLE 19. CANADA ELECTRIC VEHICLE CHARGER MARKET, BY VEHICLE TYPE, 2022-2032 ($MILLION)
    TABLE 20. CANADA ELECTRIC VEHICLE CHARGER MARKET, BY END USER, 2022-2032 ($MILLION)
    TABLE 21. CANADA ELECTRIC VEHICLE CHARGER MARKET, BY CHARGING TYPE, 2022-2032 ($MILLION)
    TABLE 22. MEXICO ELECTRIC VEHICLE CHARGER MARKET, BY VEHICLE TYPE, 2022-2032 ($MILLION)
    TABLE 23. MEXICO ELECTRIC VEHICLE CHARGER MARKET, BY END USER, 2022-2032 ($MILLION)
    TABLE 24. MEXICO ELECTRIC VEHICLE CHARGER MARKET, BY CHARGING TYPE, 2022-2032 ($MILLION)
    TABLE 25. EUROPE ELECTRIC VEHICLE CHARGER MARKET, BY VEHICLE TYPE, 2022-2032 ($MILLION)
    TABLE 26. EUROPE ELECTRIC VEHICLE CHARGER MARKET, BY END USER, 2022-2032 ($MILLION)
    TABLE 27. EUROPE ELECTRIC VEHICLE CHARGER MARKET, BY CHARGING TYPE, 2022-2032 ($MILLION)
    TABLE 28. EUROPE ELECTRIC VEHICLE CHARGER MARKET, BY COUNTRY, 2022-2032 ($MILLION)
    TABLE 29. UK ELECTRIC VEHICLE CHARGER MARKET, BY VEHICLE TYPE, 2022-2032 ($MILLION)
    TABLE 30. UK ELECTRIC VEHICLE CHARGER MARKET, BY END USER, 2022-2032 ($MILLION)
    TABLE 31. UK ELECTRIC VEHICLE CHARGER MARKET, BY CHARGING TYPE, 2022-2032 ($MILLION)
    TABLE 32. GERMANY ELECTRIC VEHICLE CHARGER MARKET, BY VEHICLE TYPE, 2022-2032 ($MILLION)
    TABLE 33. GERMANY ELECTRIC VEHICLE CHARGER MARKET, BY END USER, 2022-2032 ($MILLION)
    TABLE 34. GERMANY ELECTRIC VEHICLE CHARGER MARKET, BY CHARGING TYPE, 2022-2032 ($MILLION)
    TABLE 35. FRANCE ELECTRIC VEHICLE CHARGER MARKET, BY VEHICLE TYPE, 2022-2032 ($MILLION)
    TABLE 36. FRANCE ELECTRIC VEHICLE CHARGER MARKET, BY END USER, 2022-2032 ($MILLION)
    TABLE 37. FRANCE ELECTRIC VEHICLE CHARGER MARKET, BY CHARGING TYPE, 2022-2032 ($MILLION)
    TABLE 38. NETHERLANDS ELECTRIC VEHICLE CHARGER MARKET, BY VEHICLE TYPE, 2022-2032 ($MILLION)
    TABLE 39. NETHERLANDS ELECTRIC VEHICLE CHARGER MARKET, BY END USER, 2022-2032 ($MILLION)
    TABLE 40. NETHERLANDS ELECTRIC VEHICLE CHARGER MARKET, BY CHARGING TYPE, 2022-2032 ($MILLION)
    TABLE 41. NORWAY ELECTRIC VEHICLE CHARGER MARKET, BY VEHICLE TYPE, 2022-2032 ($MILLION)
    TABLE 42. NORWAY ELECTRIC VEHICLE CHARGER MARKET, BY END USER, 2022-2032 ($MILLION)
    TABLE 43. NORWAY ELECTRIC VEHICLE CHARGER MARKET, BY CHARGING TYPE, 2022-2032 ($MILLION)
    TABLE 44. REST OF EUROPE ELECTRIC VEHICLE CHARGER MARKET, BY VEHICLE TYPE, 2022-2032 ($MILLION)
    TABLE 45. REST OF EUROPE ELECTRIC VEHICLE CHARGER MARKET, BY END USER, 2022-2032 ($MILLION)
    TABLE 46. REST OF EUROPE ELECTRIC VEHICLE CHARGER MARKET, BY CHARGING TYPE, 2022-2032 ($MILLION)
    TABLE 47. ASIA-PACIFIC ELECTRIC VEHICLE CHARGER MARKET, BY VEHICLE TYPE, 2022-2032 ($MILLION)
    TABLE 48. ASIA-PACIFIC ELECTRIC VEHICLE CHARGER MARKET, BY END USER, 2022-2032 ($MILLION)
    TABLE 49. ASIA-PACIFIC ELECTRIC VEHICLE CHARGER MARKET, BY CHARGING TYPE, 2022-2032 ($MILLION)
    TABLE 50. ASIA-PACIFIC ELECTRIC VEHICLE CHARGER MARKET, BY COUNTRY, 2022-2032 ($MILLION)
    TABLE 51. CHINA ELECTRIC VEHICLE CHARGER MARKET, BY VEHICLE TYPE, 2022-2032 ($MILLION)
    TABLE 52. CHINA ELECTRIC VEHICLE CHARGER MARKET, BY END USER, 2022-2032 ($MILLION)
    TABLE 53. CHINA ELECTRIC VEHICLE CHARGER MARKET, BY CHARGING TYPE, 2022-2032 ($MILLION)
    TABLE 54. JAPAN ELECTRIC VEHICLE CHARGER MARKET, BY VEHICLE TYPE, 2022-2032 ($MILLION)
    TABLE 55. JAPAN ELECTRIC VEHICLE CHARGER MARKET, BY END USER, 2022-2032 ($MILLION)
    TABLE 56. JAPAN ELECTRIC VEHICLE CHARGER MARKET, BY CHARGING TYPE, 2022-2032 ($MILLION)
    TABLE 57. INDIA ELECTRIC VEHICLE CHARGER MARKET, BY VEHICLE TYPE, 2022-2032 ($MILLION)
    TABLE 58. INDIA ELECTRIC VEHICLE CHARGER MARKET, BY END USER, 2022-2032 ($MILLION)
    TABLE 59. INDIA ELECTRIC VEHICLE CHARGER MARKET, BY CHARGING TYPE, 2022-2032 ($MILLION)
    TABLE 60. SOUTH KOREA ELECTRIC VEHICLE CHARGER MARKET, BY VEHICLE TYPE, 2022-2032 ($MILLION)
    TABLE 61. SOUTH KOREA ELECTRIC VEHICLE CHARGER MARKET, BY END USER, 2022-2032 ($MILLION)
    TABLE 62. SOUTH KOREA ELECTRIC VEHICLE CHARGER MARKET, BY CHARGING TYPE, 2022-2032 ($MILLION)
    TABLE 63. REST OF ASIA-PACIFIC ELECTRIC VEHICLE CHARGER MARKET, BY VEHICLE TYPE, 2022-2032 ($MILLION)
    TABLE 64. REST OF ASIA-PACIFIC ELECTRIC VEHICLE CHARGER MARKET, BY END USER, 2022-2032 ($MILLION)
    TABLE 65. REST OF ASIA-PACIFIC ELECTRIC VEHICLE CHARGER MARKET, BY CHARGING TYPE, 2022-2032 ($MILLION)
    TABLE 66. LAMEA ELECTRIC VEHICLE CHARGER MARKET, BY VEHICLE TYPE, 2022-2032 ($MILLION)
    TABLE 67. LAMEA ELECTRIC VEHICLE CHARGER MARKET, BY END USER, 2022-2032 ($MILLION)
    TABLE 68. LAMEA ELECTRIC VEHICLE CHARGER MARKET, BY CHARGING TYPE, 2022-2032 ($MILLION)
    TABLE 69. LAMEA ELECTRIC VEHICLE CHARGER MARKET, BY COUNTRY, 2022-2032 ($MILLION)
    TABLE 70. LATIN AMERICA ELECTRIC VEHICLE CHARGER MARKET, BY VEHICLE TYPE, 2022-2032 ($MILLION)
    TABLE 71. LATIN AMERICA ELECTRIC VEHICLE CHARGER MARKET, BY END USER, 2022-2032 ($MILLION)
    TABLE 72. LATIN AMERICA ELECTRIC VEHICLE CHARGER MARKET, BY CHARGING TYPE, 2022-2032 ($MILLION)
    TABLE 73. MIDDLE EAST ELECTRIC VEHICLE CHARGER MARKET, BY VEHICLE TYPE, 2022-2032 ($MILLION)
    TABLE 74. MIDDLE EAST ELECTRIC VEHICLE CHARGER MARKET, BY END USER, 2022-2032 ($MILLION)
    TABLE 75. MIDDLE EAST ELECTRIC VEHICLE CHARGER MARKET, BY CHARGING TYPE, 2022-2032 ($MILLION)
    TABLE 76. AFRICA ELECTRIC VEHICLE CHARGER MARKET, BY VEHICLE TYPE, 2022-2032 ($MILLION)
    TABLE 77. AFRICA ELECTRIC VEHICLE CHARGER MARKET, BY END USER, 2022-2032 ($MILLION)
    TABLE 78. AFRICA ELECTRIC VEHICLE CHARGER MARKET, BY CHARGING TYPE, 2022-2032 ($MILLION)
    TABLE 79. ABB: KEY EXECUTIVES
    TABLE 80. ABB: COMPANY SNAPSHOT
    TABLE 81. ABB: PRODUCT SEGMENTS
    TABLE 82. ABB: PRODUCT PORTFOLIO
    TABLE 83. ABB: KEY STRATERGIES
    TABLE 84. CHARGEMASTER: KEY EXECUTIVES
    TABLE 85. CHARGEMASTER: COMPANY SNAPSHOT
    TABLE 86. CHARGEMASTER: PRODUCT SEGMENTS
    TABLE 87. CHARGEMASTER: PRODUCT PORTFOLIO
    TABLE 88. CHARGEMASTER: KEY STRATERGIES
    TABLE 89. CHROMA ATE INC.: KEY EXECUTIVES
    TABLE 90. CHROMA ATE INC.: COMPANY SNAPSHOT
    TABLE 91. CHROMA ATE INC.: PRODUCT SEGMENTS
    TABLE 92. CHROMA ATE INC.: PRODUCT PORTFOLIO
    TABLE 93. CHROMA ATE INC.: KEY STRATERGIES
    TABLE 94. DELPHI TECHNOLOGIES PLC: KEY EXECUTIVES
    TABLE 95. DELPHI TECHNOLOGIES PLC: COMPANY SNAPSHOT
    TABLE 96. DELPHI TECHNOLOGIES PLC: SERVICE SEGMENTS
    TABLE 97. DELPHI TECHNOLOGIES PLC: PRODUCT PORTFOLIO
    TABLE 98. POD POINT: KEY EXECUTIVES
    TABLE 99. POD POINT: COMPANY SNAPSHOT
    TABLE 100. POD POINT: PRODUCT SEGMENTS
    TABLE 101. POD POINT: PRODUCT PORTFOLIO
    TABLE 102. ROBERT BOSCH GMBH.: KEY EXECUTIVES
    TABLE 103. ROBERT BOSCH GMBH.: COMPANY SNAPSHOT
    TABLE 104. ROBERT BOSCH GMBH.: PRODUCT SEGMENTS
    TABLE 105. ROBERT BOSCH GMBH.: PRODUCT PORTFOLIO
    TABLE 106. ROBERT BOSCH GMBH.: KEY STRATERGIES
    TABLE 107. SCHAFFNER HOLDING AG.: KEY EXECUTIVES
    TABLE 108. SCHAFFNER HOLDING AG.: COMPANY SNAPSHOT
    TABLE 109. SCHAFFNER HOLDING AG.: PRODUCT SEGMENTS
    TABLE 110. SCHAFFNER HOLDING AG.: PRODUCT PORTFOLIO
    TABLE 111. SIEMENS: KEY EXECUTIVES
    TABLE 112. SIEMENS: COMPANY SNAPSHOT
    TABLE 113. SIEMENS: PRODUCT SEGMENTS
    TABLE 114. SIEMENS: PRODUCT PORTFOLIO
    TABLE 115. SIEMENS: KEY STRATERGIES
    TABLE 116. AEROVIRONMENT, INC.: KEY EXECUTIVES
    TABLE 117. AEROVIRONMENT, INC.: COMPANY SNAPSHOT
    TABLE 118. AEROVIRONMENT, INC.: PRODUCT SEGMENTS
    TABLE 119. AEROVIRONMENT, INC.: PRODUCT PORTFOLIO
    TABLE 120. CHARGEPOINT, INC.: KEY EXECUTIVES
    TABLE 121. CHARGEPOINT, INC.: COMPANY SNAPSHOT
    TABLE 122. CHARGEPOINT, INC.: PRODUCT SEGMENTS
    TABLE 123. CHARGEPOINT, INC.: PRODUCT PORTFOLIO
    TABLE 124. CHARGEPOINT, INC.: KEY STRATERGIES
  • LIST OF FIGURES

  • FIGURE 01. ELECTRIC VEHICLE CHARGER MARKET, 2022-2032
    FIGURE 02. SEGMENTATION OF ELECTRIC VEHICLE CHARGER MARKET, 2022-2032
    FIGURE 03. TOP INVESTMENT POCKETS IN ELECTRIC VEHICLE CHARGER MARKET (2023-2032)
    FIGURE 04. LOW BARGAINING POWER OF SUPPLIERS
    FIGURE 05. LOW BARGAINING POWER OF BUYERS
    FIGURE 06. LOW THREAT OF SUBSTITUTES
    FIGURE 07. LOW THREAT OF NEW ENTRANTS
    FIGURE 08. LOW INTENSITY OF RIVALRY
    FIGURE 09. DRIVERS, RESTRAINTS AND OPPORTUNITIES: GLOBALELECTRIC VEHICLE CHARGER MARKET
    FIGURE 10. ELECTRIC VEHICLE CHARGER MARKET, BY VEHICLE TYPE, 2022(%)
    FIGURE 11. COMPARATIVE SHARE ANALYSIS OF ELECTRIC VEHICLE CHARGER MARKET FOR BATTERY ELECTRIC VEHICLE (BEV), BY COUNTRY 2022 AND 2032(%)
    FIGURE 12. COMPARATIVE SHARE ANALYSIS OF ELECTRIC VEHICLE CHARGER MARKET FOR PLUG-IN HYBRID ELECTRIC VEHICLE (PHEV), BY COUNTRY 2022 AND 2032(%)
    FIGURE 13. COMPARATIVE SHARE ANALYSIS OF ELECTRIC VEHICLE CHARGER MARKET FOR HYBRID ELECTRIC VEHICLE (HEV), BY COUNTRY 2022 AND 2032(%)
    FIGURE 14. ELECTRIC VEHICLE CHARGER MARKET, BY END USER, 2022(%)
    FIGURE 15. COMPARATIVE SHARE ANALYSIS OF ELECTRIC VEHICLE CHARGER MARKET FOR RESIDENTIAL, BY COUNTRY 2022 AND 2032(%)
    FIGURE 16. COMPARATIVE SHARE ANALYSIS OF ELECTRIC VEHICLE CHARGER MARKET FOR COMMERCIAL, BY COUNTRY 2022 AND 2032(%)
    FIGURE 17. ELECTRIC VEHICLE CHARGER MARKET, BY CHARGING TYPE, 2022(%)
    FIGURE 18. COMPARATIVE SHARE ANALYSIS OF ELECTRIC VEHICLE CHARGER MARKET FOR ON-BOARD CHARGERS, BY COUNTRY 2022 AND 2032(%)
    FIGURE 19. COMPARATIVE SHARE ANALYSIS OF ELECTRIC VEHICLE CHARGER MARKET FOR OFF-BOARD CHARGERS, BY COUNTRY 2022 AND 2032(%)
    FIGURE 20. ELECTRIC VEHICLE CHARGER MARKET BY REGION, 2022
    FIGURE 21. U.S. ELECTRIC VEHICLE CHARGER MARKET, 2022-2032 ($MILLION)
    FIGURE 22. CANADA ELECTRIC VEHICLE CHARGER MARKET, 2022-2032 ($MILLION)
    FIGURE 23. MEXICO ELECTRIC VEHICLE CHARGER MARKET, 2022-2032 ($MILLION)
    FIGURE 24. UK ELECTRIC VEHICLE CHARGER MARKET, 2022-2032 ($MILLION)
    FIGURE 25. GERMANY ELECTRIC VEHICLE CHARGER MARKET, 2022-2032 ($MILLION)
    FIGURE 26. FRANCE ELECTRIC VEHICLE CHARGER MARKET, 2022-2032 ($MILLION)
    FIGURE 27. NETHERLANDS ELECTRIC VEHICLE CHARGER MARKET, 2022-2032 ($MILLION)
    FIGURE 28. NORWAY ELECTRIC VEHICLE CHARGER MARKET, 2022-2032 ($MILLION)
    FIGURE 29. REST OF EUROPE ELECTRIC VEHICLE CHARGER MARKET, 2022-2032 ($MILLION)
    FIGURE 30. CHINA ELECTRIC VEHICLE CHARGER MARKET, 2022-2032 ($MILLION)
    FIGURE 31. JAPAN ELECTRIC VEHICLE CHARGER MARKET, 2022-2032 ($MILLION)
    FIGURE 32. INDIA ELECTRIC VEHICLE CHARGER MARKET, 2022-2032 ($MILLION)
    FIGURE 33. SOUTH KOREA ELECTRIC VEHICLE CHARGER MARKET, 2022-2032 ($MILLION)
    FIGURE 34. REST OF ASIA-PACIFIC ELECTRIC VEHICLE CHARGER MARKET, 2022-2032 ($MILLION)
    FIGURE 35. LATIN AMERICA ELECTRIC VEHICLE CHARGER MARKET, 2022-2032 ($MILLION)
    FIGURE 36. MIDDLE EAST ELECTRIC VEHICLE CHARGER MARKET, 2022-2032 ($MILLION)
    FIGURE 37. AFRICA ELECTRIC VEHICLE CHARGER MARKET, 2022-2032 ($MILLION)
    FIGURE 38. TOP WINNING STRATEGIES, BY YEAR
    FIGURE 39. TOP WINNING STRATEGIES, BY DEVELOPMENT
    FIGURE 40. TOP WINNING STRATEGIES, BY COMPANY
    FIGURE 41. PRODUCT MAPPING OF TOP 10 PLAYERS
    FIGURE 42. COMPETITIVE DASHBOARD
    FIGURE 43. COMPETITIVE HEATMAP: ELECTRIC VEHICLE CHARGER MARKET
    FIGURE 44. TOP PLAYER POSITIONING, 2022
    FIGURE 45. CHARGEMASTER: NET SALES, 2020-2022 ($MILLION)
    FIGURE 46. CHARGEMASTER: RESEARCH & DEVELOPMENT EXPENDITURE, 2020-2022 ($MILLION)
    FIGURE 47. CHARGEMASTER: REVENUE SHARE BY SEGMENT, 2022 (%)
    FIGURE 48. CHARGEMASTER: REVENUE SHARE BY REGION, 2022 (%)
    FIGURE 49. CHROMA ATE INC.: NET REVENUE, 2020-2022 ($MILLION)
    FIGURE 50. CHROMA ATE INC.: RESEARCH & DEVELOPMENT EXPENDITURE, 2020-2022 ($MILLION)
    FIGURE 51. CHROMA ATE INC.: REVENUE SHARE BY SEGMENT, 2022 (%)
    FIGURE 52. CHROMA ATE INC.: REVENUE SHARE BY REGION, 2022 (%)
    FIGURE 53. DELPHI TECHNOLOGIES PLC: RESEARCH & DEVELOPMENT EXPENDITURE, 2020-2022 ($MILLION)
    FIGURE 54. DELPHI TECHNOLOGIES PLC: NET REVENUE, 2020-2022 ($MILLION)
    FIGURE 55. DELPHI TECHNOLOGIES PLC: REVENUE SHARE BY SEGMENT, 2021 (%)
    FIGURE 56. DELPHI TECHNOLOGIES PLC: REVENUE SHARE BY REGION, 2021 (%)
    FIGURE 57. POD POINT: NET SALES, 2020-2022 ($MILLION)
    FIGURE 58. POD POINT: REVENUE SHARE BY SEGMENT, 2022 (%)
    FIGURE 59. POD POINT: REVENUE SHARE BY REGION, 2022 (%)
    FIGURE 60. ROBERT BOSCH GMBH.: NET REVENUE, 2020-2022 ($MILLION)
    FIGURE 61. ROBERT BOSCH GMBH.: RESEARCH & DEVELOPMENT EXPENDITURE, 2020-2022 ($MILLION)
    FIGURE 62. ROBERT BOSCH GMBH.: REVENUE SHARE BY SEGMENT, 2022 (%)
    FIGURE 63. ROBERT BOSCH GMBH.: REVENUE SHARE BY REGION, 2022 (%)
    FIGURE 64. SCHAFFNER HOLDING AG.: NET REVENUE, 2019-2021 ($MILLION)
    FIGURE 65. SCHAFFNER HOLDING AG.: RESEARCH & DEVELOPMENT EXPENDITURE, 2019-2021 ($MILLION)
    FIGURE 66. SCHAFFNER HOLDING AG.: REVENUE SHARE BY SEGMENT, 2021 (%)
    FIGURE 67. SCHAFFNER HOLDING AG.: REVENUE SHARE BY REGION, 2021 (%)
    FIGURE 68. SIEMENS: NET REVENUE, 2019-2021 ($MILLION)
    FIGURE 69. SIEMENS: RESEARCH & DEVELOPMENT EXPENDITURE, 2019-2021 ($MILLION)
    FIGURE 70. SIEMENS: REVENUE SHARE BY SEGMENT, 2021 (%)
    FIGURE 71. SIEMENS: REVENUE SHARE BY REGION, 2021 (%)
    FIGURE 72. AEROVIRONMENT, INC.: NET SALES, 2019-2021 ($MILLION)
    FIGURE 73. AEROVIRONMENT, INC.: RESEARCH & DEVELOPMENT EXPENDITURE, 2019-2021 ($MILLION)
    FIGURE 74. AEROVIRONMENT, INC.: REVENUE SHARE BY SEGMENT, 2021 (%)
    FIGURE 75. AEROVIRONMENT, INC.: REVENUE SHARE BY REGION, 2021 (%)
    FIGURE 76. CHARGEPOINT, INC.: NET REVENUE, 2020-2022 ($MILLION)
    FIGURE 77. CHARGEPOINT, INC.: RESEARCH & DEVELOPMENT EXPENDITURE, 2020-2022 ($MILLION)
    FIGURE 78. CHARGEPOINT, INC.: REVENUE SHARE BY SEGMENT, 2022 (%)
    FIGURE 79. CHARGEPOINT, INC.: REVENUE SHARE BY REGION, 2022 (%)


The global electric vehicle chargers market is expected to witness high growth rate due to government regulations regarding the use of electric vehicles to curb the environmental pollution and rise in demand for electric vehicles. However, high price of such electric vehicles and lack of presence EV chargers at public places impedes the market growth.

Electric vehicle chargers are used to provide charging to electric vehicle with a battery and the electrical source that helps charge the battery. At present, there are three different modes of charging-level 1, level 2 and DC fast charging-available in the market. Level 1 and Level 2 charging are the types of AC mode of charging which charge the vehicle at 120 volts and 240 volts, respectively. Such chargers can be installed at home or public places as per the individual’s requirements. Surge in demand for luxury and high-end electric vehicles drive the demand for EV chargers in the market. Further, stringent government regulations to curb carbon emission is expected to boost the market. By end user, the electric vehicle chargers market is divided into residential and commercial chargers. Further, based on charging type, the market is bifurcated into on-board and off-board chargers.

The plug-in hybrid electric vehicles in the electric vehicle chargers market has higher potential for growth in the global market. Hybrid electric vehicle dominated the global market presently and is expected to continue its dominance during the forecast period. By charging type, off-board chargers witnessed highest growth rate during the forecast period due to surge in disposable income of population across the world. While, residential chargers observed highest growth rate based on end user owing to stringent government regulations to curb environment pollutions.

ABB Ltd., Robert Bosch GmbH, Siemens AG, Delphi Automotive, Chroma ATE, Aerovironment Inc., Silicon Laboratories, Chargemaster PLC, Schaffner Holdings AG, POD Point are key market players that occupy a significant revenue share in the electric vehicle chargers market.

PURCHASE OPTIONS

Call or Email us

U.S.-Canada Toll-free: +1-800-792-5285
Int'l : +1-503-894-6022
Europe : +44-845-528-1300
Email : help@alliedmarketresearch.com
 
FREQUENTLY ASKED QUESTIONS?

A. The estimated industry size of electric vehicle charger is $7.12 billion in 2022.

A. The top companies to hold the market share in electric vehicle charger are Chargemaster, Chroma ATE Inc, Delphi Technologies, Robert Bosch GmbH, AeroVironment, Inc., Schaffner Holding AG, Pod Point, ABB, Siemens, and ChargePoint, Inc.

A. The largest regional market for electric vehicle charger is Asia-Pacific

A. Residential is the leading charging type of electric vehicle charger market.

A. The upcoming trends electric vehicle charger market in the world are demand for luxurious & feature-enabled vehicles, and wireless charging for electric vehicles.

Looking for Customization?

 Customization Request

Have a Question?

 Speak with Analyst

Any Confusion?

 Inquire Before Buying

Have a glance of the Report

  Request Sample
RELATED TAGS

Purchase Full Report of
Electric Vehicle Charger Market

Start reading instantly.
This Report and over 67,068+ more Reports, Available with Avenue Library. T&C*.

  • Online Only
  • $3,570
  • Online cloud access only
  • Restricted print, copy, paste & download
  • Read only
  • Free industry update
    (Within 180 days)
  • Free report update in next update cycle
    (May 2024 - May 2025)
  • Data Pack
  • $3,840
  • Restricted to one authorized user
  • One print only
  • Available in
    Excel
  • Free industry update
    (Within 180 days)
  •   Free report update in next update cycle
    (May 2024 - May 2025)
  • Single User
  • $5,730
  • Restricted to one authorized user
  • One print only
  • Available in
    PDF
  • Free industry update
    (Within 180 days)
  •   Free report update in next update cycle
    (May 2024 - May 2025)
  • Five Users
  • $6,450
  • Limited to five authorized users
  • Print upto five copies
  • Available in
    PDF
  • Free industry update
    (Within 180 days)
  •   Free report update in next update cycle
    (May 2024 - May 2025)
  • Enterprise
    License/PDF

  • $9,600
  • Unlimited
    within
    company/enterprise
  • Available in Excel & PDF
  • Free industry update
    (Within 180 days)
  •   Free report update in next update cycle
    (May 2024 - May 2025)
  • Library
    Membership

  • $999 $ 1,175
    Per User/ Per month/ Billed annually
  • Published Content
    E-access
  • Company Profiles
    E-access
  • Newly Added Content Access
  • 10 PDF
    Downloads
  • 5 Excel Data
    Pack Downloads
  • 250 Company Profiles PDF Downloads
  • Buy Now

*Taxes/Fees, if applicable will be added during checkout. All prices in USD

RELATED REPORTS
 

Why Allied Market Research?


Infallible Methodology

To ensure high-level data integrity, accurate analysis, and impeccable forecasts

Analyst Support

For complete satisfaction

Customization

On-demand customization of scope of the report to exactly meet your needs

TARGETED MARKET VIEW

Targeted market view to provide pertinent information and save time of readers

Get fresh content delivered

Get insights on topics that are crucial for your business. Stay abreast of your interest areas.

Get Industry Data Alerts

Why Allied Market Research?

Infallible Methodology

To ensure high-level data integrity, accurate analysis, and impeccable forecasts

Analyst Support

For complete satisfaction

Customization

On-demand customization of scope of the report to exactly meet your needs

TARGETED MARKET VIEW

Targeted market view to provide pertinent information and save time of readers