
Electric Vehicle (EV) On Board Charger Market Insights, 2027
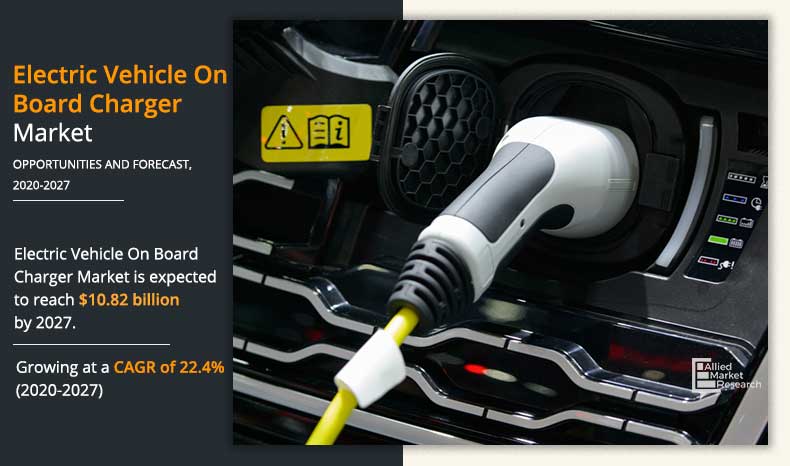
The electric vehicle on board charger market size was valued at USD 2.15 billion in 2019, and is projected to reach USD 10.82 billion by 2027, registering a CAGR of 22.4% from 2020 to 2027.
The market is driven by increase in penetration of electric vehicles and increase in government initiatives for development of electric vehicle charging infrastructure and its related components. However, lack of standardization of EV charging and increase in installation of fast DC chargers restrains the growth of the market. Furthermore, development of a two-way on-board charger (V2G) for future electric and plug-in hybrid vehicle provides lucrative growth opportunities for the players operating in the electric vehicle on board charger market.
By vehicle type, the electric passenger car segment was the highest revenue contributor in 2019, accounting for $1.43 billion, and is estimated to reach $6.47 billion by 2027, registering a CAGR of 20.7% during the forecast period. In 2019, Asia-Pacific was anticipated to account for major EV on board charger market share.
By Vehicle Type
Electric Buses segment is projected as the most lucrative segments
An on-board charger (OBC) is used in an electric vehicle (EV), hybrid electric vehicle (HEV) or in plug-in hybrid vehicles to charge the traction battery. The on-board charger system equipped in electric vehicle that converts the AC input from the grid to a DC input, which further charges the battery. The electronic components used in on-board charger (OBC) provides the means to recharge the battery from the AC mains either at home or from outlets found in private or public charging stations.
Companies such as AVID Technology limited, use onboard battery charger technology that is highly efficient because of its art power switching technology & highly optimized magnetics. Moreover, it is also controlled via an isolated CAN bus connection, which is compatible with SAE J1939 and ISO11898.
The on-board charger in electric vehicles consists of the unit that includes variety of signal conditioning solutions, integrated high voltage isolation AC-DC converters, AC rectifiers, dual bridgeless power factor correction (PFC), gate drivers, error amplifiers and many other power electronic components. The electric vehicle on-board charger market trends are decided on the basis of forecast from 2020 to 2027.
By Power Output
10kW to 20kW segment is projected as the most lucrative segments
The presence of on board and charging standards adopted by different countries are considered under this scope. Globally, on-board charging is generally guided by IEC 61851 standards (IEC 61851-1, IEC 61851-21, IEC 61851-22) that specify the general requirements and functionality of conductive charging equipment. In the U.S., IEC-61981 developed charging standards are implemented that provides on board electric power equipment for electric road vehicles. Moreover, IEC 62196 standards define charging modes and connector requirements and different types such as IEC 62196-1 and 62196-2 are used to pertain to on-board or AC charging systems. South Korea has established on-board charging regulations based on these IEC standards (KS C IEC 61851-1, KS C IEC 61851-22).
By Propulsion Type
BEV segment is projected as the most lucrative segments
The European Countries generally adhere to the definitions contained in these IEC standards on a voluntary basis (European Mennekes connector). And also the same is followed by the U.S. and Canada (Yazaki connector / SAE J1772), and Japan (CHAdeMO connector / SAE J1772). Many countries from North America, APAC and Europe are stringently following the emission standards or charging capabilities to meet on board charger EMC requirements for conductive connection to ac/dc supply. In addition, In California, ZEVs and PHEVs must meet the requirements of SAE 1772 (AC connection) in order to qualify for ZEV credits. China has in place voluntary standards relating to on-board charging. These include Chinese National Standards (GB/T 20234.1 2011, GT/T 20234.2-2011) and an Automotive Industry Standard (QC/T 895 2011).
Europe is expected to be the fastest growing regional market for electric vehicle on board charger. Increase in investment in R&D activities related to electric vehicles, increase in demand for electric vehicle across the region is contribute to the electric vehicle on board charger market growth during the forecast period. Europe’s automobiles, including cars, vans, trucks, and buses are manufactured with less CO2 and GHG levels, as a result of which these are considered to be the safest, tidiest, and quietest in the world.
By Region
Europe by region is projected as the most lucrative segments
In addition, implementation of stringent government regulations to curb environmental pollution is projected to boost the demand for charger needed for charging the electric vehicles in the European region. In addition, Germany, the UK, and France witnessed the highest penetration of EV chargers, due to a combination of economies of scale, high level of income, and being automotive manufacturing hubs along with the technological developments & driving the demand for Hybrid Electric Vehicle (HEV)s. Thus, all these factors significantly contributed toward the growth of the on board electric vehicle chargers market in Europe.
Key Developments:
- In April 2019, Bel Power Solutions announced the BCN25-700-8, a 25 kW on-board battery charger that converts 3-phase AC voltage to DC voltage which specially designed to charge the Hybrid or Full Electric Vehicles in Mining or Industrial Environments.
- In January 2020, Innolectric AG has completed the development of its 22kW on-board charger with silicon carbide technology. The new chargers, developed in partnership with STMicroelectronics, are using highly efficient silicon carbide power modules so the efficiency is above 94% and peaks at 96% in the 2-10 kW range. This will benefits customers from one-stop system solution for AC and DC charging with maximum efficiency. Moreover, this AC and DC charging options is available for electrified vehicles, commercial vehicles and machines.
- In July 2019, BYD Company Ltd. (BYD) and Toyota Motor Corporation (Toyota) announced their agreement for the joint development of battery electric vehicles (BEVs). The two parties will jointly develop sedans and low-floor SUVs as well as the onboard batteries for these vehicles and others with the aim to launch them in the Chinese market under the Toyota brand in the first half of the 2020s.
The electric vehicle on board charger market is segmented on the basis of power output, propulsion type, vehicle type, and region. Less than 10 kW, 10 kW to 20 kW and more than 20 kW are studied under the power output segment. Battery Electric Vehicle (BEV), Hybrid Electric Vehicle (HEV), and plug in hybrid electric vehicles (PHEV) are categorized under propulsion type. Electric passenger cars, electric buses, electric vans, electric medium duty vehicles, electric heavy duty vehicles, electric agriculture tractors, electric construction equipment, electric mining vehicle, and electric & hybrid boats ships are studied under the vehicle type segment. By region, the electric vehicle on board charger market is analyzed across North America, Europe, Asia-Pacific, and LAMEA.
Key players operating in the EV on board charger market are BRUSA Elektronik AG, Bel Power solution, Current Ways Inc., Toyota Industries Corporation, Innoelectric GmbH, Eaton, Stercom Power Solutions GmbH, Xepics Italia SRL, Delphi Technologies, AVID Technology Limited, Infineon Technologies AG, STMICROELECTRONICS, Hangzhou Aodi Electronic Control Co., Ltd. and Ficosa Internacional SA.
Increase in penetration of electric vehicles
Gasoline being a fossil fuel is not a renewable source of energy, and is expected to exhaust in the future. To support sustainable development, it is important to develop and use alternative sources of fuel. This involves the use of electric vehicles, which do not use gas and are more economical as compared to conventional vehicles. EVs offer multiple advantages such as reduced fuel (petrol, diesel, and gas) consumption and decreased emissions from tailpipes, which significantly boost their demand across the globe. This in turn is expected to escalate the need for on board charger equipped with electric or plug-in hybrid vehicles during the forecast period. In addition, key players operating in the on board charger required for electric vehicle are adopting various strategic moves such as product development and collaboration, to tap the business potential. For instance, Swiss auto component maker BRUSA Elektronik has upgraded their onboard fast charger (NLG664) performance. This charger charges a typical EV battery in less than one hour using 3-phase AC current of up to 22 kW, and also offers the option to charge at up to 7 kW from a single-phase AC outlet. In addition, this on board charger is equipped in Volvo C30 Electric Generation II, Smart Fortwo, Electric Truck E-FORCE and SUNCAR’s first electric excavator.
Furthermore, the leading companies such as BYD Company Ltd. (BYD) and Toyota Motor Corporation (Toyota) announced their agreement for the joint development of battery electric vehicles (BEVs). The two parties will jointly develop sedans and low-floor SUVs as well as the onboard batteries for these vehicles and others with the aim to launch them in the Chinese market under the Toyota brand in the first half of 2020. In addition, the demand for fuel-efficient vehicles has increased recently, owing to rise in price of petrol and diesel. Thus, these factors boost the need for advanced fuel-efficient technologies, leading to surge in demand for electrically powered vehicles, which, in turn, propels the demand for on board chargers for electric vehicle.
Increase in government initiatives for development of electric vehicle charging infrastructure and related components
The electric vehicle charging infrastructure is vital for the mass adoption of electric vehicles. Several government initiatives have been undertaken to provide EV charging stations across the world. For instance, Automotive Research Association of India (ARAI) planned to deploy more than 200 EV charging stations across the country. In addition, Tata Power, an Indian electric utility company, which is a part of the Tata Group (India), supports the Indian Government's National Electric Mobility Mission, wherein the Tata Power established the first set of electric vehicle charging stations in Mumbai (India) for India’s growing EV ecosystem. Furthermore, China is stepping up their efforts to maintain its leaderships in ev adoption race by planning to invest $1.42 billion to expand the country’s charging network by 50% this year to stimulate EV deployment. In addition, increase in number of level 1 & level 2 charging station/infrastructure (AC-to-DC) has propelled the rise in demand for electric vehicles. This, in turn, is expected to drive the growth of the on board charger equipped with them.
Increased installation of DC fast chargers
Raw materials to manufacture tires include petroleum reinforcing materials such as nylon and polyester. Also, rubber (natural and synthetic) is the basic element required to manufacture tires, which witnesses high fluctuations in cost. The materials used to manufacture rubber tires are tread, jointless cap plies, steel-cord for belt plies, textile cord ply, Bead reinforcement, apex, and core. Also, it consists of synthetic rubber, natural rubber, steel wire, and carbon black along with the petrochemical reinforcing materials such as polyester, fabric, nylon, steel, and rayon. The pricing of these raw materials plays a vital role in deciding the overall price of the tire. Prices of these metals fluctuate occasionally due to global economic ups and downs in the EV on board charger market, as these are traded on a community exchange basis. Inflation and increase in the demand for these raw materials fuel their prices in the recent past. In addition, players that operate in the market require a large amount of raw materials to overcome the demand for tire from the automotive industry. Uncertainty in the pricing of these raw materials prove to be a major restraint for the growth of the rubber tire market globally.
Lack of standardization of EV charging
The electric vehicles battery source does not have any alternative source for charging. The shortage of charging points in most of the cities is a major challenging factor for growth of the global on board electric vehicle charger market. Furthermore, thin and inconsistent infrastructure, and range anxiety can create a problem for electric vehicle and can put the traveler at risk. Moreover, the implementations of supportive infrastructure required for electric vehicle in developing countries are less. Charging such vehicles in rural areas is a bigger issue where many people don’t have a dedicated parking spot, which makes it difficult to charge an electric car at home.
Furthermore, as the technology is not matured enough, apart from China, the sales of the electric cars as well as electric commercial vehicles are extremely less as compared to the Internal Combustion Engine (ICE) vehicle sale. In addition, although Tesla, an American electric vehicle and clean energy company based in Palo Alto, California, is expanding its network of chargers, they are designed specifically for Tesla vehicles. The automotive industry has standardized 120- and 240-volt plugs, which are primarily used in homes but have not yet set a standard on the plugs or ports that can charge vehicles in 30 minutes or less. Thus, all these factors coupled with the different prices at charging stations altogether are responsible for hindering the growth of the global on board EV charger market.
Development of a two-way on-board charger (V2G) for future electric and plug-in hybrid vehicle
Currently, majority of the EVs are designed with on-board unidirectional batteries charging systems. Besides the on-board batteries charging systems, some vehicles allow the charge of their batteries with off-board chargers. The recent and massive investments in Electric Vehicles (EVs) reveal a change of paradigm in the transports sector. The concept of Grid-to-Vehicle (G2V) is the simplest process of integration of the EVs batteries charging system with the power grid, which will require energy to charge their batteries. Moreover, the innovation of V2G operation that only requires the use of battery chargers for the EVs with bidirectional power flow capability and bidirectional communication with the Smart Grids. Also, multiple companies have started taking an active step toward such two way charging technology.
For instance, Hyundai Mobis has announced the development of a two-way on-board charger (V2G) for future electric and plug-in hybrid vehicles that will be first installed by Hyundai Mobis model in Korea with verified safety performance. Thus, development of such innovation relating to battery charging technology will create lucrative opportunities for the EV on board charger market expansion during the forecast period.
COVID-19 Impact Analysis
- The COVID impact on the electric vehicle onboard charger market is unpredictable and it is expected to remain in force till the second quarter of 2021.
- The COVID-19 outbreak has forced the governments across the globe to focus on medical services. Owing to this, the countries are directing most of their capital in the healthcare sector, which is affecting the investments and incentives that are provided by the government for the electric vehicle sector.
- Moreover, the nationwide lockdown forced the manufacturing facilities of the electric vehicles to decrease the full operations of the facilities.
- The adverse impacts of the COVID-19 pandemic have resulted in the delays in the activities and initiatives regarding the development of electric vehicle onboard charger.
Key Benefits For Stakeholders
- This study presents analytical depiction of the electric vehicle on board charger market analysis along with the current trends and future estimations to depict the imminent investment pockets.
- The overall electric vehicle on board charger market potential is determined to understand the profitable trends to gain a stronger foothold.
- The report presents information related to key drivers, restraints, and opportunities of the market with a detailed impact analysis.
- The current electric vehicle on board charger market size is quantitatively analyzed from 2019 to 2027 to benchmark the financial competency.
- Porter’s five forces analysis illustrates the potency of the buyers and suppliers in the EV on board charger industry.
Electric Vehicle On Board Charger Market Report Highlights
| Aspects | Details |
| By Power Output |
|
| By Vehicle Type |
|
| By Propulsion Type |
|
| By Vehicle Type and Power Output |
|
| By Region |
|
Analyst Review
Electric vehicle on-board charger is a device that alters AC power from charging station to DC power to charge a 350V or 650V battery in the vehicle. The on-board charger is designed with a low charging rate, and is dedicated to charge the battery for a long period of time (typically 5–8 h for full charge). Asia-Pacific has shown a prominent growth in the electric vehicle on board charger market owing to increased population and rise in sales in the region. The development of a two-way on-board charger (V2G) for future electric and plug-in hybrid vehicles, increase in per capita income and surge in sale of electric vehicles are the factors expected to boost the market growth globally.
The global electric vehicle on board charger market is analyzed on the basis of its prospect and future growth rate. The report highlights numerous factors that influence the growth of the global electric vehicle on board charger market, which include market forecast, drivers, restraints, opportunities, and role of different key players operating in the market.
The electric vehicle on board charger market is driven by increase in penetration of electric vehicles and increase in government initiatives for development of electric vehicle charging infrastructure and its related components. However, lack of standardization of EV charging and increase in installation of fast DC chargers restrains the growth of the market. Furthermore, development of a two-way on-board charger (V2G) for future electric and plug-in hybrid vehicle provides lucrative growth opportunities for the players operating in the electric vehicle on board charger market.
Among the analyzed regions, Asia-Pacific is the highest revenue contributor, and the Europe region is anticipated to dominate the growth during the forecast period, followed by North America, and LAMEA. This growth is attributed to proactive development, rise in disposable income, and expected electric vehicle sales.
The Bel Power Solutions announced the BCN25-700-8, a 25 kW on-board battery charger that converts 3-phase AC voltage to DC voltage which specially designed to charge the Hybrid or Full Electric Vehicles in Mining or Industrial Environments .
global electric vehicle on board charger market was valued at $2.15 billion in 2019, and is projected to reach $10.82 billion by 2027, registering a CAGR of 22.4% from 2020 to 2027.
The report sample/ company profile section for EV on board charger market report can be obtained on demand from the website.
The current business scenario is witnessing an increase in the demand for yacht charter, particularly in the developing regions, such as China, India, and others. Such countries are potential customers for market expansion.
Some of the key players in the EV on board charger market are BRUSA Elektronik AG, Bel Power solution, Current Ways Inc., Toyota Industries Corporation, Innoelectric GmbH, Eaton, Stercom Power Solutions GmbH, Xepics Italia SRL, Delphi Technologies, AVID Technology Limited, Infineon Technologies AG, STMICROELECTRONICS, Hangzhou Aodi Electronic Control Co., Ltd. and Ficosa Internacional SA.
The company profile section for EV on boarad charger market report can be obtained on demand from the website.
Among the analyzed geographical regions, currently Asia-Pacific is dominating the market with the highest revenue in the global market. However, Europe is expected to grow at a higher rate during the forcast period, predicting lucrative opportunities .
The companies profiled in the report along with the AC-DC converter, inverter, EV battery manufacturers are the servie providers of EV on board charger industry.
The key growth strategies adopted by theEV on board charger players includes innovations, merger, product launch, investent, joint venture, partnership and business developments with the increased RnD expenditure.
The AC on board charger installation cost from the OEM ranges from $150-$240 per kW of the power output capacity of the different electric vehicles.
China is one of the largest component supplier for electric vehicles components to the global electric vehicle manufacturing ecosystem. Thus, Disrupted supply chains owing to lockdown and trade tension between the countries is anticipated to negatively impact the electric vehicle on board charger market.
Loading Table Of Content...

