
Electric Wheelchair Market Research, 2033
Market Introduction and Definition
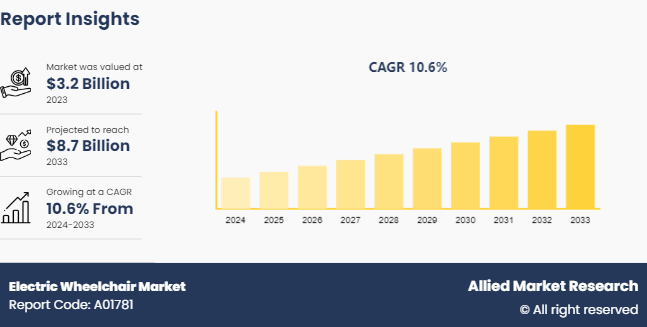
The global electric wheelchair market was valued at $3.2 billion in 2023, and is projected to reach $8.7 billion by 2033, growing at a CAGR of 10.6% from 2024 to 2033. The electric wheelchair market encompasses a range of mobility devices designed to assist individuals with mobility impairments in achieving greater independence and accessibility. Electric wheelchairs are powered by batteries and equipped with electric motors, allowing users to navigate various terrains with minimal physical effort. These devices are crucial for people with disabilities, the elderly, and those with medical conditions that limit their ability to walk or use manual wheelchairs. The market has seen significant advancements, including the integration of advanced technologies such as powered seating, joystick controls, and smart features such as AI and IoT. These innovations enhance the user experience by offering personalized settings, safety features, and connectivity with healthcare providers. The electric wheelchair market is driven by factors such as an aging population, increasing awareness of disability rights, and technological advancements. It is a vital component of the broader assistive technology and healthcare markets, aimed at improving the quality of life for users worldwide.
Key Takeaways
The electric wheelchair market study covers 20 countries. The research includes a segment analysis of each country in terms of value for the projected period.
More than 1, 500 product literatures, industry releases, annual reports, and other such documents of major electric wheelchair industry participants along with authentic industry journals, trade associations' releases, and government websites have been reviewed for generating high-value industry insights.
The study integrated high-quality data, professional opinions & analysis, and critical independent perspectives. The research approach is intended to provide a balanced view of global markets and to assist stakeholders in making educated decisions to achieve their most ambitious growth objectives.
Key Market Dynamics
The global aging population significantly boosts the demand for electric wheelchairs, as more elderly individuals require mobility aid due to age-related conditions such as arthritis, osteoporosis, and reduced muscle strength. As healthcare systems emphasize quality of life and independence for older adults, electric wheelchairs become essential tools for enhancing mobility and autonomy. This demographic trend is particularly prominent in developed countries with aging societies, leading to increased healthcare expenditure and a growing market for advanced mobility solutions such as electric wheelchairs. The rising electric wheelchair market demand from older adults, coupled with longer life expectancies, drives manufacturers to innovate and expand their product offerings, catering to a more significant portion of the population that seeks comfortable and reliable mobility aids. For instance, around 15% of the world’s population, or an estimated 1 billion people, live with disabilities. They are the world’s largest minority. (WHO)
However, the high costs associated with advanced electric wheelchairs act as a significant restraint on electric wheelchair market share. These devices, equipped with sophisticated technologies such as powered seating, advanced suspension systems, and enhanced control features, often come with a hefty price tag. The expense can be prohibitive for many potential users, particularly in regions where healthcare coverage for mobility aids is limited or absent. This financial barrier is exacerbated by the need for ongoing maintenance and potential upgrades, further increasing the lifetime cost of ownership. As a result, despite the growing awareness and need for such devices, the high initial investment required limits accessibility, especially among low-income populations and in developing countries. Manufacturers and healthcare providers are challenged to find cost-effective solutions to make electric wheelchairs more accessible to a broader consumer base.
Moreover, the integration of Artificial Intelligence (AI) and the Internet of Things (IoT) in electric wheelchairs presents significant growth electric wheelchair market size. These smart wheelchairs offer advanced features such as autonomous navigation, obstacle detection, health monitoring, and connectivity with other devices and systems. AI enables personalized user experiences by adapting to individual needs and preferences, while IoT facilitates seamless communication with healthcare providers and caregivers, enhancing user safety and convenience. This technological evolution not only improves the functionality and user experience but also opens new avenues for data analytics, preventive healthcare, and smart home integration. As a result, electric wheelchair market growth, particularly among tech-savvy users and healthcare facilities aiming to enhance patient care and operational efficiency. This trend is expected to drive innovation and expand the market in the coming years.
PESTLE overview
Political: Government policies on healthcare funding, disability rights, and import/export regulations significantly impact the electric wheelchair market. Regulatory approvals and standards for medical devices also play a crucial role in market dynamics.
Economic: Economic conditions, including disposable income levels, healthcare expenditure, and insurance coverage, influence the affordability and demand for electric wheelchairs. Economic downturns can reduce consumer spending on non-essential healthcare products.
Social: Social factors, such as aging populations and increased awareness of mobility issues, drive demand for electric wheelchairs. Changing attitudes towards disability and accessibility also encourages market growth.
Technological: Advances in battery technology, materials science, and smart technologies such as AI and IoT are transforming electric wheelchairs, making them more efficient, user-friendly, and integrated with broader healthcare systems.
Legal: Legal considerations include compliance with medical device regulations, patents, and intellectual property rights. Laws regarding accessibility and disability rights also influence market dynamics.
Environmental: Environmental concerns focus on the sustainability of materials used in wheelchairs and the impact of battery disposal. Manufacturers are increasingly considering eco-friendly designs and recyclable materials.
Value Chain of the Electric Wheelchair Market
Research and Development (R&D) : This stage involves designing and engineering electric wheelchairs, focusing on innovation in technology, ergonomics, and materials. Companies invest in R&D to develop advanced features such as AI integration, improved battery systems, and enhanced user interfaces.
Component Manufacturing: This includes the production of essential components such as motors, batteries, frames, wheels, and control systems. This stage often involves multiple suppliers and can be geographically diverse, depending on the availability of raw materials and technological capabilities.
Assembly and Production: At this stage, components are assembled into finished products. This process includes quality control checks to ensure the safety and reliability of electric wheelchairs. Some companies may also offer customization options at this stage.
Distribution and Logistics: Once assembled, electric wheelchairs are distributed to various channels including wholesalers, retailers, and directly to consumers. This stage involves logistics and supply chain management to ensure timely delivery and inventory management.
Sales and Marketing: This stage involves promoting the products through various channels such as medical supply stores, online platforms, healthcare providers, and direct sales. Marketing efforts focus on highlighting the features and benefits of electric wheelchairs, targeting both end-users and healthcare professionals.
After-Sales Service and Support: Providing customer support, maintenance, and repair services is crucial for ensuring long-term user satisfaction. This includes warranty services, replacement parts, and technical support.
Top 10 Countries with the Largest Number of Older Adults
Rank
Country
65+ (In Millions)
% 65+ (of total population)
Total Population (In Millions)
1
China
166.37
11.9
1398.03
2
India
84.9
6.1
1391.89
3
United States
52.76
16
329.15
4
Japan
35.58
28.2
126.18
5
Russian Federation
21.42
14.6
146.73
6
Brazil
17.79
8.5
209.33
7
Germany
17.78
21.4
83.1
8
Indonesia
15.16
5.6
268.42
9
Italy
13.76
22.8
60.34
10
France
13.16
20.3
64.83
Rank | Country | 65+ (In Millions) | % 65+ (of total population) | Total Population (In Millions) |
1 | China | 166.37 | 11.9 | 1398.03 |
2 | India | 84.9 | 6.1 | 1391.89 |
3 | United States | 52.76 | 16 | 329.15 |
4 | Japan | 35.58 | 28.2 | 126.18 |
5 | Russian Federation | 21.42 | 14.6 | 146.73 |
6 | Brazil | 17.79 | 8.5 | 209.33 |
7 | Germany | 17.78 | 21.4 | 83.1 |
8 | Indonesia | 15.16 | 5.6 | 268.42 |
9 | Italy | 13.76 | 22.8 | 60.34 |
10 | France | 13.16 | 20.3 | 64.83 |
The aging populations in China, India, and the U.S. present a significant opportunity for the electric wheelchair market. China, with its massive population of 1.398 billion and rapidly aging demographic due to past population policies, is expected to see a surge in demand for mobility aids. India, though currently younger, has 1.392 billion people and is projected to witness a substantial increase in its elderly population in the coming years. The U.S., with 329.15 million people and a large baby boomer generation entering retirement, already has a growing market for electric wheelchairs. As these top three populous countries continue to age, the electric wheelchair industry stands to benefit from increased demand, potentially driving innovation in design, technology, and affordability to meet the diverse needs of older adults across these vast markets.
Market Segmentation
The electric wheelchair market is segmented into type, end user, and region. On the basis of type, the market is divided into center wheel drive, front wheel drive, rear wheel drive, standing electric wheelchair, others. As per end user, the market is bifurcated into personal and hospital. Region wise, the market is analyzed across North America, Europe, Asia-Pacific, and LAMEA.
Regional/Country Market Outlook
The Asia-Pacific region is experiencing the highest growth and market share in the electric wheelchair industry owing to a combination of demographic, economic, and technological factors. The region is home to a rapidly aging population, particularly in countries such as Japan, China, and South Korea, which drives demand for mobility aids. In addition, the rising prevalence of disabilities and chronic conditions necessitates accessible and advanced mobility solutions. Economic growth in the region has led to increased disposable income, allowing more individuals to afford electric wheelchairs. Governments and healthcare systems are also investing more in healthcare infrastructure and accessibility, further supporting market expansion with electric wheelchair market forecast. Moreover, the region's robust manufacturing capabilities, especially in China, contribute to lower production costs and increased availability of electric wheelchairs. Technological advancements and the adoption of smart technologies in healthcare are also propelling the market, making Asia-Pacific a hub for innovation in mobility solutions. This confluence of factors positions the Asia-Pacific region as a key player in the global electric wheelchair market.
Industry Trends
Aging Population and Increased Demand: The aging global population significantly impacts the electric wheelchair market, driving demand for mobility solutions. According to the United Nations, the population aged 60 and over is expected to more than double by 2050, reaching approximately 2.1 billion. This demographic shift is increasing the number of potential users who require assistive mobility devices.
Increased Accessibility and User Adoption: Improvements in design, affordability, and availability have made electric wheelchairs more accessible. Efforts by governments and organizations to promote disability rights and accessibility have also contributed to a rise in adoption rates. It is estimated that around 1-2% of the world's population currently uses a wheelchair, with electric wheelchairs becoming increasingly popular among users who seek greater independence and ease of use.
Production and Regional Growth: North America and Europe are leading regions in the production and usage of electric wheelchairs, driven by well-established healthcare systems and supportive government policies. The U.S., for instance, is a significant producer and consumer, with several major manufacturers based there. In contrast, emerging markets in Asia and Latin America are experiencing rapid growth due to increasing healthcare investments and rising awareness.
Competitive Landscape
The major players operating in the electric wheelchair market include Invacare Corporation, Sunrise Medical Limited, Permobil AB, OttoBock Healthcare, Pride Mobility Products Corp., Meyra Group, Nissin Medical Industries Co., Karma Medical Products Co. Ltd., Matsunaga Manufactory Co., Ltd., Miki Kogyosho Co., Ltd.
Recent Key Strategies and Developments
In February 2022, Invacare Corporation introduced its next-generation e-fix eco Power Assist Device, which converts manual wheelchairs into electric wheelchairs.
In August 2021?Invacare Corporation introduced the Invacare AVIVA STORM RX power wheelchair, which provided rear-wheel drive power mobility. This newly launched product has superior technology, design, and performance.
In June 2024, Ottobock launched advanced power wheelchair Juvo B7, to support users with complex needs. This launch is expected to improve the company’s competitiveness in the market and enable them to have a greater customer base.
Key Benefits For Stakeholders
This report provides a quantitative analysis of the market segments, current trends, estimations, and dynamics of the electric wheelchair market analysis from 2024 to 2033 to identify the prevailing electric wheelchair market opportunities.
The market research is offered along with information related to key drivers, restraints, and opportunities.
Porter's five forces analysis highlights the potency of buyers and suppliers to enable stakeholders make profit-oriented business decisions and strengthen their supplier-buyer network.
In-depth analysis of the electric wheelchair market segmentation assists to determine the prevailing market opportunities.
Major countries in each region are mapped according to their revenue contribution to the global market.
Market player positioning facilitates benchmarking and provides a clear understanding of the present position of the market players.
The report includes the analysis of the regional as well as global electric wheelchair market trends, key players, market segments, application areas, and market growth strategies.
Electric Wheelchair Market Report Highlights
| Aspects | Details |
| Market Size By 2033 | USD 8.7 Billion |
| Growth Rate | CAGR of 10.6% |
| Forecast period | 2024 - 2033 |
| Report Pages | 170 |
| By Type |
|
| By End-User |
|
| By Region |
|
| Key Market Players | Miki Kogyosho Co., Ltd, Matsunaga Manufactory Co., Ltd, Karma Medical Products Co. Ltd, Nissin Medical Industries Co., Permobil AB, OttoBock Healthcare, Meyra Group, Invacare Corporation., Pride Mobility Products Corp., Sunrise Medical Limited |
Analyst Review
Spinal disorders, such as spondylolisthesis and spinal stenosis, and obesity problems constitute a major proportion of health issues globally. According to the Institute for Health Metrics and Evaluation, about 30% of the global population were either obese or overweight in 2013. Such people have limited mobility and in severe cases may need to use electric wheelchairs to carry out their day-to-day activities. In addition, the increase in geriatric population and incidence of accidents is expected to fuel the adoption of power wheelchairs.
Electric wheelchairs are used for patient movement from one place to another without causing any muscular strain to the patient and to the supporting healthcare workers. The demand for electric wheelchairs is expected to increase globally during the forecast period, owing to the increased standards, demand for automated wheelchairs, and favorable regulations.
Asia-Pacific possesses high market potential for investments in electric wheelchairs market, owing to the presence of high population base, rise in awareness about the benefits of power wheelchairs, and increase in disposable incomes. This region is the fastest growing market for these equipment, due to growth in bariatric & geriatric patients in China, Japan, India, and others.
Automation of manual wheelchairs, increased comfort levels, and improved multiple functionalities in the equipment are anticipated to offer lucrative growth opportunities for market expansion.
A primary trend is the increasing integration of advanced technologies, such as artificial intelligence and smart connectivity features, enhancing user experience and mobility. Additionally, the market is witnessing a rise in demand for lightweight and portable designs, making electric wheelchairs more accessible for users.
The leading application of the electric wheelchair market is in home care settings, where they provide essential mobility solutions for the elderly and individuals with disabilities.
Asia-Pacific is the largest regional market for Electric Wheelchair.
The global electric wheelchair market was valued at $3.2 billion in 2023, and is projected to reach $8.7 billion by 2033, growing at a CAGR of 10.6% from 2024 to 2033.
Invacare Corporation, Sunrise Medical Limited, Permobil AB are the top companies to hold the market share in Electric Wheelchair.
Loading Table Of Content...

