Report Code: A04856 | Mar 2019 | Pages: 242 | ||
Tables: 80 | Charts: 79 |
|
Pandemic disrupted the entire world and affected many industries.
Get detailed COVID-19 impact analysis on the Emission Control Technology Market
Request Now !
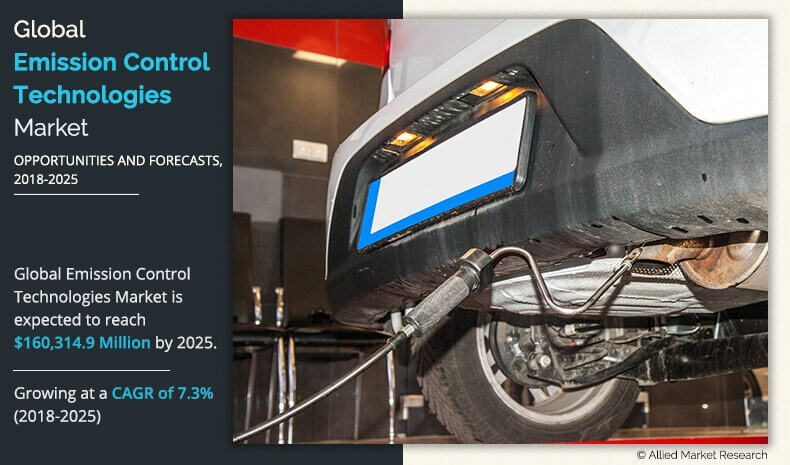
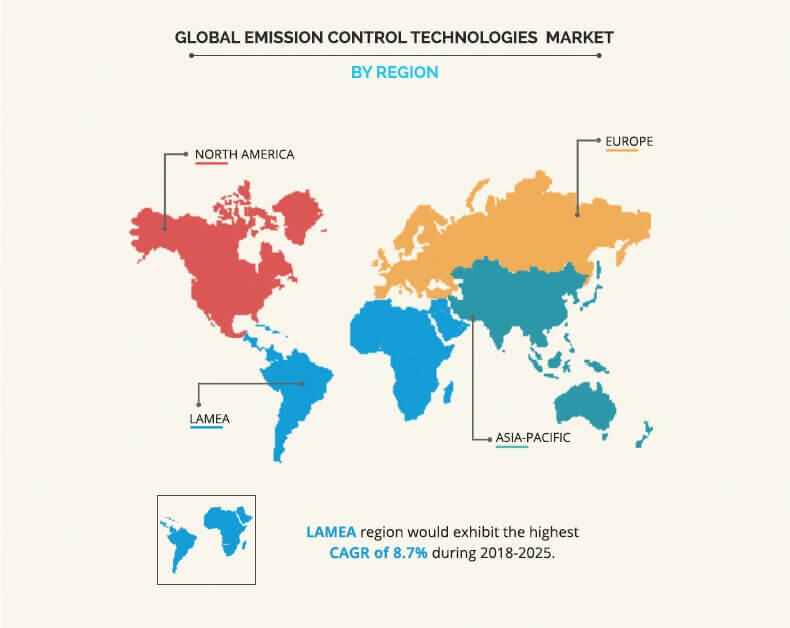
The global emission control technology market size was valued at $91,540 million in 2017 and is projected to reach $160,314.9 million by 2025, registering a CAGR of 7.3% from 2018 to 2025. In 2017, Asia-Pacific accounted for the highest emission control technology market share.
Emission control technologies are installed to reduce the emission of harmful pollutants such as unburned hydrocarbons, carbon monoxide, oxides of nitrogen, and others. Technologies such as diesel particulate filter (DPF), gasoline particulate filter (GPF), diesel oxidation catalyst (DOC), selective catalytic reduction (SCR), exhaust gas recirculation (EGR), and others are installed to control the emission of pollutants in the ecosystems. Government of various countries are setting up strict regulations to meet the emission standard and to achieve clean air goals. Diesel particulate filters and gasoline particulate filters are used to capture the particulate matter in the filter and control their emission in the atmospheres. Whereas, selective catalytic reduction and exhaust gas recirculation are used to reduce emission of nitrogen oxides. In addition, diesel oxidation catalyst is used to the release of harmful carbon compounds in ecosystems.
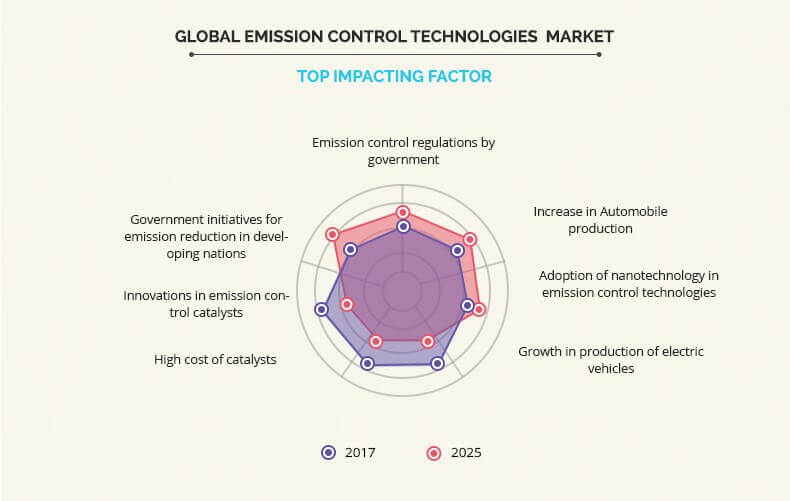
Moreover emission control regulations by government and increase in automobile production drive the growth of market. In addition, adoption of nanotechnology in catalytic converters is anticipated to propel the growth of the emission control technology market. However, growth in production of electric vehicles and high cost of emission control technology is expected to hinder the growth of the market. Furthermore, innovations in emission control catalysts and government initiatives for emission reduction in developing nations holds a remarkable growth opportunity for the players operating in the emission control technology market.
The emission control technology market report is segmented based on technology, fuel type, end-user vertical, and region. Technology is categorized as diesel particulate filter (DPF), gasoline particulate filter (GPF), diesel oxidation catalyst (DOC), selective catalytic reduction (SCR), exhaust gas recirculation (EGR), and others. Fuel type is divided into diesel and gasoline. End-user vertical is classified as automotive, marine, off-highway, rolling stock, and industrial. Based on region, the market is analyzed across North America, Europe, Asia-Pacific, and LAMEA.
The key players operating in the Emission control technology market include BASF, Clean Diesel Technologies, Inc., Clariant, Cormetech, Corning Incorporated, DCL International Inc., Johnson Matthey, Tenneco Inc., Umicore, Walker Exhaust Systems, and others.
Emission Control Regulations By Government
Government has established stringent regulation for pollutant gas emission from the vehicles because of combustion of fuels such as diesel fuel, fuel oil, petrol, gasoline, biodiesel, and others. Euro 6 is a latest emission regulation by European union directive to reduce harmful gases such as carbon monoxide(CO), nitrogen oxide(NOx), hydrocarbons, and others from exhaust system of the vehicle. Similarly, emission control technology is used in catalyst converters, an emission control device used to convert toxic and harmful gases from engines into less-toxic pollutant and help to meet the government emission standards. This fuels the growth of the emission control technology market.
Increase In Automobile Production
Developing nations witness a rise in demand and production of automobile. For instance, India became the fourth largest automobile industry in the world with the increase in sales of 9.5% year-on-year to 4.2 million units. This rise in automobile production in the developing nations automatically leads to increased production in demand for emission control technology for emission control devices in automobile exhaust systems. Therefore, increase in automobile production is anticipated to boost the growth of the emission control technology market.
Growth In Production Of Electric Vehicles
In recent years, demand and production of electric vehicles has increased significantly as electric vehicles have several advantages over fuel-powered automobiles. Components such as fan belts, oil, air filters, head caskets, timing belts, cylinder heads, and spark plugs do not require replacement, which in return makes it cheaper and efficient for fuel-powered automobiles. This makes electric vehicle a preferred choice, which in return restraints the fuel-powered automobile markets. Thus, growth in production of electric vehicles hinders the growth of the emission control technology market.
Innovations In Emission Control Technology
Key players of the emission control technology market are investing in improvement and development of emission control technologies. A three-way catalyst can reduce the emitted pollutant from vehicle at 100% conversion efficiency at its operational temperature, typically above 400C, which is much higher. Johnson Matthey Inc., a leading emission control technology producer is working on the development of three-way catalyst for future vehicle, which improves fuel efficiency and reduce CO2 emission substantially at lower operating temperature. This innovation in emission control technology is anticipated to provide future growth opportunity to the emission control technology market.
Key Benefits For Emission Control Technology Market:
Emission Control Technology Market Report Highlights
Aspects | Details |
---|---|
By Fuel Type |
|
By End User Vertical |
|
By Region |
|
By Technology |
|
Key Market Players | Umicore, Tenneco Inc., Clariant, BASF SE, Johnson Matthey, DCL International Inc., Clean Diesel Technologies, Inc, Corning Incorporated, AeriNox, CORMETECH |
CHAPTER 1: INTRODUCTION
1.1. Report description
1.2. Key benefits for stakeholders
1.3. Key market segments
1.4. Research methodology
1.4.1. Primary research
1.4.2. Secondary research
1.4.3. Analyst tools and models
CHAPTER 2: EXECUTIVE SUMMARY
2.1. End-user roadmap
2.2. CXO perspective
CHAPTER 3: MARKET OVERVIEW
3.1. Market definition and scope
3.2. Key findings
3.2.1. Top impacting factors
3.2.2. Top investment pockets
3.2.3. Top winning strategies
3.3. Porters five forces analysis
3.4. Market share analysis (2017)
3.5. Market dynamics
3.5.1. Drivers
3.5.1.1. Emission control regulations by government
3.5.1.2. Increase in Automobile production
3.5.1.3. Adoption of nanotechnology in emission control technologies
3.5.2. Restraint
3.5.2.1. Growth in production of electric vehicles
3.5.2.2. High cost of catalysts
3.5.3. Opportunities
3.5.3.1. Innovations in emission control catalysts
3.5.3.2. Government initiatives for emission reduction in developing nations
CHAPTER 4: EMISSION CONTROL TECHNOLOGY MARKET, BY TECHNOLOGY
4.1. Overview
4.2. Diesel Oxidation Catalyst (DOC)
4.2.1. Key market trends, growth factors and opportunities
4.2.2. Market size and forecast, by region
4.2.3. Market analysis by country
4.3. Diesel Particulate Filter (DPF)
4.3.1. Key market trends, growth factors, and opportunities
4.3.2. Market size and forecast, by region
4.3.3. Market analysis by country
4.4. Selective Catalytic Reduction (SCR)
4.4.1. Key market trends, growth factors, and opportunities
4.4.2. Market size and forecast, by region
4.4.3. Market analysis by country
4.5. Exhaust Gas Recirculation (EGR)
4.5.1. Key market trends, growth factors, and opportunities
4.5.2. Market size and forecast, by region
4.5.3. Market analysis by country
4.6. Gasoline Particulate Filter (GPF)
4.6.1. Key market trends, growth factors, and opportunities
4.6.2. Market size and forecast, by region
4.6.3. Market analysis by country
4.7. Others
4.7.1. Key market trends, growth factors, and opportunities
4.7.2. Market size and forecast, by region
4.7.3. Market analysis by country
CHAPTER 5: EMISSION CONTROL TECHNOLOGY MARKET, BY FUEL TYPE
5.1. Overview
5.2. Gasoline
5.2.1. Key market trends, growth factors and opportunities
5.2.2. Market size and forecast, by region
5.2.3. Market analysis by country
5.3. Diesel
5.3.1. Key market trends, growth factors, and opportunities
5.3.2. Market size and forecast, by region
5.3.3. Market analysis by country
CHAPTER 6: EMISSION CONTROL TECHNOLOGY MARKET, BY END-USER VERTICAL
6.1. Overview
6.2. Automotive
6.2.1. Key market trends, growth factors and opportunities
6.2.2. Market size and forecast, by region
6.2.3. Market analysis by country
6.3. Marine
6.3.1. Key market trends, growth factors and opportunities
6.3.2. Market size and forecast, by region
6.3.3. Market analysis by country
6.4. Aerospace
6.4.1. Key market trends, growth factors and opportunities
6.4.2. Market size and forecast, by region
6.4.3. Market analysis by country
6.5. Off-highway
6.5.1. Key market trends, growth factors and opportunities
6.5.2. Market size and forecast, by region
6.5.3. Market analysis by country
6.6. Rolling stock
6.6.1. Key market trends, growth factors and opportunities
6.6.2. Market size and forecast, by region
6.6.3. Market analysis by country
6.6.4. Market analysis by country
CHAPTER 7: EMISSION CONTROL TECHNOLOGY MARKET, BY REGION
7.1. Overview
7.2. North America
7.2.1. Key market trends, growth factors, and opportunities
7.2.2. Market size and forecast, by Technology
7.2.3. Market size and forecast, by Fuel Type
7.2.4. Market size and forecast, by technology
7.2.5. Market size and forecast, by End-user vertical
7.2.6. Market analysis by country
7.2.6.1. U.S.
7.2.6.1.1. Market size and forecast, by Technology
7.2.6.1.2. Market size and forecast, by Fuel Type
7.2.6.1.3. Market size and forecast, by technology
7.2.6.1.4. Market size and forecast, by End-user vertical
7.2.6.2. Canada
7.2.6.2.1. Market size and forecast, by Technology
7.2.6.2.2. Market size and forecast, by Fuel Type
7.2.6.2.3. Market size and forecast, by technology
7.2.6.2.4. Market size and forecast, by End-user vertical
7.2.6.3. Mexico
7.2.6.3.1. Market size and forecast, by Technology
7.2.6.3.2. Market size and forecast, by Fuel Type
7.2.6.3.3. Market size and forecast, by technology
7.2.6.3.4. Market size and forecast, by End-user vertical
7.3. Europe
7.3.1. Key market trends, growth factors, and opportunities
7.3.2. Market size and forecast, by Technology
7.3.3. Market size and forecast, by Fuel Type
7.3.4. Market size and forecast, by technology
7.3.5. Market size and forecast, by End-user vertical
7.3.6. Market analysis by country
7.3.6.1. U.K.
7.3.6.1.1. Market size and forecast, by Technology
7.3.6.1.2. Market size and forecast, by Fuel Type
7.3.6.1.3. Market size and forecast, by technology
7.3.6.1.4. Market size and forecast, by End-user vertical
7.3.6.2. Germany
7.3.6.2.1. Market size and forecast, by Technology
7.3.6.2.2. Market size and forecast, by Fuel Type
7.3.6.2.3. Market size and forecast, by technology
7.3.6.2.4. Market size and forecast, by End-user vertical
7.3.6.3. France
7.3.6.3.1. Market size and forecast, by Technology
7.3.6.3.2. Market size and forecast, by Fuel Type
7.3.6.3.3. Market size and forecast, by technology
7.3.6.3.4. Market size and forecast, by End-user vertical
7.3.6.4. Russia
7.3.6.4.1. Market size and forecast, by Technology
7.3.6.4.2. Market size and forecast, by Fuel Type
7.3.6.4.3. Market size and forecast, by technology
7.3.6.4.4. Market size and forecast, by End-user vertical
7.3.6.5. Rest of Europe
7.3.6.5.1. Market size and forecast, by Technology
7.3.6.5.2. Market size and forecast, by Fuel Type
7.3.6.5.3. Market size and forecast, by technology
7.3.6.5.4. Market size and forecast, by End-user vertical
7.4. Asia-Pacific
7.4.1. Key market trends, growth factors, and opportunities
7.4.2. Market size and forecast, by Technology
7.4.3. Market size and forecast, by Fuel Type
7.4.4. Market size and forecast, by technology
7.4.5. Market size and forecast, by End-user vertical
7.4.6. Market analysis by country
7.4.6.1. China
7.4.6.1.1. Market size and forecast, by Technology
7.4.6.1.2. Market size and forecast, by Fuel Type
7.4.6.1.3. Market size and forecast, by technology
7.4.6.1.4. Market size and forecast, by End-user vertical
7.4.6.2. Japan
7.4.6.2.1. Market size and forecast, by Technology
7.4.6.2.2. Market size and forecast, by Fuel Type
7.4.6.2.3. Market size and forecast, by technology
7.4.6.2.4. Market size and forecast, by End-user vertical
7.4.6.3. India
7.4.6.3.1. Market size and forecast, by Technology
7.4.6.3.2. Market size and forecast, by Fuel Type
7.4.6.3.3. Market size and forecast, by technology
7.4.6.3.4. Market size and forecast, by End-user vertical
7.4.6.4. Australia
7.4.6.4.1. Market size and forecast, by Technology
7.4.6.4.2. Market size and forecast, by Fuel Type
7.4.6.4.3. Market size and forecast, by technology
7.4.6.4.4. Market size and forecast, by End-user vertical
7.4.6.5. Rest of Asia-Pacific
7.4.6.5.1. Market size and forecast, by Technology
7.4.6.5.2. Market size and forecast, by Fuel Type
7.4.6.5.3. Market size and forecast, by technology
7.4.6.5.4. Market size and forecast, by End-user vertical
7.5. LAMEA
7.5.1. Key market trends, growth factors, and opportunities
7.5.2. Market size and forecast, by Technology
7.5.3. Market size and forecast, by Fuel Type
7.5.4. Market size and forecast, by technology
7.5.5. Market size and forecast, by End-user vertical
7.5.6. Market analysis by country
7.5.6.1. Latin America
7.5.6.1.1. Market size and forecast, by Technology
7.5.6.1.2. Market size and forecast, by Fuel Type
7.5.6.1.3. Market size and forecast, by technology
7.5.6.1.4. Market size and forecast, by End-user vertical
7.5.6.2. Middle East
7.5.6.2.1. Market size and forecast, by Technology
7.5.6.2.2. Market size and forecast, by Fuel Type
7.5.6.2.3. Market size and forecast, by technology
7.5.6.2.4. Market size and forecast, by End-user vertical
7.5.6.3. Africa
7.5.6.3.1. Market size and forecast, by Technology
7.5.6.3.2. Market size and forecast, by Fuel Type
7.5.6.3.3. Market size and forecast, by technology
7.5.6.3.4. Market size and forecast, by End-user vertical
CHAPTER 8: COMPANY PROFILES
8.1. AeriNox
8.1.1. Company overview
8.1.2. Company snapshot
8.1.3. Operating business segments
8.1.4. Product portfolio
8.1.5. Business performance
8.1.6. Key strategic moves and developments
8.2. BASF SE
8.2.1. Company overview
8.2.2. Company snapshot
8.2.3. Operating business segments
8.2.4. Product portfolio
8.2.5. Business performance
8.2.6. Key strategic moves and developments
8.3. Clean Diesel Technologies, Inc.
8.3.1. Company overview
8.3.2. Company snapshot
8.3.3. Operating business segments
8.3.4. Product portfolio
8.3.5. Business performance
8.3.6. Key strategic moves and developments
8.4. Clariant
8.4.1. Company overview
8.4.2. Company snapshot
8.4.3. Operating business segments
8.4.4. Product portfolio
8.4.5. Business performance
8.4.6. Key strategic moves and developments
8.5. CORMETECH
8.5.1. Company overview
8.5.2. Company snapshot
8.5.3. Operating business segments
8.5.4. Product portfolio
8.5.5. Business performance
8.5.6. Key strategic moves and developments
8.6. Corning Incorporated
8.6.1. Company overview
8.6.2. Company snapshot
8.6.3. Operating business segments
8.6.4. Product portfolio
8.6.5. Business performance
8.6.6. Key strategic moves and developments
8.7. DCL International Inc.
8.7.1. Company overview
8.7.2. Company snapshot
8.7.3. Product portfolio
8.8. Johnson Matthey
8.8.1. Company overview
8.8.2. Company snapshot
8.8.3. Operating business segments
8.8.4. Product portfolio
8.8.5. Business performance
8.8.6. Key strategic moves and developments
8.9. Tenneco Inc.
8.9.1. Company overview
8.9.2. Company snapshot
8.9.3. Operating business segments
8.9.4. Product portfolio
8.9.5. Business performance
8.9.6. Key strategic moves and developments
8.10. Umicore
8.10.1. Company overview
8.10.2. Company snapshot
8.10.3. Operating business segments
8.10.4. Product portfolio
8.10.5. Business performance
8.10.6. Key strategic moves and developments
LIST OF TABLES
TABLE 01. GLOBAL EMISSION CONTROL TECHNOLOGY MARKET, BY TECHNOLOGY, 2017-2025($MILLION)
TABLE 02. EMISSION CONTROL TECHNOLOGY MARKET REVENUE FOR DIESEL OXIDATION CATALYST (DOC), BY REGION 2017-2025 ($MILLION)
TABLE 03. EMISSION CONTROL TECHNOLOGY MARKET REVENUE FOR DIESEL PARTICULATE FILTER (DPF), BY REGION 2017-2025 ($MILLION)
TABLE 04. EMISSION CONTROL TECHNOLOGY MARKET REVENUE FOR SELECTIVE CATALYTIC REDUCTION (SCR), BY REGION 20172025 ($MILLION)
TABLE 05. EMISSION CONTROL TECHNOLOGY MARKET REVENUE FOR EXHAUST GAS RECIRCULATION (EGR), BY REGION 20172025 ($MILLION)
TABLE 06. EMISSION CONTROL TECHNOLOGY MARKET REVENUE FOR GASOLINE PARTICULATE FILTER (GPF), BY REGION 20172025 ($MILLION)
TABLE 07. EMISSION CONTROL TECHNOLOGY MARKET REVENUE FOR OTHERS, BY REGION 20172025 ($MILLION)
TABLE 08. GLOBAL EMISSION CONTROL TECHNOLOGY MARKET, BY FUEL TYPE, 2017-2025($MILLION)
TABLE 09. EMISSION CONTROL TECHNOLOGY MARKET REVENUE FOR GASOLINE, BY REGION 2017-2025 ($MILLION)
TABLE 10. EMISSION CONTROL TECHNOLOGY MARKET REVENUE FOR NLP, BY REGION 2017-2025 ($MILLION)
TABLE 11. GLOBAL EMISSION CONTROL TECHNOLOGY MARKET, BY INDUTRY VERTICAL, 20172025 ($MILLION)
TABLE 12. EMISSION CONTROL TECHNOLOGY MARKET REVENUE FOR AUTOMOTIVE, BY REGION, 20172025 ($MILLION)
TABLE 13. EMISSION CONTROL TECHNOLOGY MARKET REVENUE FOR MARINE, BY REGION 2017-2025 ($MILLION)
TABLE 14. EMISSION CONTROL TECHNOLOGY MARKET REVENUE FOR AEROSPACE, BY REGION, 20172025 ($MILLION)
TABLE 15. EMISSION CONTROL TECHNOLOGY MARKET REVENUE FOR OFF-HIGHWAY, BY REGION, 20172025 ($MILLION)
TABLE 16. EMISSION CONTROL TECHNOLOGY MARKET REVENUE FOR ROLLINGSTOCK, BY REGION 20172025 ($MILLION)
TABLE 17. NORTH AMERICAN EMISSION CONTROL TECHNOLOGY MARKET, BY TECHNOLOGY, 20172025 ($MILLION)
TABLE 18. NORTH AMERICAN EMISSION CONTROL TECHNOLOGY MARKET, BY FUEL TYPE, 20172025 ($MILLION)
TABLE 19. NORTH AMERICAN EMISSION CONTROL TECHNOLOGY MARKET, BY TECHNOLOGY, 20172025 ($MILLION)
TABLE 20. NORTH AMERICAN EMISSION CONTROL TECHNOLOGY MARKET, BY END-USER VERTICAL, 20172025 ($MILLION)
TABLE 21. U. S. EMISSION CONTROL TECHNOLOGY MARKET, BY TECHNOLOGY, 20172025 ($MILLION)
TABLE 22. U. S. EMISSION CONTROL TECHNOLOGY MARKET, BY FUEL TYPE, 20172025 ($MILLION)
TABLE 23. U. S. EMISSION CONTROL TECHNOLOGY MARKET, BY TECHNOLOGY, 20172025 ($MILLION)
TABLE 24. U.S. EMISSION CONTROL TECHNOLOGY MARKET, BY END-USER VERTICAL, 20172025 ($MILLION)
TABLE 25. CANADA EMISSION CONTROL TECHNOLOGY MARKET, BY TECHNOLOGY, 20172025 ($MILLION)
TABLE 26. CANADA EMISSION CONTROL TECHNOLOGY MARKET, BY FUEL TYPE, 20172025 ($MILLION)
TABLE 27. CANADA EMISSION CONTROL TECHNOLOGY MARKET, BY TECHNOLOGY, 20172025 ($MILLION)
TABLE 28. CANADA EMISSION CONTROL TECHNOLOGY MARKET, BY END-USER VERTICAL, 20172025 ($MILLION)
TABLE 29. MEXICO EMISSION CONTROL TECHNOLOGY MARKET, BY TECHNOLOGY, 20172025 ($MILLION)
TABLE 30. MEXICO EMISSION CONTROL TECHNOLOGY MARKET, BY FUEL TYPE, 20172025 ($MILLION)
TABLE 31. MEXICO EMISSION CONTROL TECHNOLOGY MARKET, BY TECHNOLOGY, 20172025 ($MILLION)
TABLE 32. MEXICO EMISSION CONTROL TECHNOLOGY MARKET, BY END-USER VERTICAL, 20172025 ($MILLION)
TABLE 33. EUROPEAN EMISSION CONTROL TECHNOLOGY MARKET, BY TECHNOLOGY, 20172025 ($MILLION)
TABLE 34. EUROPEAN EMISSION CONTROL TECHNOLOGY MARKET, BY FUEL TYPE, 20172025 ($MILLION)
TABLE 35. EUROPEAN EMISSION CONTROL TECHNOLOGY MARKET, BY TECHNOLOGY, 20172025 ($MILLION)
TABLE 36. EUROPEAN EMISSION CONTROL TECHNOLOGY MARKET, BY END-USER VERTICAL, 20172025 ($MILLION)
TABLE 37. U.K. EMISSION CONTROL TECHNOLOGY MARKET, BY TECHNOLOGY, 20172025 ($MILLION)
TABLE 38. U.K. EMISSION CONTROL TECHNOLOGY MARKET, BY FUEL TYPE, 20172025 ($MILLION)
TABLE 39. U.K. EMISSION CONTROL TECHNOLOGY MARKET, BY TECHNOLOGY, 20172025 ($MILLION)
TABLE 40. U.K. EMISSION CONTROL TECHNOLOGY MARKET, BY END-USER VERTICAL, 20172025 ($MILLION)
TABLE 41. GERMANY EMISSION CONTROL TECHNOLOGY MARKET, BY TECHNOLOGY, 20172025 ($MILLION)
TABLE 42. GERMANY EMISSION CONTROL TECHNOLOGY MARKET, BY FUEL TYPE, 20172025 ($MILLION)
TABLE 43. GERMANY EMISSION CONTROL TECHNOLOGY MARKET, BY TECHNOLOGY, 20172025 ($MILLION)
TABLE 44. GERMANY EMISSION CONTROL TECHNOLOGY MARKET, BY END-USER VERTICAL, 20172025 ($MILLION)
TABLE 45. FRANCE EMISSION CONTROL TECHNOLOGY MARKET, BY TECHNOLOGY, 20172025 ($MILLION)
TABLE 46. FRANCE EMISSION CONTROL TECHNOLOGY MARKET, BY FUEL TYPE, 20172025 ($MILLION)
TABLE 47. FRANCE EMISSION CONTROL TECHNOLOGY MARKET, BY TECHNOLOGY, 20172025 ($MILLION)
TABLE 48. FRANCE EMISSION CONTROL TECHNOLOGY MARKET, BY END-USER VERTICAL, 20172025 ($MILLION)
TABLE 49. RUSSIA EMISSION CONTROL TECHNOLOGY MARKET, BY TECHNOLOGY, 20172025 ($MILLION)
TABLE 50. RUSSIA EMISSION CONTROL TECHNOLOGY MARKET, BY FUEL TYPE, 20172025 ($MILLION)
TABLE 51. RUSSIA EMISSION CONTROL TECHNOLOGY MARKET, BY TECHNOLOGY, 20172025 ($MILLION)
TABLE 52. RUSSIA EMISSION CONTROL TECHNOLOGY MARKET, BY END-USER VERTICAL, 20172025 ($MILLION)
TABLE 53. REST OF EUROPE EMISSION CONTROL TECHNOLOGY MARKET, BY TECHNOLOGY, 20172025 ($MILLION)
TABLE 54. REST OF EUROPE EMISSION CONTROL TECHNOLOGY MARKET, BY FUEL TYPE, 20172025 ($MILLION)
TABLE 55. REST OF EUROPE EMISSION CONTROL TECHNOLOGY MARKET, BY TECHNOLOGY, 20172025 ($MILLION)
TABLE 56. REST OF EUROPE EMISSION CONTROL TECHNOLOGY MARKET, BY END-USER VERTICAL, 20172025 ($MILLION)
TABLE 57. ASIA-PACIFIC EMISSION CONTROL TECHNOLOGY MARKET, BY TECHNOLOGY, 20172025 ($MILLION)
TABLE 58. ASIA-PACIFIC EMISSION CONTROL TECHNOLOGY MARKET, BY FUEL TYPE, 20172025 ($MILLION)
TABLE 59. ASIA-PACIFIC EMISSION CONTROL TECHNOLOGY MARKET, BY TECHNOLOGY, 20172025 ($MILLION)
TABLE 60. ASIA-PACIFIC EMISSION CONTROL TECHNOLOGY MARKET, BY END-USER VERTICAL, 20172025 ($MILLION)
TABLE 61. CHINA EMISSION CONTROL TECHNOLOGY MARKET, BY TECHNOLOGY, 20172025 ($MILLION)
TABLE 62. CHINA EMISSION CONTROL TECHNOLOGY MARKET, BY FUEL TYPE, 20172025 ($MILLION)
TABLE 63. CHINA EMISSION CONTROL TECHNOLOGY MARKET, BY TECHNOLOGY, 20172025 ($MILLION)
TABLE 64. CHINA EMISSION CONTROL TECHNOLOGY MARKET, BY END-USER VERTICAL, 20172025 ($MILLION)
TABLE 65. JAPAN EMISSION CONTROL TECHNOLOGY MARKET, BY TECHNOLOGY, 20172025 ($MILLION)
TABLE 66. JAPAN EMISSION CONTROL TECHNOLOGY MARKET, BY FUEL TYPE, 20172025 ($MILLION)
TABLE 67. JAPAN EMISSION CONTROL TECHNOLOGY MARKET, BY TECHNOLOGY, 20172025 ($MILLION)
TABLE 68. JAPAN EMISSION CONTROL TECHNOLOGY MARKET, BY END-USER VERTICAL, 20172025 ($MILLION)
TABLE 69. INDIA EMISSION CONTROL TECHNOLOGY MARKET, BY TECHNOLOGY, 20172025 ($MILLION)
TABLE 70. INDIA EMISSION CONTROL TECHNOLOGY MARKET, BY FUEL TYPE, 20172025 ($MILLION)
TABLE 71. INDIA EMISSION CONTROL TECHNOLOGY MARKET, BY TECHNOLOGY, 20172025 ($MILLION)
TABLE 72. INDIA EMISSION CONTROL TECHNOLOGY MARKET, BY END-USER VERTICAL, 20172025 ($MILLION)
TABLE 73. AUSTRALIA EMISSION CONTROL TECHNOLOGY MARKET, BY TECHNOLOGY, 20172025 ($MILLION)
TABLE 74. AUSTRALIA EMISSION CONTROL TECHNOLOGY MARKET, BY FUEL TYPE, 20172025 ($MILLION)
TABLE 75. AUSTRALIA EMISSION CONTROL TECHNOLOGY MARKET, BY TECHNOLOGY, 20172025 ($MILLION)
TABLE 76. AUSTRALIA EMISSION CONTROL TECHNOLOGY MARKET, BY END-USER VERTICAL, 20172025 ($MILLION)
TABLE 77. REST OF ASIA-PACIFIC EMISSION CONTROL TECHNOLOGY MARKET, BY TECHNOLOGY, 20172025 ($MILLION)
TABLE 78. REST OF ASIA-PACIFIC EMISSION CONTROL TECHNOLOGY MARKET, BY FUEL TYPE, 20172025 ($MILLION)
TABLE 79. REST OF ASIA-PACIFIC EMISSION CONTROL TECHNOLOGY MARKET, BY TECHNOLOGY, 20172025 ($MILLION)
TABLE 80. REST OF ASIA-PACIFIC EMISSION CONTROL TECHNOLOGY MARKET, BY END-USER VERTICAL, 20172025 ($MILLION)
TABLE 81. LAMEA EMISSION CONTROL TECHNOLOGY MARKET, BY TECHNOLOGY, 20172025 ($MILLION)
TABLE 82. LAMEA EMISSION CONTROL TECHNOLOGY MARKET, BY FUEL TYPE, 20172025 ($MILLION)
TABLE 83. LAMEA EMISSION CONTROL TECHNOLOGY MARKET, BY TECHNOLOGY, 20172025 ($MILLION)
TABLE 84. LAMEA EMISSION CONTROL TECHNOLOGY MARKET, BY END-USER VERTICAL, 20172025 ($MILLION)
TABLE 85. LATIN AMERICA EMISSION CONTROL TECHNOLOGY MARKET, BY TECHNOLOGY, 20172025 ($MILLION)
TABLE 86. LATIN AMERICA EMISSION CONTROL TECHNOLOGY MARKET, BY FUEL TYPE, 20172025 ($MILLION)
TABLE 87. LATIN AMERICA EMISSION CONTROL TECHNOLOGY MARKET, BY TECHNOLOGY, 20172025 ($MILLION)
TABLE 88. LATIN AMERICA EMISSION CONTROL TECHNOLOGY MARKET, BY END-USER VERTICAL, 20172025 ($MILLION)
TABLE 89. MIDDLE EAST EMISSION CONTROL TECHNOLOGY MARKET, BY TECHNOLOGY, 20172025 ($MILLION)
TABLE 90. MIDDLE EAST EMISSION CONTROL TECHNOLOGY MARKET, BY FUEL TYPE, 20172025 ($MILLION)
TABLE 91. MIDDLE EAST EMISSION CONTROL TECHNOLOGY MARKET, BY TECHNOLOGY, 20172025 ($MILLION)
TABLE 92. MIDDLE EAST EMISSION CONTROL TECHNOLOGY MARKET, BY END-USER VERTICAL, 20172025 ($MILLION)
TABLE 93. AFRICA EMISSION CONTROL TECHNOLOGY MARKET, BY TECHNOLOGY, 20172025 ($MILLION)
TABLE 94. AFRICA EMISSION CONTROL TECHNOLOGY MARKET, BY FUEL TYPE, 20172025 ($MILLION)
TABLE 95. AFRICA EMISSION CONTROL TECHNOLOGY MARKET, BY TECHNOLOGY, 20172025 ($MILLION)
TABLE 96. AFRICA EMISSION CONTROL TECHNOLOGY MARKET, BY END-USER VERTICAL, 20172025 ($MILLION)
TABLE 97. XXXX: COMPANY SNAPSHOT
TABLE 98. XXXX: OPERATING SEGMENTS
TABLE 99. XXXX: PRODUCT PORTFOLIO
TABLE 100. XXXX: KEY STRATEGIC MOVES AND DEVELOPMENTS
TABLE 101. BASF SE: COMPANY SNAPSHOT
TABLE 102. BASF SE: OPERATING SEGMENTS
TABLE 103. BASF SE: PRODUCT PORTFOLIO
TABLE 104. BASF SE: KEY STRATEGIC MOVES AND DEVELOPMENTS
TABLE 105. CLEAN DIESEL TECHNOLOGIES, INC.: COMPANY SNAPSHOT
TABLE 106. CLEAN DIESEL TECHNOLOGIES, INC.: OPERATING SEGMENTS
TABLE 107. CLEAN DIESEL TECHNOLOGIES, INC.: PRODUCT PORTFOLIO
TABLE 108. CLEAN DIESEL TECHNOLOGIES, INC.: KEY STRATEGIC MOVES AND DEVELOPMENTS
TABLE 109. CLARIANT: COMPANY SNAPSHOT
TABLE 110. XXXX: OPERATING SEGMENTS
TABLE 111. CLARIANT: PRODUCT PORTFOLIO
TABLE 112. CLARIANT: KEY STRATEGIC MOVES AND DEVELOPMENTS
TABLE 113. XXXX: COMPANY SNAPSHOT
TABLE 114. XXXX: OPERATING SEGMENTS
TABLE 115. XXXX: PRODUCT PORTFOLIO
TABLE 116. XXXX: KEY STRATEGIC MOVES AND DEVELOPMENTS
TABLE 117. CORNING INCORPORATED: COMPANY SNAPSHOT
TABLE 118. CORNING INCORPORATED: OPERATING SEGMENTS
TABLE 119. CORNING INCORPORATED: PRODUCT PORTFOLIO
TABLE 120. CORNING INCORPORATED: KEY STRATEGIC MOVES AND DEVELOPMENTS
TABLE 121. DCL INTERNATIONAL, INC.: COMPANY SNAPSHOT
TABLE 122. DCL INTERNATIONAL, INC.: PRODUCT PORTFOLIO
TABLE 123. JOHNSON MATTHEY: COMPANY SNAPSHOT
TABLE 124. JOHNSON MATTHEY: OPERATING SEGMENTS
TABLE 125. JOHNSON MATTHEY: PRODUCT PORTFOLIO
TABLE 126. XXXX: KEY STRATEGIC MOVES AND DEVELOPMENTS
TABLE 127. TENNECO INC.: COMPANY SNAPSHOT
TABLE 128. XXXX: OPERATING SEGMENTS
TABLE 129. TENNECO INC.: PRODUCT PORTFOLIO
TABLE 130. TENNECO INC.: KEY STRATEGIC MOVES AND DEVELOPMENTS
TABLE 131. XXXX: COMPANY SNAPSHOT
TABLE 132. UMICORE: OPERATING SEGMENTS
TABLE 133. UMICORE: PRODUCT PORTFOLIO
TABLE 134. UMICORE: KEY STRATEGIC MOVES AND DEVELOPMENTS
LIST OF FIGURES
FIGURE 01. KEY MARKET SEGMENTS
FIGURE 02. EXECUTIVE SUMMARY
FIGURE 03. EXECUTIVE SUMMARY
FIGURE 04. END-USER ROADMAP
FIGURE 05. TOP IMPACTING FACTORS
FIGURE 06. TOP INVESTMENT POCKETS
FIGURE 07. TOP WINNING STRATEGIES, BY YEAR, 20142018*
FIGURE 08. TOP WINNING STRATEGIES, BY YEAR, 20142018*
FIGURE 09. TOP WINNING STRATEGIES, BY COMPANY, 20142018*
FIGURE 10. MODERATE-TO-HIGH BARGAINING POWER OF SUPPLIERS
FIGURE 11. MODERATE-TO-HIGH THREAT OF NEW ENTRANTS
FIGURE 12. MODERATE THREAT OF SUBSTITUTES
FIGURE 13. HIGH-TO-MODERATE INTENSITY OF RIVALRY
FIGURE 14. HIGH-TO-MODERATE BARGAINING POWER OF BUYERS
FIGURE 15. MARKET SHARE ANALYSIS (2017)
FIGURE 16. GLOBAL EMISSION CONTROL TECHNOLOGY MARKET SHARE, BY TECHNOLOGY, 20172025 (%)
FIGURE 17. COMPARATIVE SHARE ANALYSIS OF EMISSION CONTROL TECHNOLOGY MARKET FOR DIESEL OXIDATION CATALYST (DOC), BY COUNTRY, 2017 & 2025 (%)
FIGURE 18. COMPARATIVE SHARE ANALYSIS OF EMISSION CONTROL TECHNOLOGY MARKET FOR DIESEL PARTICULATE FILTER (DPF), BY COUNTRY, 2017 & 2025 (%)
FIGURE 19. COMPARATIVE SHARE ANALYSIS OF EMISSION CONTROL TECHNOLOGY MARKET FOR SELECTIVE CATALYTIC REDUCTION (SCR), BY COUNTRY, 2017 & 2025 (%)
FIGURE 20. COMPARATIVE SHARE ANALYSIS OF EMISSION CONTROL TECHNOLOGY MARKET FOR EXHAUST GAS RECIRCULATION (EGR), BY COUNTRY, 2017 & 2025 (%)
FIGURE 21. COMPARATIVE SHARE ANALYSIS OF EMISSION CONTROL TECHNOLOGY MARKET FOR GASOLINE PARTICULATE FILTER (GPF), BY COUNTRY, 2017 & 2025 (%)
FIGURE 22. COMPARATIVE SHARE ANALYSIS OF EMISSION CONTROL TECHNOLOGY MARKET FOR OTHERS, BY COUNTRY, 2017 & 2025 (%)
FIGURE 23. GLOBAL EMISSION CONTROL TECHNOLOGY MARKET SHARE, BY FUEL TYPE, 20172025 (%)
FIGURE 24. COMPARATIVE SHARE ANALYSIS OF EMISSION CONTROL TECHNOLOGY MARKET FOR GASOLINE, BY COUNTRY, 2017 & 2025 (%)
FIGURE 25. COMPARATIVE SHARE ANALYSIS OF EMISSION CONTROL TECHNOLOGY MARKET FOR NLP, BY COUNTRY, 2017 & 2025 (%)
FIGURE 26. GLOBAL EMISSION CONTROL TECHNOLOGY MARKET SHARE, BY END-USER VERTICAL, 20172025 (%)
FIGURE 27. COMPARATIVE SHARE ANALYSIS OF EMISSION CONTROL TECHNOLOGY MARKET FOR AUTOMOTIVE, BY COUNTRY, 2017 & 2025 (%)
FIGURE 28. COMPARATIVE SHARE ANALYSIS OF EMISSION CONTROL TECHNOLOGY MARKET FOR MARINE, BY COUNTRY, 2017 & 2025 (%)
FIGURE 29. COMPARATIVE SHARE ANALYSIS OF EMISSION CONTROL TECHNOLOGY MARKET FOR AEROSPACE, BY COUNTRY, 2017 & 2025 (%)
FIGURE 30. COMPARATIVE SHARE ANALYSIS OF EMISSION CONTROL TECHNOLOGY MARKET FOR OFF-HIGHWAY, BY COUNTRY, 2017 & 2025 (%)
FIGURE 31. COMPARATIVE SHARE ANALYSIS OF EMISSION CONTROL TECHNOLOGY MARKET FOR ROLLINGSTOCK, BY COUNTRY, 2017 & 2025 (%)
FIGURE 32. COMPARATIVE SHARE ANALYSIS OF EMISSION CONTROL TECHNOLOGY MARKET FOR OTHERS, BY COUNTRY, 2017 & 2025 (%)
FIGURE 33. EMISSION CONTROL TECHNOLOGY MARKET, BY REGION, 2017-2025 (%)
FIGURE 34. COMPARATIVE SHARE ANALYSIS OF EMISSION CONTROL TECHNOLOGY MARKET, BY COUNTRY, 20172025 (%)
FIGURE 35. U. S. EMISSION CONTROL TECHNOLOGY MARKET, 20172025 ($MILLION)
FIGURE 36. CANADA EMISSION CONTROL TECHNOLOGY MARKET, 20172025 ($MILLION)
FIGURE 37. MEXICO EMISSION CONTROL TECHNOLOGY MARKET, 20172025 ($MILLION)
FIGURE 38. COMPARATIVE SHARE ANALYSIS OF EMISSION CONTROL TECHNOLOGY MARKET, BY COUNTRY, 20172025 (%)
FIGURE 39. U.K. EMISSION CONTROL TECHNOLOGY MARKET, 20172025 ($MILLION)
FIGURE 40. GERMANY EMISSION CONTROL TECHNOLOGY MARKET, 20172025 ($MILLION)
FIGURE 41. FRANCE EMISSION CONTROL TECHNOLOGY MARKET, 20172025 ($MILLION)
FIGURE 42. RUSSIA EMISSION CONTROL TECHNOLOGY MARKET, 20172025 ($MILLION)
FIGURE 43. REST OF EUROPE EMISSION CONTROL TECHNOLOGY MARKET, 20172025 ($MILLION)
FIGURE 44. COMPARATIVE SHARE ANALYSIS OF EMISSION CONTROL TECHNOLOGY MARKET, BY COUNTRY, 20172025 (%)
FIGURE 45. CHINA EMISSION CONTROL TECHNOLOGY MARKET, 20172025 ($MILLION)
FIGURE 46. JAPAN EMISSION CONTROL TECHNOLOGY MARKET, 20172025 ($MILLION)
FIGURE 47. INDIA EMISSION CONTROL TECHNOLOGY MARKET, 20172025 ($MILLION)
FIGURE 48. AUSTRALIA EMISSION CONTROL TECHNOLOGY MARKET, 20172025 ($MILLION)
FIGURE 49. REST OF ASIA-PACIFIC EMISSION CONTROL TECHNOLOGY MARKET, 20172025 ($MILLION)
FIGURE 50. COMPARATIVE SHARE ANALYSIS OF EMISSION CONTROL TECHNOLOGY MARKET, BY COUNTRY, 20172025 (%)
FIGURE 51. LATIN AMERICA EMISSION CONTROL TECHNOLOGY MARKET, 20172025 ($MILLION)
FIGURE 52. MIDDLE EAST EMISSION CONTROL TECHNOLOGY MARKET, 20172025 ($MILLION)
FIGURE 53. AFRICA EMISSION CONTROL TECHNOLOGY MARKET, 20172025 ($MILLION)
FIGURE 54. XXXX: REVENUE, 20152017 ($MILLION)
FIGURE 55. XXXX: REVENUE SHARE BY SEGMENT, 2017 (%)
FIGURE 56. XXXX: REVENUE SHARE BY GEOGRAPHY, 2017 (%)
FIGURE 57. BASF SE: REVENUE, 20152017 ($MILLION)
FIGURE 58. BASF SE: REVENUE SHARE BY SEGMENT, 2017 (%)
FIGURE 59. CLEAN DIESEL TECHNOLOGIES, INC.: REVENUE, 20152017 ($MILLION)
FIGURE 60. CLEAN DIESEL TECHNOLOGIES, INC.: REVENUE SHARE BY SEGMENT, 2017 (%)
FIGURE 61. CLEAN DIESEL TECHNOLOGIES, INC.: REVENUE SHARE BY GEOGRAPHY, 2017 (%)
FIGURE 62. CLARIANT: REVENUE, 20152017 ($MILLION)
FIGURE 63. CLARIANT: REVENUE SHARE BY SEGMENT, 2017 (%)
FIGURE 64. CLARIANT: REVENUE SHARE BY GEOGRAPHY, 2017 (%)
FIGURE 65. XXXX: REVENUE, 20152017 ($MILLION)
FIGURE 66. XXXX: REVENUE SHARE BY SEGMENT, 2017 (%)
FIGURE 67. XXXX: REVENUE SHARE BY GEOGRAPHY, 2017 (%)
FIGURE 68. CORNING INCORPORATED: REVENUE, 20152017 ($MILLION)
FIGURE 69. CORNING INCORPORATED: REVENUE SHARE BY SEGMENT, 2017 (%)
FIGURE 70. CORNING INCORPORATED: REVENUE SHARE BY GEOGRAPHY, 2017 (%)
FIGURE 71. JOHNSON MATTHEY: REVENUE, 20152017 ($MILLION)
FIGURE 72. JOHNSON MATTHEY: REVENUE SHARE BY SEGMENT, 2017 (%)
FIGURE 73. JOHNSON MATTHEY: REVENUE SHARE BY GEOGRAPHY, 2017 (%)
FIGURE 74. TENNECO INC.: REVENUE, 20152017 ($MILLION)
FIGURE 75. TENNECO INC.: REVENUE SHARE BY SEGMENT, 2017 (%)
FIGURE 76. TENNECO INC.: REVENUE SHARE BY GEOGRAPHY, 2017 (%)
FIGURE 77. UMICORE: REVENUE, 20152017 ($MILLION)
FIGURE 78. UMICORE: REVENUE SHARE BY SEGMENT, 2017 (%)
FIGURE 79. UMICORE: REVENUE SHARE BY GEOGRAPHY, 2017 (%)
Emission control technologies refer to technologies installed to control the discharge of harmful greenhouse gases due to the internal combustion in engine and other components. Various emission control technologies such as diesel particulate filters (DPF), diesel oxidation catalyst (DOC), gasoline particulate filters (GPF), exhaust gas recirculation (EGR), selective catalytic reduction (SCR), and others are installed to reduce the emission from engines which is responsible for significant share in total pollution. Government of various countries are making it compulsory to adopt emission control technologies to meet the emission control standards.
Emission control regulations by government, increase in automobile production, and adoption of nanotechnology in emission control techno are the key factors that fuel the growth of the global emission control technology market. However, growth in production of electric vehicles and high cost of automotive catalysts hinder the market growth.
Among the analyzed geographical regions, currently, Asia-Pacific is the highest revenue contributor, however, by the end of the forecast period, Asia-Pacific is expected to garner highest revenue in the global market, followed by Europe, LAMEA, and North America. This is attributed to strict government rules for emission in Asia-Pacific.
Â
Start reading instantly.
This Report and over 66,905+ more Reports, Available with Avenue Library. T&C*.
Enterprise
License/PDF
Library
Membership
*Taxes/Fees, if applicable will be added during checkout. All prices in USD
To ensure high-level data integrity, accurate analysis, and impeccable forecasts
For complete satisfaction
On-demand customization of scope of the report to exactly meet your needs
Targeted market view to provide pertinent information and save time of readers
Get insights on topics that are crucial for your business. Stay abreast of your interest areas.
Get Industry Data AlertsTo ensure high-level data integrity, accurate analysis, and impeccable forecasts
For complete satisfaction
On-demand customization of scope of the report to exactly meet your needs
Targeted market view to provide pertinent information and save time of readers