0
2021
Energy Harvesting System Market

Energy Harvesting System Market

by Technology (Light Energy Harvesting, Vibration Energy Harvesting, Radio Frequency Energy Harvesting, and Thermal Energy Harvesting), Component (Energy Harvesting Transducers, Power Management Integrated Circuits (PMIC), and Storage System), and Application (Building & Home Automation, Consumer Electronics, Industrial, Transportation, and Others): Global Opportunity Analysis and Industry Forecast, 2021-2030

Report Code: A13686
Sep 2021 | Pages: 278
Tables: 109
Charts: 52
  • Formats*:

  • pdf

    Single User License, Five User
    License & Enterprise User License

  • xls

    Data Pack Excel License

  • ppt

    It comes with the additional cost
    of $2500.00 contact sales.


COVID-19

Pandemic disrupted the entire world and affected many industries.

Get detailed COVID-19 impact analysis on the Energy Harvesting System Market

Request Now !

Energy Harvesting System Market Outlook - 2030

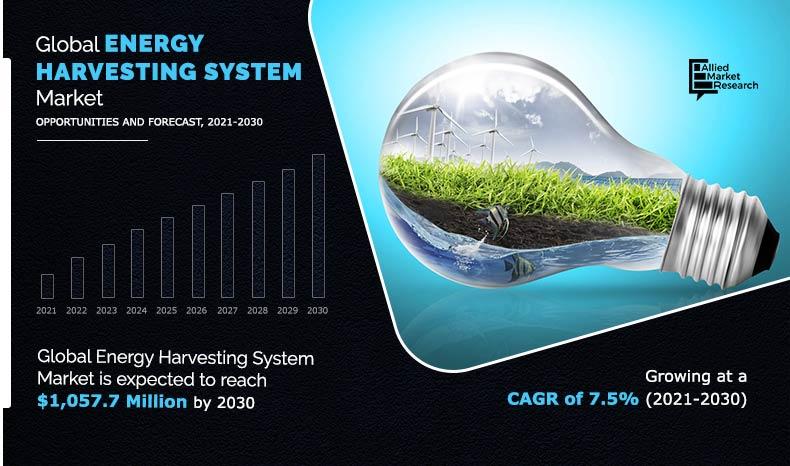
The global energy harvesting system market was valued at $511.6 million in 2020, and is projected to reach $1,057.7 million by 2030, growing at a CAGR of 7.5% from 2021 to 2030. Energy harvesting (energy scavenging) is the translation of ambient energy, which is derived from external resources existing in the atmosphere into electrical energy. Devices or systems that are used for energy harvesting are known as energy harvesting systems.

The energy harvesting system market has been negatively impacted due to the wake of the COVID-19 pandemic, owing to its dependence on building & construction, consumer electronics, and industrial.

Growth in population has increased demand for energy consumption. In addition, technological advancements in sensor-based energy harvesting systems and energy efficient harvesting components drives growth of the global market. In addition, energy that is available in the environment is wasted directly or indirectly. Thus, the ability of these systems to capture this energy and convert that into electrical energy can be further used in autonomous electronic devices or circuits also drives growth of the global energy harvesting system market. Harvested energy can be further used in electrical utilities that consume minimal energy such as sensors, watches, and other home appliances. All these factors collectively increase demand for energy harvesting system, which propels the global energy harvesting system market growth.

Energy-Harvesting-System-Market-2021-2030

However, underneath recurrent environmental power and unavailability of high-powered energy harvesting systems that are not designed to be operated efficiently under varying operating conditions is expected to restrain growth of the energy harvesting system market during the forecast period. 

On the contrary, there is growth in importance and several research & development activities are being carried out on energy harvesting application. For instance, application of energy harvesting systems such as wireless sensor nodes are used in the healthcare sector and implanted sensor nodes that are used in medical applications are gaining importance. In addition, technological advancements in the automotive sector have led to development of tire pressure monitor. This device is also another example that works on the principle of energy harvesting technique. This factor is anticipated to open up new opportunities in the market. 

The global energy harvesting system market analysis is done on the basis of technology, component, application, and region. Depending on technology, the market is divided into light energy harvesting, vibration energy harvesting, radio frequency energy harvesting, and thermal energy harvesting. On the basis of component, it is fragmented into energy harvesting transducers, power management integrated circuits (PMIC), and storage systems. The application covered in the study include building & home automation, consumer electronics, industrial, transportation, and others. Region-wise, the market is analyzed across North America, Europe, Asia-Pacific, and LAMEA. 

The global static VAR compensator market profiles leading players that include Cymbet Corporation, Cedrat Technologies SA, Tekceleo, ZF Friedrichshafen AG, Physik Instrumente (PI) GmbH & Co. KG, Advanced Linear Devices Inc., Mide Technology Corporation, Powercast, Xidas, and Analog Devices.
The global market analysis covers in-depth information of the major energy harvesting system industry participants.

Energy harvesting system market, by region

The Asia-Pacific energy harvesting system market size is projected to grow at the highest CAGR of 8.2% during the forecast period and accounted for 23.4% of the energy harvesting system market share in 2020. The region accounts for more than half of the global energy consumption, owing to rise in industrialization as well increase in population. Renewable energy has increased considerably in countries such as China and India. Thus, there is constant rise in use of energy harvesting systems in this region. 

Energy Harvesting System Market
By Region

2030
Europe 
North America
Asia-Pacific
LAMEA

Asia-Pacific would exhibit highest CAGR of 8.2% during 2021-2030.

Get more information on this report : Request Sample Pages

Energy harvesting system market, by technology

In 2020, the light energy harvesting segment was the largest revenue generator, and is anticipated to grow at a CAGR of 7.9% during the forecast period. There is increase in number of key players that are engaged in production of solar energy-based products that are considered under the light energy harvesting sector. This harvested energy is further used efficiently in sectors such as building automation and consumer electronic devices.

Energy Harvesting System Market
By Technology

Your browser does not support the canvas element.

Ligh energy harvesting technology is the most lucrative segment

Get more information on this report : Request Sample Pages

Energy harvesting system market, by component

By component, the energy harvesting transducers segment dominated the global market in 2020, and is anticipated to grow at a CAGR of 7.9% during forecast period. Rise in use of electromechanical transducers for harvesting vibration energy is the key factor that is driving the demand of the global market. 

Energy Harvesting System Market
By Component

Your browser does not support the canvas element.

Energy harvesting transducer component is projected as the fastest growing segment

Get more information on this report : Request Sample Pages

Energy harvesting system market, by application

In 2020, the building & home automation segment was the largest revenue generator, and is anticipated to grow at a CAGR of 8.1% during the forecast period. Installation of energy harvesting system in building & home automation offer advantages such as flexibility for distribution as there is no requirement for hardwiring. In addition, installment of these energy harvesting switches also minimizes maintenance and environmental impact as there is no disposal of batteries. 

Energy Harvesting System Market
By Application

Your browser does not support the canvas element.

Building & home automation application is projected as the fastest growing segment

Get more information on this report : Request Sample Pages

Key benefits for stakeholders

  • Porter’s five forces analysis helps analyze the potential of buyers & suppliers and the competitive scenario of the industry for strategy building.
  • It outlines the current energy harvesting system market trends and future estimations from 2020 to 2030 to understand the prevailing opportunities and potential investment pockets.
  • The major countries in the region have been mapped according to their individual revenue contribution to the regional market.
  • The key drivers, restraints, and opportunities and their detailed impact analysis are explained in the study.
  • The profiles of key players and their key strategic developments are enlisted in the report.

Impact Of Covid-19 On The Global Energy Harvesting System Market

  • The novel coronavirus is an incomparable global pandemic that has spread to over 180 countries and caused huge losses of lives and the economy around the globe. 
  • The energy harvesting system market has been negatively impacted due to the wake of the COVID-19 pandemic, owing to its dependence on building & construction, consumer electronics, industrial, and transportation.
  • The construction sector is vulnerable to economic cycle that further has resulted in decline in construction projects, construction enterprise, and workers associated with construction sector owing to drastic change or decline in economic activity due to COVID-19 pandemic.
  • In addition, rise in number of COVID-19 infection among workers in the construction sector has resulted in work deficits that further delays deadline of the project. This, in turn, has reduced demand and consumption of energy harvesting system in building & home automation.
  • Other construction activities such as renovation, maintenance, and demolition are also negatively affected, owing to the wake of COVID-19 pandemic that has further declined growth of the global market in this situation. For instance, according to an article published by CNA, the construction Industry Joint Committee (CIJC) has said that shortage of manpower may lead to delay in construction projects attributed to workplace safety, and other factors. 
  • In addition, energy harvesting systems are also used in transportation i.e., automotive sector. The automotive sector is also negatively affected due to wake of COVID-19 pandemic. According to a report published by Wipro, the automotive industry witnessed 30% decline in sales in March 2020 as compared to March 2019, owing to lockdowns and shutdowns of auto plants.

Key market segments

By Technology

  • Light Energy Harvesting
  • Vibration Energy Harvesting
  • Radio Frequency Energy Harvesting
  • Thermal Energy Harvesting

By Component

  • Energy Harvesting Transducer
  • Power Management Integrated Circuits (PMIC)
  • Storage System

By Application

  • Building & Automation
  • Consumer Electronics
  • Industrial
  • Transportation

By Region

  • North America
    • U.S.
    • Canada
    • Mexico
  • Europe
    • Germany
    • UK
    • France
    • Italy
    • Spain
    • Rest of Europe
  • Asia-Pacific
    • China
    • Japan
    • India
    • South Korea
    • Australia
    • Rest of Asia-Pacific
  • LAMEA
    • Brazil
    • Saudi Arabia
    • South Africa
    • Rest of LAMEA

Energy Harvesting System Market Report Highlights

Aspects Details
By Technology
  • Light Energy Harvesting
  • Vibration Energy Harvesting
  • Radio Frequency Energy Harvesting
  • Thermal Energy Harvesting
By Component
  • Energy Harvesting Transducer
  • Power Management Integrated Circuits (PMIC)
  • Storage System
By Application
  • Building & Automation
  • Consumer Electronics
  • Industrial
  • Transportation
By Region
  • North America  (U.S., Canada, Mexico)
  • Europe  (France, Germany, Italy, Spain, UK, Russia, Rest of Europe)
  • Asia-Pacific  (China, Japan, India, South Korea, Australia, Thailand, Malaysia, Indonesia, Rest of Asia-Pacific)
  • LAMEA  (Brazil, South Africa, Saudi Arabia, UAE, Argentina, Rest of LAMEA)
Key Market Players Analog Devices, Xidas, Powercast, Mide Technology Corporation, ZF Friedrichshafen AG, Cedrat Technologies SA, Tekceleo, Physik Instrumente (PI) GmbH & Co. KG, Advanced Linear Devices Inc., Cymbet Corporation
 

CHAPTER 1:INTRODUCTION

1.1.Report description
1.2.Key benefits for stakeholders
1.3.Key market segments
1.4.Research methodology

1.4.1.Secondary research
1.4.2.Primary research

1.5.Analyst tools and models

CHAPTER 2:EXECUTIVE SUMMARY

2.1.Key findings of the study
2.2.CXO perspective

CHAPTER 3:MARKET OVERVIEW

3.1.Market definition and scope
3.2.Key findings

3.2.1.Top investment pockets

3.3.Porter’s five forces analysis
3.4.Market dynamics

3.4.1.Drivers

3.4.1.1.Rise in demand for light energy harvesting
3.4.1.2.Rise in demand for vibration energy harvesting

3.4.2.Restraint

3.4.2.1.Disadvantages associated with energy harvesting techniques

3.4.3.Opportunity

3.4.3.1.Growing demand for energy harvesting system in building & home automation

3.5.Value chain analysis
3.6.Pricing analysis
3.7.Impact of COVID-19 on the global energy harvesting system market
3.8.Patent analysis, 2012-2021

CHAPTER 4:GLOBAL ENERGY HARVESTING SYSTEM MARKET, BY TECHNOLOGY

4.1.Overview

4.1.1.Market size and forecast, by technology

4.2.Light energy harvesting

4.2.1.Key market trends, growth factors, and opportunities
4.2.2.Market size and forecast, by region
4.2.3.Market share analysis, by country

4.3.Vibration energy harvesting

4.3.1.Key market trends, growth factors, and opportunities
4.3.2.Market size and forecast, by region
4.3.3.Market share analysis, by country

4.4.Radio frequency (RF) energy harvesting

4.4.1.Key market trends, growth factors, and opportunities
4.4.2.Market size and forecast, by region
4.4.3.Market share analysis, by country

4.5.Thermal energy harvesting

4.5.1.Key market trends, growth factors, and opportunities
4.5.2.Market size and forecast, by region
4.5.3.Market share analysis, by country

CHAPTER 5:GLOBAL ENERGY HARVESTING SYSTEM MARKET, BY COMPONENT

5.1.Overview

5.1.1.Market size and forecast, by component

5.2.Energy harvesting transducers

5.2.1.Key market trends, growth factors, and opportunities
5.2.2.Market size and forecast, by region
5.2.3.Market share analysis, by country

5.3.Power management integrated circuits (PMIC)

5.3.1.Key market trends, growth factors, and opportunities
5.3.2.Market size and forecast, by region
5.3.3.Market share analysis, by country

5.4.Storage system

5.4.1.Key market trends, growth factors, and opportunities
5.4.2.Market size and forecast, by region
5.4.3.Market share analysis, by country

CHAPTER 6:GLOBAL ENERGY HARVESTING SYSTEM MARKET, BY APPLICATION

6.1.Overview

6.1.1.Market size and forecast, by application

6.2.Building & home automation

6.2.1.Key market trends, growth factors, and opportunities
6.2.2.Market size and forecast, by region
6.2.3.Market share analysis, by country

6.3.Consumer electronics

6.3.1.Key market trends, growth factors, and opportunities
6.3.2.Market size and forecast, by region
6.3.3.Market share analysis, by country

6.4.Industrial

6.4.1.Key market trends, growth factors, and opportunities
6.4.2.Market size and forecast, by region
6.4.3.Market share analysis, by country

6.5.Transportation

6.5.1.Key market trends, growth factors, and opportunities
6.5.2.Market size and forecast, by region
6.5.3.Market share analysis, by country

6.6.Others

6.6.1.Key market trends, growth factors, and opportunities
6.6.2.Market size and forecast, by region
6.6.3.Market share analysis, by country

CHAPTER 7:ENERGY HARVESTING SYSTEM MARKET, BY REGION

7.1.Overview

7.1.1.Market size and forecast

7.2.North America

7.2.1.Key market trends, growth factors, and opportunities
7.2.2.Market size and forecast, by technology
7.2.3.Market size and forecast, by component
7.2.4.Market size and forecast, by application
7.2.5.Market share analysis, by country
7.2.6.U.S.
7.2.7.Market size and forecast, by technology
7.2.8.Market size and forecast, by component
7.2.9.Market size and forecast, by application
7.2.10.Canada
7.2.11.Market size and forecast, by technology
7.2.12.Market size and forecast, by component
7.2.13.Market size and forecast, by application
7.2.14.Mexico
7.2.15.Market size and forecast, by technology
7.2.16.Market size and forecast, by component
7.2.17.Market size and forecast, by application

7.3.Europe

7.3.1.Key market trends, growth factors, and opportunities
7.3.2.Market size and forecast, by technology
7.3.3.Market size and forecast, by component
7.3.4.Market size and forecast, by application
7.3.5.Market share analysis, by country
7.3.6.Germany
7.3.7.Market size and forecast, by technology
7.3.8.Market size and forecast, by component
7.3.9.Market size and forecast, by application
7.3.10.France
7.3.11.Market size and forecast, by technology
7.3.12.Market size and forecast, by component
7.3.13.Market size and forecast, by application
7.3.14.Italy
7.3.15.Market size and forecast, by technology
7.3.16.Market size and forecast, by component
7.3.17.Market size and forecast, by application
7.3.18.Spain
7.3.19.Market size and forecast, by technology
7.3.20.Market size and forecast, by component
7.3.21.Market size and forecast, by application
7.3.22.UK
7.3.23.Market size and forecast, by technology
7.3.24.Market size and forecast, by component
7.3.25.Market size and forecast, by application
7.3.26.Rest of Europe
7.3.27.Market size and forecast, by technology
7.3.28.Market size and forecast, by component
7.3.29.Market size and forecast, by application

7.4.Asia-Pacific

7.4.1.Key market trends, growth factors, and opportunities
7.4.2.Market size and forecast, by technology
7.4.3.Market size and forecast, by component
7.4.4.Market size and forecast, by application
7.4.5.Market share analysis, by country
7.4.6.China
7.4.7.Market size and forecast, by technology
7.4.8.Market size and forecast, by component
7.4.9.Market size and forecast, by application
7.4.10.Japan
7.4.11.Market size and forecast, by technology
7.4.12.Market size and forecast, by component
7.4.13.Market size and forecast, by application
7.4.14.India
7.4.15.Market size and forecast, by technology
7.4.16.Market size and forecast, by component
7.4.17.Market size and forecast, by application
7.4.18.South Korea
7.4.19.Market size and forecast, by technology
7.4.20.Market size and forecast, by component
7.4.21.Market size and forecast, by application
7.4.22.Australia
7.4.23.Market size and forecast, by technology
7.4.24.Market size and forecast, by component
7.4.25.Market size and forecast, by application
7.4.26.Rest of Asia-Pacific
7.4.27.Market size and forecast, by technology
7.4.28.Market size and forecast, by component
7.4.29.Market size and forecast, by application

7.5.LAMEA

7.5.1.Key market trends, growth factors, and opportunities
7.5.2.Market size and forecast, by technology
7.5.3.Market size and forecast, by component
7.5.4.Market size and forecast, by application
7.5.5.Market share analysis, by country
7.5.6.Brazil
7.5.7.Market size and forecast, by technology
7.5.8.Market size and forecast, by component
7.5.9.Market size and forecast, by application
7.5.10.Saudi Arabia
7.5.11.Market size and forecast, by technology
7.5.12.Market size and forecast, by component
7.5.13.Market size and forecast, by application
7.5.14.South Africa
7.5.15.Market size and forecast, by technology
7.5.16.Market size and forecast, by component
7.5.17.Market size and forecast, by application
7.5.18.Rest of LAMEA
7.5.19.Market size and forecast, by technology
7.5.20.Market size and forecast, by component
7.5.21.Market size and forecast, by application

CHAPTER 8:COMPETITIVE LANDSCAPE

8.1.INTRODUCTION

8.1.1.MARKET PLAYER POSITIONING, 2020

8.2.PRODUCT MAPPING OF TOP 10 PLAYER
8.3.COMPETITIVE DASHBOARD
8.4.COMPETITIVE HEATMAP
SOURCE: COMPANY WEBSITE, ANNUAL REPORT, SECONDARY RESEARCH, AND AMR ANALYSIS

CHAPTER 9:COMPANY PROFILES:

9.1.Cymbet Corporation

9.1.1.Company overview
9.1.2.Company snapshot
9.1.3.Product portfolio

9.2.Cedrat Technologies SA

9.2.1.Company overview
9.2.2.Company snapshot
9.2.3.Product portfolio

9.3.Tekceleo

9.3.1.Company overview
9.3.2.Company snapshot
9.3.3.Product portfolio

9.4.ZF Friedrichshafen AG

9.4.1.Company overview
9.4.2.Company snapshot
9.4.3.Product portfolio

9.5.Physik Instrumente (PI) GmbH & Co. KG

9.5.1.Company overview
9.5.2.Company snapshot
9.5.3.Product portfolio

9.6.Advanced Linear Devices Inc.

9.6.1.Company overview
9.6.2.Company snapshot
9.6.3.Product portfolio

9.7.Mide Technology Corporation

9.7.1.Company overview
9.7.2.Company snapshot
9.7.3.Product portfolio

9.8.Powercast

9.8.1.Company overview
9.8.2.Company snapshot
9.8.3.Product portfolio

9.9.Xidas

9.9.1.Company overview
9.9.2.Company snapshot
9.9.3.Product portfolio

9.10.Analog Devices

9.10.1.Company overview
9.10.2.Company snapshot
9.10.3.Product Portfolio

LIST OF TABLES

TABLE 01.GLOBAL ENERGY HARVESTING SYSTEM MARKET, BY TECHNOLOGY, 2020-2030 ($MILLION)
TABLE 02.ENERGY HARVESTING SYSTEM MARKET FOR LIGHT ENERGY HARVESTING, BY REGION, 2020–2030 ($MILLION)
TABLE 03.ENERGY HARVESTING SYSTEM MARKET FOR VIBRATION ENERGY HARVESTING, BY REGION, 2020–2030 ($MILLION)
TABLE 04.ENERGY HARVESTING SYSTEM MARKET FOR RADIO FREQUENCY ENERGY HARVESTING, BY REGION, 2020–2030 ($MILLION)
TABLE 05.ENERGY HARVESTING SYSTEM MARKET FOR THERMAL ENERGY HARVESTING, BY REGION, 2020–2030 ($MILLION)
TABLE 06.GLOBAL ENERGY HARVESTING SYSTEM MARKET, BY COMPONENT, 2020-2030 ($MILLION)
TABLE 07.ENERGY HARVESTING SYSTEM MARKET FOR ENERGY HARVESTING TRANSDUCERS, BY REGION, 2020–2030 ($MILLION)
TABLE 08.ENERGY HARVESTING SYSTEM MARKET FOR POWER MANAGEMENT INTEGRATED CIRCUITS (PMIC), BY REGION, 2020–2030 ($MILLION)
TABLE 09.ENERGY HARVESTING SYSTEM MARKET FOR STORAGE SYSTEM, BY REGION, 2020–2030 ($MILLION)
TABLE 10.GLOBAL ENERGY HARVESTING SYSTEM MARKET, BY APPLICATION, 2020-2030 ($MILLION)
TABLE 11.ENERGY HARVESTING SYSTEM MARKET FOR BUILDING & HOME AUTOMATION, BY REGION, 2020–2030 ($MILLION)
TABLE 12.ENERGY HARVESTING SYSTEM MARKET FOR CONSUMER ELECTRONICS, BY REGION, 2020–2030 ($MILLION)
TABLE 13.ENERGY HARVESTING SYSTEM MARKET FOR INDUSTRIAL, BY REGION, 2020–2030 ($MILLION)
TABLE 14.ENERGY HARVESTING SYSTEM MARKET FOR TRANSPORTATION, BY REGION, 2020–2030 ($MILLION)
TABLE 15.ENERGY HARVESTING SYSTEM MARKET FOR OTHERS, BY REGION, 2020–2030 ($MILLION)
TABLE 16.ENERGY HARVESTING SYSTEM MARKET, BY REGION, 2020–2030 ($MILLION)
TABLE 17.NORTH AMERICA ENERGY HARVESTING SYSTEM MARKET, BY TECHNOLOGY, 2020–2030 ($MILLION)
TABLE 18.NORTH AMERICA ENERGY HARVESTING SYSTEM MARKET, BY COMPONENT, 2020–2030 ($MILLION)
TABLE 19.NORTH AMERICA ENERGY HARVESTING SYSTEM MARKET, BY APPLICATION, 2020–2030 ($MILLION)
TABLE 20.NORTH AMERICA ENERGY HARVESTING SYSTEM MARKET, BY COUNTRY, 2020–2030 ($MILLION)
TABLE 21.U.S. ENERGY HARVESTING SYSTEM MARKET, BY TECHNOLOGY, 2020–2030 ($MILLION)
TABLE 22.U.S. ENERGY HARVESTING SYSTEM MARKET, BY COMPONENT, 2020–2030 ($MILLION)
TABLE 23.U.S. ENERGY HARVESTING SYSTEM MARKET, BY APPLICATION, 2020–2030 ($MILLION)
TABLE 24.CANADA ENERGY HARVESTING SYSTEM MARKET, BY TECHNOLOGY, 2020–2030 ($MILLION)
TABLE 25.CANADA ENERGY HARVESTING SYSTEM MARKET, BY COMPONENT, 2020–2030 ($MILLION)
TABLE 26.CANADA ENERGY HARVESTING SYSTEM MARKET, BY APPLICATION, 2020–2030 ($MILLION)
TABLE 27.MEXICO ENERGY HARVESTING SYSTEM MARKET, BY TECHNOLOGY, 2020–2030 ($MILLION)
TABLE 28.MEXICO ENERGY HARVESTING SYSTEM MARKET, BY COMPONENT, 2020–2030 ($MILLION)
TABLE 29.MEXICO ENERGY HARVESTING SYSTEM MARKET, BY APPLICATION, 2020–2030 ($MILLION)
TABLE 30.EUROPE ENERGY HARVESTING SYSTEM MARKET, BY TECHNOLOGY, 2020–2030 ($MILLION)
TABLE 31.EUROPE ENERGY HARVESTING SYSTEM MARKET, BY COMPONENT, 2020–2030 ($MILLION)
TABLE 32.EUROPE ENERGY HARVESTING SYSTEM MARKET, BY APPLICATION, 2020–2030 ($MILLION)
TABLE 33.EUROPE ENERGY HARVESTING SYSTEM MARKET, BY COUNTRY, 2020–2030 ($MILLION)
TABLE 34.GERMANY ENERGY HARVESTING SYSTEM MARKET, BY TECHNOLOGY, 2020–2030 ($MILLION)
TABLE 35.GERMANY ENERGY HARVESTING SYSTEM MARKET, BY COMPONENT, 2020–2030 ($MILLION)
TABLE 36.GERMANY ENERGY HARVESTING SYSTEM MARKET, BY APPLICATION, 2020–2030 ($MILLION)
TABLE 37.FRANCE ENERGY HARVESTING SYSTEM MARKET, BY TECHNOLOGY, 2020–2030 ($MILLION)
TABLE 38.FRANCE ENERGY HARVESTING SYSTEM MARKET, BY COMPONENT, 2020–2030 ($MILLION)
TABLE 39.FRANCE ENERGY HARVESTING SYSTEM MARKET, BY APPLICATION, 2020–2030 ($MILLION)
TABLE 40.ITALY ENERGY HARVESTING SYSTEM MARKET, BY TECHNOLOGY, 2020–2030 ($MILLION)
TABLE 41.ITALY ENERGY HARVESTING SYSTEM MARKET, BY COMPONENT, 2020–2030 ($MILLION)
TABLE 42.ITALY ENERGY HARVESTING SYSTEM MARKET, BY APPLICATION, 2020–2030 ($MILLION)
TABLE 43.SPAIN ENERGY HARVESTING SYSTEM MARKET, BY TECHNOLOGY, 2020–2030 ($MILLION)
TABLE 44.SPAIN ENERGY HARVESTING SYSTEM MARKET, BY COMPONENT, 2020–2030 ($MILLION)
TABLE 45.SPAIN ENERGY HARVESTING SYSTEM MARKET, BY APPLICATION, 2020–2030 ($MILLION)
TABLE 46.UK ENERGY HARVESTING SYSTEM MARKET, BY TECHNOLOGY, 2020–2030 ($MILLION)
TABLE 47.UK ENERGY HARVESTING SYSTEM MARKET, BY COMPONENT, 2020–2030 ($MILLION)
TABLE 48.UK ENERGY HARVESTING SYSTEM MARKET, BY APPLICATION, 2020–2030 ($MILLION)
TABLE 49.REST OF EUROPE ENERGY HARVESTING SYSTEM MARKET, BY TECHNOLOGY, 2020–2030 ($MILLION)
TABLE 50.REST OF EUROPE ENERGY HARVESTING SYSTEM MARKET, BY COMPONENT, 2020–2030 ($MILLION)
TABLE 51.REST OF EUROPE ENERGY HARVESTING SYSTEM MARKET, BY APPLICATION, 2020–2030 ($MILLION)
TABLE 52.ASIA-PACIFIC ENERGY HARVESTING SYSTEM MARKET, BY TECHNOLOGY, 2020–2030 ($MILLION)
TABLE 53.ASIA-PACIFIC ENERGY HARVESTING SYSTEM MARKET, BY COMPONENT, 2020–2030 ($MILLION)
TABLE 54.ASIA-PACIFIC ENERGY HARVESTING SYSTEM MARKET, BY APPLICATION, 2020–2030 ($MILLION)
TABLE 55.ASIA-PACIFIC ENERGY HARVESTING SYSTEM MARKET, BY COUNTRY, 2020–2030 ($MILLION)
TABLE 56.CHINA ENERGY HARVESTING SYSTEM MARKET, BY TECHNOLOGY, 2020–2030 ($MILLION)
TABLE 57.CHINA ENERGY HARVESTING SYSTEM MARKET, BY COMPONENT, 2020–2030 ($MILLION)
TABLE 58.CHINA ENERGY HARVESTING SYSTEM MARKET, BY APPLICATION, 2020–2030 ($MILLION)
TABLE 59.JAPAN ENERGY HARVESTING SYSTEM MARKET, BY TECHNOLOGY, 2020–2030 ($MILLION)
TABLE 60.JAPAN ENERGY HARVESTING SYSTEM MARKET, BY COMPONENT, 2020–2030 ($MILLION)
TABLE 61.JAPAN ENERGY HARVESTING SYSTEM MARKET, BY APPLICATION, 2020–2030 ($MILLION)
TABLE 62.INDIA ENERGY HARVESTING SYSTEM MARKET, BY TECHNOLOGY, 2020–2030 ($MILLION)
TABLE 63.INDIA ENERGY HARVESTING SYSTEM MARKET, BY COMPONENT, 2020–2030 ($MILLION)
TABLE 64.INDIA ENERGY HARVESTING SYSTEM MARKET, BY APPLICATION, 2020–2030 ($MILLION)
TABLE 65.SOUTH KOREA ENERGY HARVESTING SYSTEM MARKET, BY TECHNOLOGY, 2020–2030 ($MILLION)
TABLE 66.SOUTH KOREA ENERGY HARVESTING SYSTEM MARKET, BY COMPONENT, 2020–2030 ($MILLION)
TABLE 67.SOUTH KOREA ENERGY HARVESTING SYSTEM MARKET, BY APPLICATION, 2020–2030 ($MILLION)
TABLE 68.AUSTRALIA ENERGY HARVESTING SYSTEM MARKET, BY TECHNOLOGY, 2020–2030 ($MILLION)
TABLE 69.AUSTRALIA ENERGY HARVESTING SYSTEM MARKET, BY COMPONENT, 2020–2030 ($MILLION)
TABLE 70.AUSTRALIA ENERGY HARVESTING SYSTEM MARKET, BY APPLICATION, 2020–2030 ($MILLION)
TABLE 71.REST OF ASIA-PACIFIC ENERGY HARVESTING SYSTEM MARKET, BY TECHNOLOGY, 2020–2030 ($MILLION)
TABLE 72.REST OF ASIA-PACIFIC ENERGY HARVESTING SYSTEM MARKET, BY COMPONENT, 2020–2030 ($MILLION)
TABLE 73.REST OF ASIA-PACIFIC ENERGY HARVESTING SYSTEM MARKET, BY APPLICATION, 2020–2030 ($MILLION)
TABLE 74.LAMEA ENERGY HARVESTING SYSTEM MARKET, BY TECHNOLOGY, 2020–2030 ($MILLION)
TABLE 75.LAMEA ENERGY HARVESTING SYSTEM MARKET, BY COMPONENT, 2020–2030 ($MILLION)
TABLE 76.LAMEA ENERGY HARVESTING SYSTEM MARKET, BY APPLICATION, 2020–2030 ($MILLION)
TABLE 77.LAMEA ENERGY HARVESTING SYSTEM MARKET, BY COUNTRY, 2020–2030 ($MILLION)
TABLE 78.BRAZIL ENERGY HARVESTING SYSTEM MARKET, BY TECHNOLOGY, 2020–2030 ($MILLION)
TABLE 79.BRAZIL ENERGY HARVESTING SYSTEM MARKET, BY COMPONENT, 2020–2030 ($MILLION)
TABLE 80.BRAZIL ENERGY HARVESTING SYSTEM MARKET, BY APPLICATION, 2020–2030 ($MILLION)
TABLE 81.SAUDI ARABIA ENERGY HARVESTING SYSTEM MARKET, BY TECHNOLOGY, 2020–2030 ($MILLION)
TABLE 82.SAUDI ARABIA ENERGY HARVESTING SYSTEM MARKET, BY COMPONENT, 2020–2030 ($MILLION)
TABLE 83.SAUDI ARABIA ENERGY HARVESTING SYSTEM MARKET, BY APPLICATION, 2020–2030 ($MILLION)
TABLE 84.SOUTH AFRICA ENERGY HARVESTING SYSTEM MARKET, BY TECHNOLOGY, 2020–2030 ($MILLION)
TABLE 85.SOUTH AFRICA ENERGY HARVESTING SYSTEM MARKET, BY COMPONENT, 2020–2030 ($MILLION)
TABLE 86.SOUTH AFRICA ENERGY HARVESTING SYSTEM MARKET, BY APPLICATION, 2020–2030 ($MILLION)
TABLE 87.REST OF LAMEA ENERGY HARVESTING SYSTEM MARKET, BY TECHNOLOGY, 2020–2030 ($MILLION)
TABLE 88.REST OF LAMEA ENERGY HARVESTING SYSTEM MARKET, BY COMPONENT, 2020–2030 ($MILLION)
TABLE 89.REST OF LAMEA ENERGY HARVESTING SYSTEM MARKET, BY APPLICATION, 2020–2030 ($MILLION)
TABLE 90.CYMBET: COMPANY SNAPSHOT
TABLE 91.CYMBET: PRODUCT PORTFOLIO
TABLE 92.CTEC: COMPANY SNAPSHOT
TABLE 93.DUPONT.: PRODUCT PORTFOLIO
TABLE 94.TEKCELEO: COMPANY SNAPSHOT
TABLE 95.TEKCELEO: PRODUCT PORTFOLIO
TABLE 96.ZF: COMPANY SNAPSHOT
TABLE 97.ZF: PRODUCT PORTFOLIO
TABLE 98.PI: COMPANY SNAPSHOT
TABLE 99.PI: PRODUCT PORTFOLIO
TABLE 100.ALD: COMPANY SNAPSHOT
TABLE 101.ALD: PRODUCT PORTFOLIO
TABLE 102.MIDE: COMPANY SNAPSHOT
TABLE 103.MIDE: PRODUCT PORTFOLIO
TABLE 104.POWERCAST: COMPANY SNAPSHOT
TABLE 105.POWERCAST: PRODUCT PORTFOLIO
TABLE 106.XIDAS: COMPANY SNAPSHOT
TABLE 107.XIDAS: PRODUCT PORTFOLIO
TABLE 108.ANALOG DEVICES: COMPANY SNAPSHOT
TABLE 109.ANALOG DEVICES.: PRODUCT PORTFOLIO

LIST OF FIGURES

FIGURE 01.GLOBAL ENERGY HARVESTING SYSTEM MARKET SNAPSHOT
FIGURE 02.GLOBAL ENERGY HARVESTING SYSTEM MARKET SEGMENTATION
FIGURE 03.TOP INVESTMENT POCKETS
FIGURE 04.MODERATE BARGAINING POWER OF SUPPLIERS
FIGURE 05.MODERATE BARGAINING POWER OF BUYERS
FIGURE 06.MODERATE THREAT OF NEW ENTRANTS
FIGURE 07.MODERATE THREAT OF SUBSTITUTES
FIGURE 08.MODERATE COMPETITIVE RIVALRY
FIGURE 09.GLOBAL ENERGY HARVESTING SYSTEM MARKET DYNAMICS
FIGURE 10.VALUE CHAIN ANALYSIS
FIGURE 11.PATENT ANALYSIS, BY COUNTRY, 2021
FIGURE 12.PATENT ANALYSIS, BY APPLICANT, 2021
FIGURE 13.PATENT ANALYSIS, BY PUBLICATION DATE, 2012-2021
FIGURE 14.GLOBAL ENERGY HARVESTING SYSTEM MARKET, BY TECHNOLOGY, 2020–2030 ($MILILION)
FIGURE 15.COMPARATIVE SHARE ANALYSIS OF ENERGY HARVESTING SYSTEM MARKET FOR LIGHT ENERGY HARVESTING, BY COUNTRY, 2020 & 2030 (%)
FIGURE 16.COMPARATIVE SHARE ANALYSIS OF ENERGY HARVESTING SYSTEM MARKET FOR VIBRATION ENERGY HARVESTING, BY COUNTRY, 2020 & 2030 (%)
FIGURE 17.COMPARATIVE SHARE ANALYSIS OF ENERGY HARVESTING SYSTEM MARKET FOR RADIO FREQUENCY ENERGY HARVESTING, BY COUNTRY, 2020 & 2030 (%)
FIGURE 18.COMPARATIVE SHARE ANALYSIS OF ENERGY HARVESTING SYSTEM MARKET FOR THERMAL ENERGY HARVESTING, BY COUNTRY, 2020 & 2030 (%)
FIGURE 19.GLOBAL ENERGY HARVESTING SYSTEM MARKET, BY COMPONENT, 2020–2030 ($MILILION)
FIGURE 20.COMPARATIVE SHARE ANALYSIS OF ENERGY HARVESTING SYSTEM MARKET FOR ENERGY HARVESTING TRANSDUCERS, BY COUNTRY, 2020 & 2030 (%)
FIGURE 21.COMPARATIVE SHARE ANALYSIS OF ENERGY HARVESTING SYSTEM MARKET FOR POWER MANAGEMENT INTEGRATED CIRCUITS (PMIC), BY COUNTRY, 2020 & 2030 (%)
FIGURE 22.COMPARATIVE SHARE ANALYSIS OF ENERGY HARVESTING SYSTEM MARKET FOR STORAGE SYSTEM, BY COUNTRY, 2020 & 2030 (%)
FIGURE 23.GLOBAL ENERGY HARVESTING SYSTEM MARKET, BY APPLICATION, 2020–2030 ($MILILION)
FIGURE 24.COMPARATIVE SHARE ANALYSIS OF ENERGY HARVESTING SYSTEM MARKET FOR BUILDING & HOME AUTOMATION, BY COUNTRY, 2020 & 2030 (%)
FIGURE 25.COMPARATIVE SHARE ANALYSIS OF ENERGY HARVESTING SYSTEM MARKET FOR CONSUMER ELECTRONICS, BY COUNTRY, 2020 & 2030 (%)
FIGURE 26.COMPARATIVE SHARE ANALYSIS OF ENERGY HARVESTING SYSTEM MARKET FOR INDUSTRIAL, BY COUNTRY, 2020 & 2030 (%)
FIGURE 27.COMPARATIVE SHARE ANALYSIS OF ENERGY HARVESTING SYSTEM MARKET FOR TRANSPORTATION, BY COUNTRY, 2020 & 2030 (%)
FIGURE 28.COMPARATIVE SHARE ANALYSIS OF ENERGY HARVESTING SYSTEM MARKET FOR OTHERS, BY COUNTRY, 2020 & 2030 (%)
FIGURE 29.GLOBAL ENERGY HARVESTING SYSTEM MARKET, BY REGION, 2020–2030 ($MILLION)
FIGURE 30.U.S. ENERGY HARVESTING SYSTEM MARKET REVENUE, 2020–2030($MILLION)
FIGURE 31.CANADA ENERGY HARVESTING SYSTEM MARKET REVENUE, 2020–2030($MILLION)
FIGURE 32.MEXICO ENERGY HARVESTING SYSTEM MARKET REVENUE, 2020–2030($MILLION)
FIGURE 33.GERMANY ENERGY HARVESTING SYSTEM MARKET REVENUE, 2020–2030($MILLION)
FIGURE 34.FRANCE ENERGY HARVESTING SYSTEM MARKET REVENUE, 2020–2030($MILLION)
FIGURE 35.ITALY ENERGY HARVESTING SYSTEM MARKET REVENUE, 2020–2030($MILLION)
FIGURE 36.SPAIN ENERGY HARVESTING SYSTEM MARKET REVENUE, 2020–2030($MILLION)
FIGURE 37.UK ENERGY HARVESTING SYSTEM MARKET REVENUE, 2020–2030($MILLION)
FIGURE 38.REST OF EUROPE ENERGY HARVESTING SYSTEM MARKET REVENUE, 2020–2030($MILLION)
FIGURE 39.CHINA ENERGY HARVESTING SYSTEM MARKET REVENUE, 2020–2030($MILLION)
FIGURE 40.JAPAN ENERGY HARVESTING SYSTEM MARKET REVENUE, 2020–2030($MILLION)
FIGURE 41.INDIA ENERGY HARVESTING SYSTEM MARKET REVENUE, 2020–2030($MILLION)
FIGURE 42.SOUTH KOREA ENERGY HARVESTING SYSTEM MARKET REVENUE, 2020–2030($MILLION)
FIGURE 43.AUSTRALIA ENERGY HARVESTING SYSTEM MARKET REVENUE, 2020–2030($MILLION)
FIGURE 44.REST OF ASIA-PACIFIC ENERGY HARVESTING SYSTEM MARKET REVENUE, 2020–2030($MILLION)
FIGURE 45.BRAZIL ENERGY HARVESTING SYSTEM MARKET REVENUE, 2020–2030($MILLION)
FIGURE 46.SAUDI ARABIA ENERGY HARVESTING SYSTEM MARKET REVENUE, 2020–2030($MILLION)
FIGURE 47.SOUTH AFRICA ENERGY HARVESTING SYSTEM MARKET REVENUE, 2020–2030($MILLION)
FIGURE 48.REST OF LAMEA ENERGY HARVESTING SYSTEM MARKET REVENUE, 2020–2030($MILLION)
FIGURE 49.MARKET PLAYER POSITIONING, 2020
FIGURE 50.PRODUCT MAPPING OF TOP 10 PLAYERS
FIGURE 51.COMPETITIVE DASHBOARD
FIGURE 52.COMPETITIVE HEATMAP OF KEY PLAYERS


According to CXOs of leading companies, the global energy harvesting system market is expected to exhibit high growth potential, owing to its use in applications such wireless sensory nodes, mobile devices, and other biomedical implantable sensors. Rise in demand for energy has increased dependency on fossil fuels for production of energy. However, use of fossil fuels for production of energy leads to high carbon di-oxide emission that further leads to environmental degradation. Hence, to overcome this problem, there is development of energy harvesting techniques from building and urban infrastructure mainly roads. Annually large amount of energy in form of kinetic energy is wasted on roads. Thus, there are several developments in energy harvesting systems such as use of solar panels, piezoelectric devices, and thermoelectric & electromagnetic harvesters to harvest energy from roads are the major key market trends in the global market.

The transportation sector is the largest consumer of energy. For instance, the transportation sector in UK consumed about 56.5 million tons of oil out of which more than 97% was resourced from the oil industry. Consumption of such large amount of energy out of which some part of energy is wasted in the form of vibration and heat can be harvested. For instance, a moving truck in one lane with an average of 600 V/h of traffic can generate 150 kWh energy in one-kilometer range. This energy can be used to deform, vibrate, and warm up road surface and can be a good source of energy for harvesting and converting. Thus, implementation of energy harvesting techniques with proper use of systems is predicted to offer lucrative growth opportunities for the market in the future.

PURCHASE OPTIONS

Call or Email us

U.S.-Canada Toll-free: +1-800-792-5285
Int'l : +1-503-894-6022
Europe : +44-845-528-1300
Email : help@alliedmarketresearch.com
 
FREQUENTLY ASKED QUESTIONS?

A. Business expansion and acquisition are the key growth strategies of energy harvesting system market players.

A. Europe region will provide more business opportunities for energy harvesting system in future.

A. To get latest version of energy harvesting system market report can be obtained on demand from the website.

A. Building & home automation are the potential customers of energy Harvesting System industry.

A. By technology, the light energy harvesting segment holds the maximum share of the energy harvesting system market.

A. The top ten market players are selected based on two key attributes - competitive strength and market positioning

A. Rise in demand for light energy harvesting and escalating demand for vibration energy harvesting are the driving factors. While, growing demand for energy harvesting system in building & home automation is predicted to offer new opportunity in the global market.

A. Cymbet Corporation, Cedrat Technologies SA, Tekceleo, ZF Friedrichshafen AG, Physik Instrumente (PI) GmbH & Co. KG, Advanced Linear Devices Inc., Mide Technology Corporation, Powercast, Xidas, and Analog Devices are the leading global players in the energy harvesting system market.

A. It outlines the current energy harvesting system market trends and future estimations from 2020 to 2030 to understand the prevailing opportunities and potential investment pockets. In addition, the major countries in the region have been mapped according to their individual revenue contribution to the regional market

A. Vibration energy harvesting in industrial application is the key market trend. For instance, industrial pumps that are used to supply the water to machineries in order to keep them cool are monitored by monitoring systems. But however, these pumps need to be monitored continuously so that they do not break down and if the pumps break down then the whole plant need to be shut down for maintenance and repair. Thus, in order to continually power these monitoring systems several industries use vibrations that are generated from pumps to power these monitoring systems. Piezoelectric systems are widely used vibration energy harvesting systems that are utilized to power actuators and portable devices.

Looking for Customization?

 Customization Request

Have a Question?

 Speak with Analyst

Any Confusion?

 Inquire Before Buying

Have a glance of the Report

  Request Sample
RELATED TAGS

Purchase Full Report of
Energy Harvesting System Market

Start reading instantly.
This Report and over 67,404+ more Reports, Available with Avenue Library. T&C*.

  • Online Only
  • $3,456
  • Online cloud access only
  • Restricted print, copy, paste & download
  • Read only
  • Free industry update
    (Within 180 days)
  • Free report update in next update cycle
    (Sep 2022 - Sep 2023)
  • Data Pack
  • $3,840
  • Restricted to one authorized user
  • One print only
  • Available in
    Excel
  • Free industry update
    (Within 180 days)
  •   Free report update in next update cycle
    (Sep 2022 - Sep 2023)
  • Single User
  • $5,769
  • Restricted to one authorized user
  • One print only
  • Available in
    PDF
  • Free industry update
    (Within 180 days)
  •   Free report update in next update cycle
    (Sep 2022 - Sep 2023)
  • Five Users
  • $6,450
  • Limited to five authorized users
  • Print upto five copies
  • Available in
    PDF
  • Free industry update
    (Within 180 days)
  •   Free report update in next update cycle
    (Sep 2022 - Sep 2023)
  • Enterprise
    License/PDF

  • $10,995
  • Unlimited
    within
    company/enterprise
  • Available in Excel & PDF
  • Free industry update
    (Within 180 days)
  •   Free report update in next update cycle
    (Sep 2022 - Sep 2023)
  • Library
    Membership

  • $999 $ 1,175
    Per User/ Per month/ Billed annually
  • Published Content
    E-access
  • Company Profiles
    E-access
  • Newly Added Content Access
  • 10 PDF
    Downloads
  • 5 Excel Data
    Pack Downloads
  • 250 Company Profiles PDF Downloads
  • Buy Now

*Taxes/Fees, if applicable will be added during checkout. All prices in USD

RELATED REPORTS
 

Why Allied Market Research?


Infallible Methodology

To ensure high-level data integrity, accurate analysis, and impeccable forecasts

Analyst Support

For complete satisfaction

Customization

On-demand customization of scope of the report to exactly meet your needs

TARGETED MARKET VIEW

Targeted market view to provide pertinent information and save time of readers

Get fresh content delivered

Get insights on topics that are crucial for your business. Stay abreast of your interest areas.

Get Industry Data Alerts

Why Allied Market Research?

Infallible Methodology

To ensure high-level data integrity, accurate analysis, and impeccable forecasts

Analyst Support

For complete satisfaction

Customization

On-demand customization of scope of the report to exactly meet your needs

TARGETED MARKET VIEW

Targeted market view to provide pertinent information and save time of readers