
Enterprise Asset Leasing Market Research, 2032
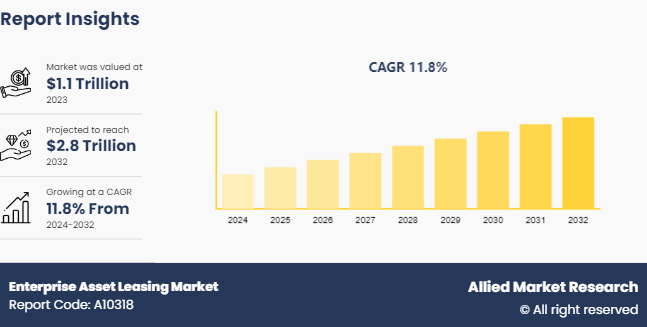
The global enterprise asset leasing market was valued at $1.1 trillion in 2023, and is projected to reach $2.8 trillion by 2032, growing at a CAGR of 11.8% from 2024 to 2032. The market is experiencing significant growth driven by increased demand for flexible financing solutions and the rise of capital-intensive industries. This growth is further fueled by technological advancements and the need for businesses to optimize asset utilization while preserving cash flow.
Market Introduction and Definition
The enterprise asset leasing industry is a contract that allows businesses to use an asset owned by another party (lessor) for a specific period in exchange for regular payments. The lessor retains ownership of the asset, while the lessee has the right to use it. Businesses often lease assets such as vehicles, machinery, real estate, and IT equipment through enterprise asset leasing. This arrangement enables companies to access assets without large upfront investments, which can benefit startups and small businesses. The enterprise asset leasing industry involves a contractual agreement where a lessor grants rights to a lessee to use assets such as vehicles, machinery, real estate, and IT equipment for a specified period in exchange for regular payments. The lessor retains ownership, while the lessee has the right to utilize the asset.
Key Takeaways
The enterprise asset leasing market study covers 20 countries. The research includes a segment analysis of each country in terms of enterprise asset leasing market size ($Trillion) for the projected enterprise asset leasing market forecast 2023-2032.
More than 1, 500 product literature, industry releases, annual reports, and other such documents of major energy storage system industry participants along with authentic industry journals, trade associations' releases, and government websites have been reviewed for generating high-value industry insights.
The study integrated high-quality data, professional opinions and analysis, and critical independent perspectives. The research approach is intended to provide a balanced view of global markets and to assist stakeholders in making educated decisions to achieve their most ambitious enterprise asset leasing market growth objectives.
Key market dynamics
Businesses must save money by using enterprise asset leasing in the enterprise asset leasing market. Businesses can avoid the high upfront costs of buying properties and equipment by leasing assets, which is particularly advantageous for start-ups and small enterprises with little funding. In addition, leasing enables companies to amortize the cost of asset acquisition over time, facilitating budgeting and cash flow management. In addition, during the forecast period of the enterprise asset leasing market, the tendency to outsource non-core activities is probably going to increase the demand for enterprise asset leasing. Businesses can free up time to concentrate on their core competencies by leasing assets, which relieves them of the responsibility of managing and maintaining their own machinery and real estate. This tendency has been particularly noticeable in sectors like manufacturing, construction, and transportation. Also, technological advancements are likely to contribute to the growth of the enterprise asset leasing market. As leasing companies leverage technology to improve asset tracking and management, they can offer higher quality and more efficient leased assets to their customers.
For example, cloud-based asset management solutions allow businesses in the enterprise asset leasing market to track and manage their leased assets in real-time, making it easier to monitor usage, maintenance, and repairs. The practice of outsourcing non-core functions is growing in popularity as companies in the enterprise asset leasing market search for methods to increase their productivity and competitiveness. Businesses can cut expenses and free up resources to invest in their core operations by outsourcing tasks like IT infrastructure, transportation, and equipment maintenance. This tendency is particularly noticeable in sectors such as manufacturing and transportation, where businesses must keep substantial inventories of machinery and other assets to sustain their operations. Leasing companies in the enterprise asset leasing market can also give businesses the tools and spaces they require to support their non-core operations. A vast array of assets, such as real estate properties, cars, construction equipment, and IT equipment, are available for lease through leasing businesses.
PESTLE ANALYSIS
PESTLE analysis is a strategic framework used to evaluate the external environment influencing an industry or market. Here is a PESTLE analysis for the enterprise asset leasing market:
Political Aspects
Trade Policies: Tariffs and international trade agreements may influence the availability and pricing of leased assets, particularly for businesses that conduct business internationally.
Political Stability: While political instability can result in uncertainty and disruptions in leasing operations, stable political conditions encourage market expansion.
Economic Factors
Economic Growth: Businesses' investments in leased assets are influenced by the state of the economy. Robust economic expansion increases demand, whereas recessions may result in a decline in leasing activity.
Social Elements
Business Confidence: Leasing decisions are influenced by business sentiment and confidence levels. A rise in investment in leased assets is a result of higher confidence of businesses.
Workplace Trends: The demand for some types of leased assets, such as office equipment and commercial real estate, might change in response to changes in workplace norms, such as remote work.
Aspects of Technology
Technological Advancements: Automation, digital leasing platforms, and asset management software innovations all enhance leasing market efficiency and client satisfaction.
Asset Lifecycles: Quick advances in technology have the potential to decrease asset lifetimes, which could impact the preference for leasing over buying.
Legal Aspects
Compliance Requirements: Leasing firms must abide by several legal requirements, such as industry-specific legislation, financial reporting standards, and contract laws.
Laws Protecting Consumers: Lease terms and conditions may be impacted by regulations designed to safeguard lessees.
Environmental Elements
Sustainability Trends: Leasing eco-friendly and energy-efficient properties is in high demand as environmental responsibility and sustainability become more and more important.
Environmental Impact: Since leasing enables a better asset life cycle and disposal management, businesses may choose to lease to reduce their environmental impact.
Market Segmentation
The enterprise asset leasing market is segmented into asset type, leasing type, industry vertical, enterprise size, and region. By asset type, the enterprise asset leasing market is divided into commercial vehicles, machinery and industrial equipment, real estate, and others. By leasing type, the market is segregated into an operating lease and a financial lease. By industry vertical, the market is divided into transportation & logistics, manufacturing, construction, IT & telecom, government & public sector, and others. By enterprise size, it is divided into large enterprises and medium–and small enterprises. Region-wise, the market is analyzed across North America, Europe, Asia-Pacific, and LAMEA.
Regional/Country Enterprise Asset Leasing Market Outlook
All the major regional markets, including those in North America (the U.S. and Canada), Asia-Pacific (China, Japan, India, South Korea, Australia, Indonesia, and others), Europe (Germany, France, the UK, Italy, Spain, Russia, and others), and LAMEA have been thoroughly analyzed in this market research report. The report states that because of its sophisticated financial infrastructure, North America held the biggest market share. Accordingly, the enterprise asset leasing market is expanding due to the growing use of asset leasing, which enables businesses to regularly update their technology and equipment without having to bear the cost of ownership while fostering efficiency and competitiveness. In addition, the region's advantageous regulatory frameworks are driving the market growth. Asia-Pacific stands as another key region in the market, driven by the growing demand for leasing assets to support operations in companies.
Industry Trends
In August 2023, Transcat, a leading provider of calibration services and value-added distributor of professional-grade handheld test, measurement, and control instrumentation, acquired all the capital stock of Axiom Test Equipment, Inc. The $38 million purchase price was paid in a combination of $28 million in stock and $10 million in cash. Axiom, a well-established rental provider of Electronic Test Equipment, is expected to expand Transcat's existing rental offering and create opportunities for accelerated growth.
In February 2024, Financial leasing in Vietnam has high potential due to its dynamic economy and the country's attractiveness for foreign direct investment. With over 800, 000 enterprises and 5 million business households, financial leasing has high potential. The amended Law on Credit Institutions is expected to provide a legal framework for financial leasing services of the enterprise asset leasing market, with outstanding loans projected to expand by 20% to VN?45 trillion by 2024.
Competitive Landscape
The major players operating in the enterprise asset leasing market include General Electric, ICBC Leasing Co Ltd, Bohai Leasing Co Ltd, BNP Paribas Leasing Solutions, Hitachi Capital Plc, Orix Leasing and Financial Services India Limited, Lombard North Central Plc, Societe Generale Equipment Finance, and White Oak. Other players in the enterprise asset leasing market include ICBC Financial Leasing Co. Ltd (Industrial and Commercial Bank of China Limited), Mexarrend S.A.P.I. de C.V., Mitsubishi HC Capital Inc., and National Westminster Bank plc.
Recent Key Strategies and Developments
In March 2023, BNP Paribas, a European leader in leasing and renting solutions for business equipment, partnered with Kyndryl to provide IT infrastructure management services on IBM technology, data center services, and disaster recovery solutions. The services provided by Kyndryl allow BNP Paribas Leasing Solutions to access private cloud infrastructure on a flexible usage model to host its partner platform in Portugal.
In October 2023, Societe Generale partnered with Volta Trucks to expand truck as a service lease offering for individuals. It is offering operating and finance lease funding programs to support client agreements in the Europe enterprise asset leasing market.
Key Sources Referred
Axiom Test Equipment, Inc.
BNP Paribas
Kyndryl
Key Benefits For Stakeholders
- This report provides a quantitative analysis of the market segments, current trends, estimations, and dynamics of the enterprise asset leasing market analysis from 2024 to 2032 to identify the prevailing enterprise asset leasing market opportunities.
- The market research is offered along with information related to key drivers, restraints, and opportunities.
- Porter's five forces analysis highlights the potency of buyers and suppliers to enable stakeholders make profit-oriented business decisions and strengthen their supplier-buyer network.
- In-depth analysis of the enterprise asset leasing market segmentation assists to determine the prevailing market enterprise asset leasing market opportunity.
- Major countries in each region are mapped according to their revenue contribution to the global market.
- Market player positioning facilitates benchmarking and provides a clear understanding of the present position of the market players.
- The report includes the analysis of the regional as well as global enterprise asset leasing market trends, key players, market segments, application areas, enterprise asset leasing market share and market growth strategies.
Enterprise Asset Leasing Market Report Highlights
| Aspects | Details |
| Market Size By 2032 | USD 2.8 Trillion |
| Growth Rate | CAGR of 11.8% |
| Forecast period | 2024 - 2032 |
| Report Pages | 225 |
| By Asset Type |
|
| By Leasing Type |
|
| By Industry Vertical |
|
| By Enterprises Size |
|
| By Region |
|
| Key Market Players | General Electric, Societe Generale Equipment Finance, BNP Paribas Leasing Solutions, Bohai Leasing Co Ltd, Hitachi Capital Plc, White Oak Company, LLC, Lombard North Central Plc, Orix Leasing and Financial Services India Limited, ICBC Leasing Co Ltd |
An increase in the trend of outsourcing non-core activities and growing demand for commercial vehicles are the upcoming drivers of the Enterprise Asset Leasing Market in the globe.
$2.8 trillion is the estimated industry size of the Enterprise Asset Leasing Market by 2032.
North America is the fastest growing for Enterprise Asset Leasing Market in 2023.
Leasing eco-friendly and energy-efficient properties is in high demand as environmental responsibility and sustainability are the environmental elements that impact the Enterprise Asset Leasing Market.
General Electric, ICBC Leasing Co Ltd, Bohai Leasing Co Ltd, BNP Paribas Leasing Solutions, Hitachi Capital Plc, and Orix Leasing are the top companies to hold the market share in the Enterprise Asset Leasing Market.
Loading Table Of Content...

