Report Code: A13059 | Aug 2021 | Pages: 350 | ||
Tables: 226 | Charts: 74 |
|
Pandemic disrupted the entire world and affected many industries.
Get detailed COVID-19 impact analysis on the Epoxy Curing Agents Market
Request Now !
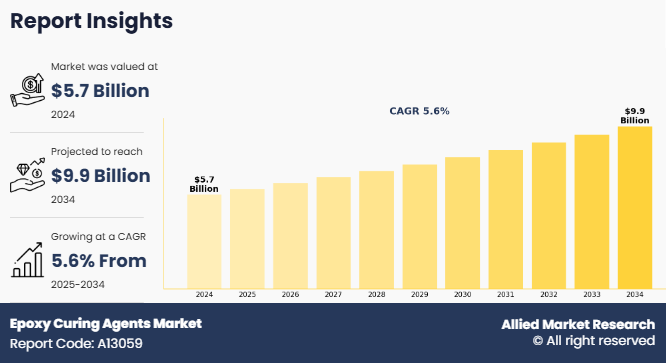
The global epoxy curing agents market size was valued at $4.9 billion in 2020, and epoxy curing agents market forecast projected to reach $8.4 billion by 2030, with global epoxy curing agents market forecast expected at a CAGR of 5.6% from 2021 to 2030.
Owing to COVID-19, the shutdown of various industry production facilities in construction, industrial, and transportation sectors has led to decline in the demand for epoxy curing agents.
Epoxy resin systems are divided into two parts: "A" side and a "B" side. The epoxy curing agent is found on the B side, commonly known as the "hardener," and is responsible for interacting with the epoxy groups in the epoxy resin A side. Curing agents react with epoxy resins to produce rigid, thermoset materials. Epoxy curing agents are of several types majorly amines, polyamides and anhydrides. The increasing demand of epoxy curing agents from the building & construction industry and new innovative developments in light-weight materials are the major factors driving the demand for the epoxy curing agents industry during the forecast period. The usage of lightweight materials in different industrial sectors, such as aerospace and automotive, is encouraged by strict regulatory rules and quality standards. Furthermore, epoxy curing agents are in high demand for the production of printed circuit boards (PCBs), which are utilized in a wide range of electronic goods, including mobile phones, smartphones, automotive electronics, equipment, and other consumer electronics. As a result, rising demand for epoxy curing agents as a lightweight raw material in a variety of industrial applications will continue to have a positive influence on epoxy curing agents market trend in the coming years. In addition, increase in demand for paints and coating in the construction sector, especially for flooring and interior painting will provide a good opportunity for the growth of amine-based epoxy curing agents. Due to excellent thermal and electrical insulating properties of epoxy curing agents and excellent mechanical properties, epoxy curing agents market is expected to possess high market growth due to rapid development in wind and solar energy and increase in demand for a variety of industrial tools around the globe. Due to rapidly increasing demand of epoxy curing agents across the globe, manufacturers are expanding their global footprints in order to gain increased customer base. For instance, in 2018, BASF SE, a German chemical firm that specializes in epoxy curing agents, has expanded its regional collaboration with Gustav Grolman GmbH & Co. KG, a specialty materials distributor, to sell amine-based curing agents for professional epoxy resin processing across Europe.
During the production of epoxy curing agents, manufacturers must follow strict regulations as it has toxicity effect, due to its VOC (Volatile Organic Compound) in nature that may lead to dermatitis. During the production, epoxy curing agents can also produce harmful gases that can cause global warming and pollution. Hence, manufacturers are practicing new innovative methods to reduce problems faced while manufacturing epoxy curing agents. This is a key restraining factor for the growth of epoxy curing agents market.
The global epoxy curing agents market is segmented on the basis of curing agent, application, end user and region.
On the basis of curing agent, the global epoxy curing agents market is segmented into amines, polyamides, anhydrides and others. The applications covered in the study include paints & coating, adhesives, composites and electronic encapsulation & others. The end users covered in the study include building & construction, transportation, general industrial, wind power, aerospace and marine & others.
Region wise, the market is studied across North America, Europe, Asia-Pacific, and LAMEA. Presently, Asia-Pacific accounts for the largest share of the market, followed by Europe and North America.
The major companies profiled in this report include Bhor Chemicals and Plastics Private Limited. Cytec Solvay Group, Atul Ltd., Mitsubishi Chemical Corporation, Park Aerospace Corp., Reliance Composites Polymers, Barrday Inc., Hexcel Corporation, Huntsmann Corporation and Evonik Industries AG.
Key findings of the study
Impact Of Covid-19 On The Global Epoxy Curing Agents Market
Key Market Segments
By Curing Agent
By Application
By End User
By Region
Key players in the global epoxy curing agents market are:
Epoxy Curing Agents Market Report Highlights
Aspects | Details |
---|---|
By Curing Agent |
|
By Application |
|
By End User |
|
By Region |
|
Key Market Players | Cytec Solvay Group, Huntsmann Corporation, Bhor Chemicals and Plastics Private Limited, Park Aerospace Corp., Reliance Composites Polymers, Hexcel Corporation, Atul Ltd., Mitsubishi Chemical Corporation, Evonik Industries AG, Barrday Inc. |
CHAPTER 1: INTRODUCTION
1.1. Key benefits for stakeholders
1.2. Key market segments
1.3. Research methodology
1.3.1. Secondary research
1.3.2. Primary research
1.4. Analyst tools and models
CHAPTER 2: EXECUTIVE SUMMARY
2.1. Key findings of the study
2.2. CXO perspective
CHAPTER 3: MARKET OVERVIEW
3.1. Market definition and scope
3.2. Key findings
3.2.1. Top investment pockets
3.3. Porter’s five forces analysis
3.4. Market dynamics
3.4.1. Drivers
3.4.1.1. Increase in demand for materials used in construction and transport industry
3.4.1.2. Increase in demand for efficient wind and solar power plants
3.4.2. Restraint
3.4.2.1. Stringent regulations and increase in environmental awareness among the consumers
3.4.3. Opportunity
3.4.3.1. Rapid increase in demand from data centers
3.5. Pricing analysis
3.6. Value chain analysis
3.7. Impact of key regulations on the global epoxy curing agents market
3.8. Impact of COVID-19 on the global epoxy curing agents market
CHAPTER 4: EPOXY CURING AGENTS MARKET, BY CURING AGENT
4.1. Overview
4.1.1. Market size and forecast
4.2. Amines
4.2.1. Key market trends, growth factors, and opportunities
4.2.2. Market size and forecast, by region
4.2.3. Comparative share analysis, by country
4.3. Polyamides
4.3.1. Key market trends, growth factors, and opportunities
4.3.2. Market size and forecast, by region
4.3.3. Comparative share analysis, by country
4.4. Anhydrides
4.4.1. Key market trends, growth factors, and opportunities
4.4.2. Market size and forecast, by region
4.4.3. Comparative share analysis, by country
4.5. Others
4.5.1. Key market trends, growth factors, and opportunities
4.5.2. Market size and forecast, by region
4.5.3. Comparative share analysis, by country
CHAPTER 5: EPOXY CURING AGENTS MARKET, BY APPLICATION
5.1. Overview
5.1.1. Market size and forecast
5.2. Paints and coating
5.2.1. Key market trends, growth factors, and opportunities
5.2.2. Market size and forecast, by region
5.2.3. Comparative Share Analysis by Country
5.3. Adhesives
5.3.1. Key market trends, growth factors, and opportunities
5.3.2. Market size and forecast, by region
5.3.3. Comparative share analysis by country
5.4. Composites
5.4.1. Key market trends, growth factors, and opportunities
5.4.2. Market size and forecast, by region
5.4.3. Comparative Share Analysis by Country
5.5. Electronic encapsulation & others
5.5.1. Key market trends, growth factors, and opportunities
5.5.2. Market size and forecast, by region
5.5.3. Comparative Share Analysis by Country
CHAPTER 6: EPOXY CURING AGENTS MARKET, BY END USER
6.1. Overview
6.1.1. Market size and forecast
6.2. Building & construction
6.2.1. Key market trends, growth factors, and opportunities
6.2.2. Market size and forecast, by region
6.2.3. Comparative Share Analysis by Country
6.3. Transportation
6.3.1. Key market trends, growth factors, and opportunities
6.3.2. Market size and forecast, by region
6.3.3. Comparative share analysis by country
6.4. General Industrial
6.4.1. Key market trends, growth factors, and opportunities
6.4.2. Market size and forecast, by region
6.4.3. Comparative Share Analysis by Country
6.5. Wind power
6.5.1. Key market trends, growth factors, and opportunities
6.5.2. Market size and forecast, by region
6.5.3. Comparative Share Analysis by Country
6.6. Aerospace
6.6.1. Key market trends, growth factors, and opportunities
6.6.2. Market size and forecast, by region
6.6.3. Comparative Share Analysis by Country
6.7. Marine & others
6.7.1. Key market trends, growth factors, and opportunities
6.7.2. Market size and forecast, by region
6.7.3. Comparative Share Analysis by Country
CHAPTER 7: EPOXY CURING AGENTS MARKET, BY REGION
7.1. Overview
7.1.1. Market size and forecast, by region
7.2. North America
7.2.1. Key market trends, growth factors, and opportunities
7.2.2. Market size and forecast, by curing agent
7.2.3. Market size and forecast, by application
7.2.4. Market size and forecast, by end user
7.2.5. Market analysis, by country
7.2.5.1. U.S.
7.2.5.1.1. Market size and forecast, by curing agent
7.2.5.1.2. Market size and forecast, by application
7.2.5.1.3. Market size and forecast, by end user
7.2.5.2. Canada
7.2.5.2.1. Market size and forecast, by curing agent
7.2.5.2.2. Market size and forecast, by application
7.2.5.2.3. Market size and forecast, by end user
7.2.5.3. Mexico
7.2.5.3.1. Market size and forecast, by curing agent
7.2.5.3.2. Market size and forecast, by application
7.2.5.3.3. Market size and forecast, by end user
7.3. Europe
7.3.1. Key market trends, growth factors, and opportunities
7.3.2. Market size and forecast, by curing agent
7.3.3. Market size and forecast, by application
7.3.4. Market size and forecast, by end user
7.3.5. Market analysis, by country
7.3.5.1. Germany
7.3.5.1.1. Market size and forecast, by curing agent
7.3.5.1.2. Market size and forecast, by application
7.3.5.1.3. Market size and forecast, by end user
7.3.5.2. France
7.3.5.2.1. Market size and forecast, by curing agent
7.3.5.2.2. Market size and forecast, by application
7.3.5.2.3. Market size and forecast, by end user
7.3.5.3. Italy
7.3.5.3.1. Market size and forecast, by curing agent
7.3.5.3.2. Market size and forecast, by application
7.3.5.3.3. Market size and forecast, by end user
7.3.5.4. Spain
7.3.5.4.1. Market size and forecast, by curing agent
7.3.5.4.2. Market size and forecast, by application
7.3.5.4.3. Market size and forecast, by end user
7.3.5.5. UK
7.3.5.5.1. Market size and forecast, by curing agent
7.3.5.5.2. Market size and forecast, by application
7.3.5.5.3. Market size and forecast, by end user
7.3.5.6. Rest of Europe
7.3.5.6.1. Market size and forecast, by curing agent
7.3.5.6.2. Market size and forecast, by application
7.3.5.6.3. Market size and forecast, by end user
7.4. Asia-Pacific
7.4.1. Key market trends, growth factors, and opportunities
7.4.2. Market size and forecast, by curing agent
7.4.3. Market size and forecast, by application
7.4.4. Market size and forecast, by end user
7.4.5. Market analysis, by country
7.4.5.1. China
7.4.5.1.1. Market size and forecast, by curing agent
7.4.5.1.2. Market size and forecast, by application
7.4.5.1.3. Market size and forecast, by end user
7.4.5.2. Japan
7.4.5.2.1. Market size and forecast, by curing agent
7.4.5.2.2. Market size and forecast, by application
7.4.5.2.3. Market size and forecast, by end user
7.4.5.3. India
7.4.5.3.1. Market size and forecast, by curing agent
7.4.5.3.2. Market size and forecast, by application
7.4.5.3.3. Market size and forecast, by end user
7.4.5.4. South Korea
7.4.5.4.1. Market size and forecast, by curing agent
7.4.5.4.2. Market size and forecast, by application
7.4.5.4.3. Market size and forecast, by end user
7.4.5.5. Rest of Asia-Pacific
7.4.5.5.1. Market size and forecast, by curing agent
7.4.5.5.2. Market size and forecast, by application
7.4.5.5.3. Market size and forecast, by end user
7.5. LAMEA
7.5.1. Key market trends, growth factors, and opportunities
7.5.2. Market size and forecast, by curing agent
7.5.3. Market size and forecast, by application
7.5.4. Market size and forecast, by end user
7.5.5. Market analysis, by country
7.5.5.1. Brazil
7.5.5.1.1. Market size and forecast, by curing agent
7.5.5.1.2. Market size and forecast, by application
7.5.5.1.3. Market size and forecast, by end user
7.5.5.2. Saudi Arabia
7.5.5.2.1. Market size and forecast, by curing agent
7.5.5.2.2. Market size and forecast, by application
7.5.5.2.3. Market size and forecast, by end user
7.5.5.3. South Africa
7.5.5.3.1. Market size and forecast, by curing agent
7.5.5.3.2. Market size and forecast, by application
7.5.5.3.3. Market size and forecast, by end user
7.5.5.4. Rest of LAMEA
7.5.5.4.1. Market size and forecast, by curing agent
7.5.5.4.2. Market size and forecast, by application
7.5.5.4.3. Market size and forecast, by end user
CHAPTER 8: COMPETITIVE LANDSCAPE
8.1. Introduction
8.1.1. Market player positioning, 2020
8.2. Top winning strategies
8.2.1. Top winning strategies, by year
8.2.2. Top winning strategies, by development
8.2.3. Top winning strategies, by company
8.3. Product mapping of top 10 player
8.4. Competitive dashboard
8.5. Competitive heatmap
8.6. Key developments
8.6.1. Business expansions
8.6.2. Other developments
CHAPTER 9: COMPANY PROFILES
9.1. Park Aerospace Corp
9.1.1. Company overview
9.1.2. Key executives
9.1.3. Company snapshot
9.1.4. Operating business segments
9.1.5. Product portfolio
9.1.6. Business performance
9.1.7. Key strategic moves and developments
9.2. EVONIK INDUSTRIES
9.2.1. Company overview
9.2.2. Key executives
9.2.3. Company snapshot
9.2.4. Operating business segments
9.2.5. Product portfolio
9.2.6. R&D expenditure
9.2.7. Business performance
9.3. Reliance composites polymers
9.3.1. Company overview
9.3.2. Key executives
9.3.3. Company snapshot
9.3.4. Product portfolio
9.4. Hexcel Corporation
9.4.1. Company overview
9.4.2. Key executives
9.4.3. Company snapshot
9.4.4. Operating business segments
9.4.5. Product portfolio
9.4.6. Business performance
9.4.7. Key strategic moves and developments
9.5. MITSUBUSHI CHEMICAL HOLDINGS
9.5.1. Company overview
9.5.2. Key executives
9.5.3. Company snapshot
9.5.4. Operating business segments
9.5.5. Product portfolio
9.5.6. R&D expenditure
9.5.7. Business performance
9.6. CYTEC Solvay Group
9.6.1. Company overview
9.6.2. Key executives
9.6.3. Company snapshot
9.6.4. Operating business segments
9.6.5. Product portfolio
9.6.6. Business performance
9.7. Huntsman Corporation
9.7.1. Company overview
9.7.2. Key executives
9.7.3. Company snapshot
9.7.4. Operating business segments
9.7.5. Product portfolio
9.7.6. Business performance
9.7.7. Key strategic moves and developments
9.8. Barryday Corporation
9.8.1. Company overview
9.8.2. Key executives
9.8.3. Company snapshot
9.8.4. Product portfolio
9.9. Bhor chemicals and plastics private limited
9.9.1. Company overview
9.9.2. Key executives
9.9.3. Company snapshot
9.9.4. Product portfolio
9.10. Atul Ltd
9.10.1. Company overview
9.10.2. Key executives
9.10.3. Company snapshot
9.10.4. Operating business segments
9.10.5. Product portfolio
9.10.6. Business performance
9.10.7. Key strategic moves and developments
LIST OF TABLES
TABLE 01. PRICING ANALYSIS, BY CURING AGENT, 2020–2030 ($/TON)
TABLE 02. PRICING ANALYSIS, BY REGION, 2020–2030 ($/TON)
TABLE 03. EPOXY CURING AGENTS MARKET, BY CURING AGENT, 2020–2030 (KILOTONS)
TABLE 04. EPOXY CURING AGENTS MARKET, BY CURING AGENT, 2020–2030 ($MILLION)
TABLE 05. AMINES CURING AGENT MARKET, BY REGION, 2020–2030 (KILOTONS)
TABLE 06. AMINES CURING AGENT MARKET, BY REGION, 2020–2030 ($MILLION)
TABLE 07. POLYAMIDES CURING AGENT MARKET, BY REGION, 2020–2030 (KILOTONS)
TABLE 08. POLYAMIDES CURING AGENT MARKET, BY REGION, 2020–2030 ($MILLION)
TABLE 09. ANHYDRIDES CURING AGENT MARKET, BY REGION, 2020–2030 (KILOTONS)
TABLE 10. ANHYDRIDES CURING AGENT MARKET, BY REGION, 2020–2030 ($MILLION)
TABLE 11. OTHERS CURING AGENT MARKET, BY REGION, 2020–2030 (KILOTONS)
TABLE 12. OTHERS CURING AGENT MARKET, BY REGION, 2020–2030 ($MILLION)
TABLE 13. EPOXY CURING AGENTS MARKET, BY APPLICATION, 2020–2030 (KILOTONS)
TABLE 14. EPOXY CURING AGENTS MARKET, BY APPLICATION, 2020–2030 ($MILLION)
TABLE 15. EPOXY CURING AGENTS MARKET FOR PAINTS AND COATING, BY REGION, 2020–2030 (KILOTONS)
TABLE 16. EPOXY CURING AGENTS MARKET FOR PAINTS AND COATING, BY REGION, 2020–2030 ($MILLION)
TABLE 17. EPOXY CURING AGENTS MARKET FOR ADHESIVES, BY REGION, 2020–2030 (KILOTONS)
TABLE 18. EPOXY CURING AGENTS MARKET FOR ADHESIVES, BY REGION, 2020–2030 ($MILLION)
TABLE 19. EPOXY CURING AGENTS MARKET FOR COMPOSITES, BY REGION, 2020–2030 (KILOTONS)
TABLE 20. EPOXY CURING AGENTS MARKET FOR COMPOSITES, BY REGION, 2020–2030 ($MILLION)
TABLE 21. EPOXY CURING AGENTS MARKET FOR ELECTRONIC ENCAPSULATION & OTHERS, BY REGION, 2020–2030 (KILOTONS)
TABLE 22. EPOXY CURING AGENTS MARKET FOR ELECTRONIC ENCAPSULATION & OTHERS, BY REGION, 2020–2030 ($MILLION)
TABLE 23. EPOXY CURING AGENTS MARKET, BY END USER, 2020–2030 (KILOTONS)
TABLE 24. EPOXY CURING AGENTS MARKET, BY END USER, 2020–2030 ($MILLION)
TABLE 25. EPOXY CURING AGENTS MARKET FOR BUILDING & CONSTRUCTION, BY REGION, 2020–2030 (KILOTONS)
TABLE 26. EPOXY CURING AGENTS MARKET FOR BUILDING & CONSTRUCTION, BY REGION, 2020–2030 ($MILLION)
TABLE 27. EPOXY CURING AGENTS MARKET FOR TRANSPORTATION, BY REGION, 2020–2030 (KILOTONS)
TABLE 28. EPOXY CURING AGENTS MARKET FOR TRANSPORATION, BY REGION, 2020–2030 ($MILLION)
TABLE 29. EPOXY CURING AGENTS MARKET FOR GENERAL INDUSTRIAL, BY REGION, 2020–2030 (KILOTONS)
TABLE 30. EPOXY CURING AGENTS MARKET FOR GENERAL INDUSTRIAL, BY REGION, 2020–2030 ($MILLION)
TABLE 31. EPOXY CURING AGENTS MARKET FOR WIND POWER, BY REGION, 2020–2030 (KILOTONS)
TABLE 32. EPOXY CURING AGENTS MARKET FOR WIND POWER, BY REGION, 2020–2030 ($MILLION)
TABLE 33. EPOXY CURING AGENTS MARKET FOR AEROSPACE, BY REGION, 2020–2030 (KILOTONS)
TABLE 34. EPOXY CURING AGENTS MARKET FOR AEROSPACE, BY REGION, 2020–2030 ($MILLION)
TABLE 35. EPOXY CURING AGENTS MARKET FOR MARINE & OTHERS, BY REGION, 2020–2030 (KILOTONS)
TABLE 36. EPOXY CURING AGENTS MARKET FOR MARINE & OTHERS, BY REGION, 2020–2030 ($MILLION)
TABLE 37. EPOXY CURING AGENTS MARKET, BY REGION, 2020-2030 (KILOTONS)
TABLE 38. EPOXY CURING AGENTS MARKET, BY REGION, 2020-2030 ($MILLION)
TABLE 39. NORTH AMERICA EPOXY CURING AGENTS MARKET, BY CURING AGENT, 2020-2030 (KILOTONS)
TABLE 40. NORTH AMERICA EPOXY CURING AGENTS MARKET, BY CURING AGENT, 2020-2030 ($MILLION)
TABLE 41. NORTH AMERICA EPOXY CURING AGENTS MARKET, BY APPLICATION, 2020-2030 (KILOTONS)
TABLE 42. NORTH AMERICA EPOXY CURING AGENTS MARKET, BY APPLICATION, 2020-2030 ($MILLION)
TABLE 43. NORTH AMERICA EPOXY CURING AGENTS MARKET, BY END USER, 2020-2030 (KILOTONS)
TABLE 44. NORTH AMERICA EPOXY CURING AGENTS MARKET, BY END USER, 2020-2030 ($MILLION)
TABLE 45. NORTH AMERICA EPOXY CURING AGENTS MARKET, BY COUNTRY, 2020-2030 (KILOTONS)
TABLE 46. NORTH AMERICA EPOXY CURING AGENTS MARKET, BY COUNTRY, 2020-2030 ($MILLION)
TABLE 47. U.S. EPOXY CURING AGENTS MARKET, BY CURING AGENT, 2020-2030 (KILOTONS)
TABLE 48. U.S. EPOXY CURING AGENTS MARKET, BY CURING AGENT, 2020-2030 ($MILLION)
TABLE 49. U.S. EPOXY CURING AGENTS MARKET, BY APPLICATION, 2020-2030 (KILOTONS)
TABLE 50. U.S. EPOXY CURING AGENTS MARKET, BY APPLICATION, 2020-2030 ($MILLION)
TABLE 51. U.S. EPOXY CURING AGENTS MARKET, BY END USER, 2020-2030 (KILOTONS)
TABLE 52. U.S. EPOXY CURING AGENTS MARKET, BY END USER, 2020-2030 ($MILLION)
TABLE 53. CANADA EPOXY CURING AGENTS MARKET, BY CURING AGENT, 2020-2030 (KILOTONS)
TABLE 54. CANADA EPOXY CURING AGENTS MARKET, BY CURING AGENT, 2020-2030 ($MILLION)
TABLE 55. CANADA EPOXY CURING AGENTS MARKET, BY APPLICATION, 2020-2030 (KILOTONS)
TABLE 56. CANADA EPOXY CURING AGENTS MARKET, BY APPLICATION, 2020-2030 ($MILLION)
TABLE 57. CANADA EPOXY CURING AGENTS MARKET, BY END USER, 2020-2030 (KILOTONS)
TABLE 58. CANADA EPOXY CURING AGENTS MARKET, BY END USER, 2020-2030 ($MILLION)
TABLE 59. MEXICO EPOXY CURING AGENTS MARKET, BY CURING AGENT, 2020-2030 (KILOTONS)
TABLE 60. MEXICO EPOXY CURING AGENTS MARKET, BY CURING AGENT, 2020-2030 ($MILLION)
TABLE 61. MEXICO EPOXY CURING AGENTS MARKET, BY APPLICATION, 2020-2030 (KILOTONS)
TABLE 62. MEXICO EPOXY CURING AGENTS MARKET, BY APPLICATION, 2020-2030 ($MILLION)
TABLE 63. MEXICO EPOXY CURING AGENTS MARKET, BY END USER, 2020-2030 (KILOTONS)
TABLE 64. MEXICO EPOXY CURING AGENTS MARKET, BY END USER, 2020-2030 ($MILLION)
TABLE 65. EUROPE EPOXY CURING AGENTS MARKET, BY CURING AGENT, 2020-2030 (KILOTONS)
TABLE 66. EUROPE EPOXY CURING AGENTS MARKET, BY CURING AGENT, 2020-2030 ($MILLION)
TABLE 67. EUROPE EPOXY CURING AGENTS MARKET, BY APPLICATION, 2020-2030 (KILOTONS)
TABLE 68. EUROPE EPOXY CURING AGENTS MARKET, BY APPLICATION, 2020-2030 ($MILLION)
TABLE 69. EUROPE EPOXY CURING AGENTS MARKET, BY END USER, 2020-2030 (KILOTONS)
TABLE 70. EUROPE EPOXY CURING AGENTS MARKET, BY END USER, 2020-2030 ($MILLION)
TABLE 71. EUROPE EPOXY CURING AGENTS MARKET, BY COUNTRY, 2020-2030 (KILOTONS)
TABLE 72. EUROPE EPOXY CURING AGENTS MARKET, BY COUNTRY, 2020-2030 ($MILLION)
TABLE 73. GERMANY EPOXY CURING AGENTS MARKET, BY CURING AGENT, 2020-2030 (KILOTONS)
TABLE 74. GERMANY EPOXY CURING AGENTS MARKET, BY CURING AGENT, 2020-2030 ($MILLION)
TABLE 75. GERMANY EPOXY CURING AGENTS MARKET, BY APPLICATION, 2020-2030 (KILOTONS)
TABLE 76. GERMANY EPOXY CURING AGENTS MARKET, BY APPLICATION, 2020-2030 ($MILLION)
TABLE 77. GERMANY EPOXY CURING AGENTS MARKET, BY END USER, 2020-2030 (KILOTONS)
TABLE 78. GERMANY EPOXY CURING AGENTS MARKET, BY END USER, 2020-2030 ($MILLION)
TABLE 79. FRANCE EPOXY CURING AGENTS MARKET, BY CURING AGENT, 2020-2030 (KILOTONS)
TABLE 80. FRANCE EPOXY CURING AGENTS MARKET, BY CURING AGENT, 2020-2030 ($MILLION)
TABLE 81. FRANCE EPOXY CURING AGENTS MARKET, BY APPLICATION, 2020-2030 (KILOTONS)
TABLE 82. FRANCE EPOXY CURING AGENTS MARKET, BY APPLICATION, 2020-2030 ($MILLION)
TABLE 83. FRANCE EPOXY CURING AGENTS MARKET, BY END USER, 2020-2030 (KILOTONS)
TABLE 84. FRANCE EPOXY CURING AGENTS MARKET, BY END USER, 2020-2030 ($MILLION)
TABLE 85. ITALY EPOXY CURING AGENTS MARKET, BY CURING AGENT, 2020-2030 (KILOTONS)
TABLE 86. ITALY EPOXY CURING AGENTS MARKET, BY CURING AGENT, 2020-2030 ($MILLION)
TABLE 87. ITALY EPOXY CURING AGENTS MARKET, BY APPLICATION, 2020-2030 (KILOTONS)
TABLE 88. ITALY EPOXY CURING AGENTS MARKET, BY APPLICATION, 2020-2030 ($MILLION)
TABLE 89. ITALY EPOXY CURING AGENTS MARKET, BY END USER, 2020-2030 (KILOTONS)
TABLE 90. ITALY EPOXY CURING AGENTS MARKET, BY END USER, 2020-2030 ($MILLION)
TABLE 91. SPAIN EPOXY CURING AGENTS MARKET, BY CURING AGENT, 2020-2030 (KILOTONS)
TABLE 92. SPAIN EPOXY CURING AGENTS MARKET, BY CURING AGENT, 2020-2030 ($MILLION)
TABLE 93. SPAIN EPOXY CURING AGENTS MARKET, BY APPLICATION, 2020-2030 (KILOTONS)
TABLE 94. SPAIN EPOXY CURING AGENTS MARKET, BY APPLICATION, 2020-2030 ($MILLION)
TABLE 95. SPAIN EPOXY CURING AGENTS MARKET, BY END USER, 2020-2030 (KILOTONS)
TABLE 96. SPAIN EPOXY CURING AGENTS MARKET, BY END USER, 2020-2030 ($MILLION)
TABLE 97. UK EPOXY CURING AGENTS MARKET, BY CURING AGENT, 2020-2030 (KILOTONS)
TABLE 98. UK EPOXY CURING AGENTS MARKET, BY CURING AGENT, 2020-2030 ($MILLION)
TABLE 99. UK EPOXY CURING AGENTS MARKET, BY APPLICATION, 2020-2030 (KILOTONS)
TABLE 100. UK EPOXY CURING AGENTS MARKET, BY APPLICATION, 2020-2030 ($MILLION)
TABLE 101. UK EPOXY CURING AGENTS MARKET, BY END USER, 2020-2030 (KILOTONS)
TABLE 102. UK EPOXY CURING AGENTS MARKET, BY END USER, 2020-2030 ($MILLION)
TABLE 103. REST OF EUROPE EPOXY CURING AGENTS MARKET, BY CURING AGENT, 2020-2030 (KILOTONS)
TABLE 104. REST OF EUROPE EPOXY CURING AGENTS MARKET, BY CURING AGENT, 2020-2030 ($MILLION)
TABLE 105. REST OF EUROPE EPOXY CURING AGENTS MARKET, BY APPLICATION, 2020-2030 (KILOTONS)
TABLE 106. REST OF EUROPE EPOXY CURING AGENTS MARKET, BY APPLICATION, 2020-2030 ($MILLION)
TABLE 107. REST OF EUROPE EPOXY CURING AGENTS MARKET, BY END USER, 2020-2030 (KILOTONS)
TABLE 108. REST OF EUROPE EPOXY CURING AGENTS MARKET, BY END USER, 2020-2030 ($MILLION)
TABLE 109. ASIA-PACIFIC EPOXY CURING AGENTS MARKET, BY CURING AGENT, 2020-2030 (KILOTONS)
TABLE 110. ASIA-PACIFIC EPOXY CURING AGENTS MARKET, BY CURING AGENT, 2020-2030 ($MILLION)
TABLE 111. ASIA-PACIFIC EPOXY CURING AGENTS MARKET, BY APPLICATION, 2020-2030 (KILOTONS)
TABLE 112. ASIA-PACIFIC EPOXY CURING AGENTS MARKET, BY APPLICATION, 2020-2030 ($MILLION)
TABLE 113. ASIA-PACIFIC EPOXY CURING AGENTS MARKET, BY END USER, 2020-2030 (KILOTONS)
TABLE 114. ASIA-PACIFIC EPOXY CURING AGENTS MARKET, BY END USER, 2020-2030 ($MILLION)
TABLE 115. ASIA-PACIFIC EPOXY CURING AGENTS MARKET, BY COUNTRY, 2020-2030 (KILOTONS)
TABLE 116. ASIA-PACIFIC EPOXY CURING AGENTS MARKET, BY COUNTRY, 2020-2030 ($MILLION)
TABLE 117. CHINA EPOXY CURING AGENTS MARKET, BY CURING AGENT, 2020-2030 (KILOTONS)
TABLE 118. CHINA EPOXY CURING AGENTS MARKET, BY CURING AGENT, 2020-2030 ($MILLION)
TABLE 119. CHINA EPOXY CURING AGENTS MARKET, BY APPLICATION, 2020-2030 (KILOTONS)
TABLE 120. CHINA EPOXY CURING AGENTS MARKET, BY APPLICATION, 2020-2030 ($MILLION)
TABLE 121. CHINA EPOXY CURING AGENTS MARKET, BY END USER, 2020-2030 (KILOTONS)
TABLE 122. CHINA EPOXY CURING AGENTS MARKET, BY END USER, 2020-2030 ($MILLION)
TABLE 123. JAPAN EPOXY CURING AGENTS MARKET, BY CURING AGENT, 2020-2030 (KILOTONS)
TABLE 124. JAPAN EPOXY CURING AGENTS MARKET, BY CURING AGENT, 2020-2030 ($MILLION)
TABLE 125. JAPAN EPOXY CURING AGENTS MARKET, BY APPLICATION, 2020-2030 (KILOTONS)
TABLE 126. JAPAN EPOXY CURING AGENTS MARKET, BY APPLICATION, 2020-2030 ($MILLION)
TABLE 127. JAPAN EPOXY CURING AGENTS MARKET, BY END USER, 2020-2030 (KILOTONS)
TABLE 128. JAPAN EPOXY CURING AGENTS MARKET, BY END USER, 2020-2030 ($MILLION)
TABLE 129. INDIA EPOXY CURING AGENTS MARKET, BY CURING AGENT, 2020-2030 (KILOTONS)
TABLE 130. INDIA EPOXY CURING AGENTS MARKET, BY CURING AGENT, 2020-2030 ($MILLION)
TABLE 131. INDIA EPOXY CURING AGENTS MARKET, BY APPLICATION, 2020-2030 (KILOTONS)
TABLE 132. INDIA EPOXY CURING AGENTS MARKET, BY APPLICATION, 2020-2030 ($MILLION)
TABLE 133. INDIA EPOXY CURING AGENTS MARKET, BY END USER, 2020-2030 (KILOTONS)
TABLE 134. INDIA EPOXY CURING AGENTS MARKET, BY END USER, 2020-2030 ($MILLION)
TABLE 135. SOUTH KOREA EPOXY CURING AGENTS MARKET, BY CURING AGENT, 2020-2030 (KILOTONS)
TABLE 136. SOUTH KOREA EPOXY CURING AGENTS MARKET, BY CURING AGENT, 2020-2030 ($MILLION)
TABLE 137. SOUTH KOREA EPOXY CURING AGENTS MARKET, BY APPLICATION, 2020-2030 (KILOTONS)
TABLE 138. SOUTH KOREA EPOXY CURING AGENTS MARKET, BY APPLICATION, 2020-2030 ($MILLION)
TABLE 139. SOUTH KOREA EPOXY CURING AGENTS MARKET, BY END USER, 2020-2030 (KILOTONS)
TABLE 140. SOUTH KOREA EPOXY CURING AGENTS MARKET, BY END USER, 2020-2030 ($MILLION)
TABLE 141. REST OF ASIA-PACIFIC EPOXY CURING AGENTS MARKET, BY CURING AGENT, 2020-2030 (KILOTONS)
TABLE 142. REST OF ASIA-PACIFIC EPOXY CURING AGENTS MARKET, BY CURING AGENT, 2020-2030 ($MILLION)
TABLE 143. REST OF ASIA-PACIFIC EPOXY CURING AGENTS MARKET, BY APPLICATION, 2020-2030 (KILOTONS)
TABLE 144. REST OF ASIA-PACIFIC EPOXY CURING AGENTS MARKET, BY APPLICATION, 2020-2030 ($MILLION)
TABLE 145. REST OF ASIA-PACIFIC EPOXY CURING AGENTS MARKET, BY END USER, 2020-2030 (KILOTONS)
TABLE 146. REST OF ASIA-PACIFIC EPOXY CURING AGENTS MARKET, BY END USER, 2020-2030 ($MILLION)
TABLE 147. LAMEA EPOXY CURING AGENTS MARKET, BY CURING AGENT, 2020-2030 (KILOTONS)
TABLE 148. LAMEA EPOXY CURING AGENTS MARKET, BY CURING AGENT, 2020-2030 ($MILLION)
TABLE 149. LAMEA EPOXY CURING AGENTS MARKET, BY APPLICATION, 2020-2030 (KILOTONS)
TABLE 150. LAMEA EPOXY CURING AGENTS MARKET, BY APPLICATION, 2020-2030 ($MILLION)
TABLE 151. LAMEA EPOXY CURING AGENTS MARKET, BY END USER, 2020-2030 (KILOTONS)
TABLE 152. LAMEA EPOXY CURING AGENTS MARKET, BY END USER, 2020-2030 ($MILLION)
TABLE 153. LAMEA EPOXY CURING AGENTS MARKET, BY COUNTRY, 2020-2030 (KILOTONS)
TABLE 154. LAMEA EPOXY CURING AGENTS MARKET, BY COUNTRY, 2020-2030 ($MILLION)
TABLE 155. BRAZIL EPOXY CURING AGENTS MARKET, BY CURING AGENT, 2020-2030 (KILOTONS)
TABLE 156. BRAZIL EPOXY CURING AGENTS MARKET, BY CURING AGENT, 2020-2030 ($MILLION)
TABLE 157. BRAZIL EPOXY CURING AGENTS MARKET, BY APPLICATION, 2020-2030 (KILOTONS)
TABLE 158. BRAZIL EPOXY CURING AGENTS MARKET, BY APPLICATION, 2020-2030 ($MILLION)
TABLE 159. BRAZIL EPOXY CURING AGENTS MARKET, BY END USER, 2020-2030 (KILOTONS)
TABLE 160. BRAZIL EPOXY CURING AGENTS MARKET, BY END USER, 2020-2030 ($MILLION)
TABLE 161. SAUDI ARABIA EPOXY CURING AGENTS MARKET, BY CURING AGENT, 2020-2030 (KILOTONS)
TABLE 162. SAUDI ARABIA EPOXY CURING AGENTS MARKET, BY CURING AGENT, 2020-2030 ($MILLION)
TABLE 163. SAUDI ARABIA EPOXY CURING AGENTS MARKET, BY APPLICATION, 2020-2030 (KILOTONS)
TABLE 164. SAUDI ARABIA EPOXY CURING AGENTS MARKET, BY APPLICATION, 2020-2030 ($MILLION)
TABLE 165. SAUDI ARABIA EPOXY CURING AGENTS MARKET, BY END USER, 2020-2030 (KILOTONS)
TABLE 166. SAUDI ARABIA EPOXY CURING AGENTS MARKET, BY END USER, 2020-2030 ($MILLION)
TABLE 167. SOUTH AFRICA EPOXY CURING AGENTS MARKET, BY CURING AGENT, 2020-2030 (KILOTONS)
TABLE 168. SOUTH AFRICA EPOXY CURING AGENTS MARKET, BY CURING AGENT, 2020-2030 ($MILLION)
TABLE 169. SOUTH AFRICA EPOXY CURING AGENTS MARKET, BY APPLICATION, 2020-2030 (KILOTONS)
TABLE 170. SOUTH AFRICA EPOXY CURING AGENTS MARKET, BY APPLICATION, 2020-2030 ($MILLION)
TABLE 171. SOUTH AFRICA EPOXY CURING AGENTS MARKET, BY END USER, 2020-2030 (KILOTONS)
TABLE 172. SOUTH AFRICA EPOXY CURING AGENTS MARKET, BY END USER, 2020-2030 ($MILLION)
TABLE 173. REST OF LAMEA EPOXY CURING AGENTS MARKET, BY CURING AGENT, 2020-2030 (KILOTONS)
TABLE 174. REST OF LAMEA EPOXY CURING AGENTS MARKET, BY CURING AGENT, 2020-2030 ($MILLION)
TABLE 175. REST OF LAMEA EPOXY CURING AGENTS MARKET, BY APPLICATION, 2020-2030 (KILOTONS)
TABLE 176. REST OF LAMEA EPOXY CURING AGENTS MARKET, BY APPLICATION, 2020-2030 ($MILLION)
TABLE 177. REST OF LAMEA EPOXY CURING AGENTS MARKET, BY END USER, 2020-2030 (KILOTONS)
TABLE 178. REST OF LAMEA EPOXY CURING AGENTS MARKET, BY END USER, 2020-2030 ($MILLION)
TABLE 179. KEY BUSINESS EXPANSIONS (2018-2021)
TABLE 180. OTHER KEY DEVELOPMENTS (2018-2021)
TABLE 181. PARK AEROSPACE CORP: KEY EXECUTIVES
TABLE 182. PARK AEROSPACE CORP: COMPANY SNAPSHOT
TABLE 183. PARK AEROSPACE CORP: OPERATING SEGMENTS
TABLE 184. PARK AEROSPACE CORP: PRODUCT PORTFOLIO
TABLE 185. PARK AEROSPACE CORP: NET SALES, 2018–2020 ($MILLION)
TABLE 186. EVONIK INDSUTRIES: KEY EXECUTIVES
TABLE 187. EVONIK INDUSTRIES: COMPANY SNAPSHOT
TABLE 188. EVONIK INDUSTRIES: OPERATING SEGMENTS
TABLE 189. EVONIK INDUSTRIES: PRODUCT PORTFOLIO
TABLE 190. EVONIK INDUSTRIES: R&D EXPENDITURE, 2018–2020 ($MILLION)
TABLE 191. EVONIK INDUSTRIES: NET SALES, 2018–2020 ($MILLION)
TABLE 192. RELIANCE COMPOSITES POLYMERS: KEY EXECUTIVES
TABLE 193. RELIANCE COMPOSITES POLYMERS: COMPANY SNAPSHOT
TABLE 194. RELIANCE COMPOSITE POLYMERS: PRODUCT PORTFOLIO
TABLE 195. HEXCEL CORPORATION: KEY EXECUTIVES
TABLE 196. HEXCEL CORPORATION: COMPANY SNAPSHOT
TABLE 197. HEXCEL CORPORATION: OPERATING SEGMENTS
TABLE 198. HEXCEL CORPORATION: PRODUCT PORTFOLIO
TABLE 199. HEXCEL CORPORATION: NET SALES, 2018–2020 ($MILLION)
TABLE 200. MITSUBUSHI CHEMICAL HOLDINGS: KEY EXECUTIVES
TABLE 201. MITSUBUSHI CHEMICAL HOLDINGS: COMPANY SNAPSHOT
TABLE 202. MITSUBUSHI CHEMICAL HOLDINGS: OPERATING SEGMENTS
TABLE 203. MITSUBUSHI CHEMICAL HOLDINGS: PRODUCT PORTFOLIO
TABLE 204. MITSUBUSHI CHEMICAL HOLDINGS: R&D EXPENDITURE, 2018–2020 ($MILLION)
TABLE 205. MITSUBUSHI CHEMICAL HOLDINGS: NET SALES, 2018–2020 ($MILLION)
TABLE 206. CYTEC SOLVAY GROUP: KEY EXECUTIVES
TABLE 207. CYTEC SOLVAY GROUP: COMPANY SNAPSHOT
TABLE 208. CYTEC SOLVAY GROUP: OPERATING SEGMENTS
TABLE 209. CYTEC SOLVAY GROUP: PRODUCT PORTFOLIO
TABLE 210. CYTEC SOLVAY GROUP: NET SALES, 2018–2020 ($MILLION)
TABLE 211. HUNTSMAN CORPORATION: KEY EXECUTIVES
TABLE 212. HUNTSMAN CORPORATION: COMPANY SNAPSHOT
TABLE 213. HUNTSMAN CORPORATION: OPERATING SEGMENTS
TABLE 214. HUNTSMAN CORPORATION: PRODUCT PORTFOLIO
TABLE 215. HUNTSMAN CORPORATION: NET SALES, 2018–2020 ($MILLION)
TABLE 216. BARRYDAY CORPORATION: KEY EXECUTIVES
TABLE 217. BARRYDAY CORPORATION: COMPANY SNAPSHOT
TABLE 218. BARRYDAY CORPORATION: PRODUCT PORTFOLIO
TABLE 219. BHOR CHEMICALS AND PLASTICS PRIVATE LIMITED: KEY EXECUTIVES
TABLE 220. BHOR CHEMICALS AND PLASTICS PRIVATE LIMITED: COMPANY SNAPSHOT
TABLE 221. BHOR CHEMICALS AND PLASTICS PRIVATE LIMITED: PRODUCT PORTFOLIO
TABLE 222. ATUL LTD.: KEY EXECUTIVES
TABLE 223. ATUL LTD.: COMPANY SNAPSHOT
TABLE 224. ATUL LTD.: OPERATING SEGMENTS
TABLE 225. ATUL LTD.: PRODUCT PORTFOLIO
TABLE 226. ATUL LTD.: NET SALES, 2018–2020 ($MILLION)
LIST OF FIGURES
FIGURE 01. GLOBAL EPOXY CURING AGENTS MARKET SNAPSHOT, BY SEGMENTATION, 2021–2030
FIGURE 02. EPOXY CURING AGENTS MARKET SNAPSHOT, BY REGION, 2021–2030
FIGURE 03. EPOXY CURING AGENTS MARKET SEGMENTATION
FIGURE 04. TOP INVESTMENT POCKETS
FIGURE 05. BARGAINING POWER OF SUPPLIERS
FIGURE 06. BARGAINING POWER OF BUYERS
FIGURE 07. THREAT OF NEW ENTRANTS
FIGURE 08. THREAT OF SUBSTITUTES
FIGURE 09. COMPETITIVE RIVALRY
FIGURE 10. EPOXY CURING AGENTS MARKET DYNAMICS
FIGURE 11. VALUE CHAIN ANALYSIS
FIGURE 12. EPOXY CURING AGENTS MARKET, BY CURING AGENT, 2021–2030 ($MILILION)
FIGURE 13. COMPARATIVE ANALYSIS OF AMINES CURING AGENT MARKET, BY COUNTRY, 2021 & 2030 ($MILLION)
FIGURE 14. COMPARATIVE ANALYSIS OF POLYAMIDES CURING AGENT MARKET, BY COUNTRY, 2021 & 2030 ($MILLION)
FIGURE 15. COMPARATIVE ANALYSIS OF ANHYDRIDES CURING AGENT MARKET, BY COUNTRY, 2021 & 2030 ($MILLION)
FIGURE 16. COMPARATIVE ANALYSIS OF OTHERS CURING AGENT MARKET, BY COUNTRY, 2021 & 2030 ($MILLION)
FIGURE 17. EPOXY CURING AGENTS MARKET, BY APPLICATION, 2020–2030 ($MILILION)
FIGURE 18. COMPARATIVE ANALYSIS OF EPOXY CURING AGENTS MARKET FOR PAINTS AND COATING, BY COUNTRY, 2021 & 2030 ($MILLION)
FIGURE 19. COMPARATIVE ANALYSIS OF EPOXY CURING AGENTS MARKET FOR ADHESIVES, BY COUNTRY, 2021 & 2030 ($MILLION)
FIGURE 20. COMPARATIVE ANALYSIS OF EPOXY CURING AGENTS MARKET FOR COMPOSITES, BY COUNTRY, 2021 & 2030 ($MILLION)
FIGURE 21. COMPARATIVE ANALYSIS OF EPOXY CURING AGENTS MARKET FOR ELECTRONIC ENCAPSULATION & OTHERS, BY COUNTRY, 2021 & 2030 ($MILLION)
FIGURE 22. EPOXY CURING AGENTS MARKET, BY END USER, 2020–2030 ($MILILION)
FIGURE 23. COMPARATIVE ANALYSIS OF EPOXY CURING AGENTS MARKET FOR BUILDING & CONSTRUCTION, BY COUNTRY, 2021 & 2030 ($MILLION)
FIGURE 24. COMPARATIVE ANALYSIS OF EPOXY CURING AGENTS MARKET FOR TRANSPORATION, BY COUNTRY, 2021 & 2030 ($MILLION)
FIGURE 25. COMPARATIVE ANALYSIS OF EPOXY CURING AGENTS MARKET FOR GENERAL INDUSTRIAL, BY COUNTRY, 2021 & 2030 ($MILLION)
FIGURE 26. COMPARATIVE ANALYSIS OF EPOXY CURING AGENTS MARKET FOR WIND POWER, BY COUNTRY, 2021 & 2030 ($MILLION)
FIGURE 27. COMPARATIVE ANALYSIS OF EPOXY CURING AGENTS MARKET FOR AEROSPACE, BY COUNTRY, 2021 & 2030 ($MILLION)
FIGURE 28. COMPARATIVE ANALYSIS OF EPOXY CURING AGENTS MARKET FOR MARINE & OTHERS, BY COUNTRY, 2021 & 2030 ($MILLION)
FIGURE 29. U.S. EPOXY CURING AGENTS MARKET REVENUE, 2020–2030 ($MILLION)
FIGURE 30. CANADA EPOXY CURING AGENTS MARKET REVENUE, 2020–2030 ($MILLION)
FIGURE 31. MEXICO EPOXY CURING AGENTS MARKET REVENUE, 2020–2030 ($MILLION)
FIGURE 32. GERMANY EPOXY CURING AGENTS MARKET REVENUE, 2020–2030 ($MILLION)
FIGURE 33. FRANCE EPOXY CURING AGENTS MARKET REVENUE, 2020–2030 ($MILLION)
FIGURE 34. ITALY EPOXY CURING AGENTS MARKET REVENUE, 2020–2030 ($MILLION)
FIGURE 35. SPAIN EPOXY CURING AGENTS MARKET REVENUE, 2020–2030 ($MILLION)
FIGURE 36. UK EPOXY CURING AGENTS MARKET REVENUE, 2020–2030 ($MILLION)
FIGURE 37. REST OF EUROPE EPOXY CURING AGENTS MARKET REVENUE, 2020–2030 ($MILLION)
FIGURE 38. CHINA EPOXY CURING AGENTS MARKET REVENUE, 2020–2030 ($MILLION)
FIGURE 39. JAPAN EPOXY CURING AGENTS MARKET REVENUE, 2020–2030 ($MILLION)
FIGURE 40. INDIA EPOXY CURING AGENTS MARKET REVENUE, 2020–2030 ($MILLION)
FIGURE 41. SOUTH KOREA EPOXY CURING AGENTS MARKET REVENUE, 2020–2030 ($MILLION)
FIGURE 42. REST OF ASIA-PACIFIC EPOXY CURING AGENTS MARKET REVENUE, 2020–2030 ($MILLION)
FIGURE 43. BRAZIL EPOXY CURING AGENTS MARKET REVENUE, 2020–2030 ($MILLION)
FIGURE 44. SAUDI ARABIA EPOXY CURING AGENTS MARKET REVENUE, 2020–2030 ($MILLION)
FIGURE 45. SOUTH AFRICA EPOXY CURING AGENTS MARKET REVENUE, 2020–2030 ($MILLION)
FIGURE 46. REST OF LAMEA EPOXY CURING AGENTS MARKET REVENUE, 2020–2030 ($MILLION)
FIGURE 47. MARKET PLAYER POSITIONING, 2020
FIGURE 48. TOP WINNING STRATEGIES, BY YEAR, 2019–2021
FIGURE 49. TOP WINNING STRATEGIES, BY DEVELOPMENT, 2019–2021 (%)
FIGURE 50. TOP WINNING STRATEGIES, BY COMPANY, 2019–2021
FIGURE 51. PRODUCT MAPPING OF TOP 10 PLAYERS
FIGURE 52. COMPETITIVE DASHBOARD
FIGURE 53. COMPETITIVE HEATMAP OF KEY PLAYERS
FIGURE 54. PARK AEROSPACE CORP: NET SALES, 2018–2020 ($MILLION)
FIGURE 55. PARK AEROSPACE CORP: REVENUE SHARE BY APPLICATION, 2020 (%)
FIGURE 56. PARK AEROSPACE CORP: REVENUE SHARE BY REGION, 2020 (%)
FIGURE 57. EVONIK INDUSTRIES: R&D EXPENDITURE, 2018–2020 ($MILLION)
FIGURE 58. EVONIK INDUSTRIES: NET SALES, 2018–2020 ($MILLION)
FIGURE 59. EVONIK INSUDTRIES: REVENUE SHARE BY SEGMENT, 2020 (%)
FIGURE 60. EVONIK INDUSTRIES: REVENUE SHARE BY REGION, 2020 (%)
FIGURE 61. HEXCEL CORPORATION: NET SALES, 2018–2020 ($MILLION)
FIGURE 62. HEXCEL CORPORATION: REVENUE SHARE BY SEGMENT, 2020 (%)
FIGURE 63. HEXCEL CORPORATION: REVENUE SHARE BY REGION, 2020 (%)
FIGURE 64. MITSUBUSHI CHEMICAL HOLDINGS: R&D EXPENDITURE, 2018–2020 ($MILLION)
FIGURE 65. MITSUBUSHI CHEMICAL HOLDINGS: NET SALES, 2018–2020 ($MILLION)
FIGURE 66. MITSUBUSHI CHEMICAL HOLDINGS: REVENUE SHARE BY SEGMENT, 2020 (%)
FIGURE 67. CYTEC SOLVAY GROUP: NET SALES, 2018–2020 ($MILLION)
FIGURE 68. CYTEC SOLVAY GROUP: REVENUE SHARE BY REGION, 2020 (%)
FIGURE 69. HUNTSMAN CORPORATION: NET SALES, 2018–2020 ($MILLION)
FIGURE 70. HUNTSMAN CORPORATION: REVENUE SHARE BY SEGMENT, 2020 (%)
FIGURE 71. HUNTSMAN CORPORATION: REVENUE SHARE BY REGION, 2020 (%)
FIGURE 72. ATUL LTD.: NET SALES, 2018–2020 ($MILLION)
FIGURE 73. ATUL LTD.: REVENUE SHARE BY SEGMENT, 2020 (%)
FIGURE 74. ATUL LTD.: REVENUE SHARE BY REGION, 2020 (%)
The global epoxy curing agents market is expected to witness increased demand during the forecast period, due to rapidly growing building & construction and electronics industry throughout the forecast period.
Several environmental and health concerns associated with epoxy curing agents based products are anticipated to hinder the growth of the epoxy curing agents market during the forecast period. However, increasing demand for epoxy curing agents in the application of wind energy and increasing demand of epoxy curing agents in several end-use applications such as building & construction, electrical and electronics, and transportation, are some of the key factors expected to provide high demand for the epoxy curing agents market throughout the forecast period. In addition, rapidly glorifying infrastructure and high urbanization growth especially in developing countries are expected to drive the global epoxy curing agents market demand throughout the forecast period.
The COVID-19 pandemic has negatively impacted the global epoxy curing agents market for a short span due to shutdown of various industry production facilities such as infrastructure, paints & coating, and transportation sector leading to the decline in demand for epoxy curing agents compounds, thereby hindering the global epoxy curing agents market for a short span of time.
Moreover, companies are inheriting expansion and acquisition strategies to boost the growth of the epoxy curing agents market throughout the forecast period.
A. Increase in demand for materials used in construction and transport industry, increase in demand for efficient wind and solar power plants are the key factors driving the growth of epoxy curing agents market
A. The expected market value of Epoxy Curing Agents by 2030 is US$ 8.4 billion
A. Bhor Chemicals and Plastics Private Limited. Cytec Solvay Group, Atul Ltd., Mitsubishi Chemical Corporation, Park Aerospace Corp., Reliance Composites Polymers, Barrday Inc., Hexcel Corporation, Huntsmann Corporation and Evonik Industries AG
A. Building & construction industry is projected to increase the demand for Epoxy Curing Agents Market
A. The global epoxy curing agents market is segmented on the basis of curing agent, application, end user and region. On the basis of curing agent, the global epoxy curing agents market is segmented into amines, polyamides, anhydrides and others. The applications covered in the study include paints & coating, adhesives, composites and electronic encapsulation & others. The end users covered in the study include building & construction, transportation, general industrial, wind power, aerospace and marine & others. Region wise, the market is studied across North America, Europe, Asia-Pacific, and LAMEA.
A. Increase in annual deployed capacities for epoxy curing agents across the globe is the Main Driver of Epoxy Curing Agents Market
A. Paints and coating segment is expected to drive the adoption of Epoxy Curing Agents?
A. Emergence of COVID-19 had a negative impact on the growth of the global epoxy curing agents market for a short period.
Start reading instantly.
This Report and over 66,965+ more Reports, Available with Avenue Library. T&C*.
Enterprise
License/PDF
Library
Membership
*Taxes/Fees, if applicable will be added during checkout. All prices in USD
To ensure high-level data integrity, accurate analysis, and impeccable forecasts
For complete satisfaction
On-demand customization of scope of the report to exactly meet your needs
Targeted market view to provide pertinent information and save time of readers
Get insights on topics that are crucial for your business. Stay abreast of your interest areas.
Get Industry Data AlertsTo ensure high-level data integrity, accurate analysis, and impeccable forecasts
For complete satisfaction
On-demand customization of scope of the report to exactly meet your needs
Targeted market view to provide pertinent information and save time of readers