Report Code: A04891 | Apr 2019 | Pages: 181 | ||
Tables: 66 | Charts: 25 |
|
Pandemic disrupted the entire world and affected many industries.
Get detailed COVID-19 impact analysis on the Europe Early Toxicity Testing Market
Request Now !Europe Early Toxicity Testing Market Outlook - 2025
The Europe early toxicity testing market accounted for $265 million in 2017, and is expected to reach $460 million by 2025, registering a CAGR of 7.1% from 2018 to 2025.Â
Toxicity is the degree of threat posed by a substance to the living organism. The effects of chemical substance on the body are studied to choose a potential drug candidate during the development of newer molecules. Early toxicity testing is carried out at pre-clinical stages of a drug development process and is essential as toxicity serves as the major reason for the failure of potential drug candidates in the later stages of drug development leading to huge financial loss to companies. Moreover, companies perform early toxicity testing to comply with the government standards to market the drug. These testing are necessary as it can prevent financial losses that occur during the failure of drugs in further late stages of drug development.Â
It is estimated that Europe early toxicity testing market is expected to witness significant growth over the forecast period, owing to increase in the R&D activities and rise in stringent regulatory authorities concerning public healthcare welfare. In addition, technological advancements in in vitro technique, rise in adoption of in vitro models in the Europe early toxicity testing industry, and surge in adoption of early toxicity testing in the various industries further fuel the market growth. However, limitations associated with preclinical testing hamper the market growth. Furthermore, the technological advancements related to early toxicity testing provide opportunities for the growth of Europe early toxicity testing market during the forecast period.
Europe Early Toxicity Testing Market Segmentation
The Europe early toxicity testing market is segmented based on technique, application, end users, and country to provide a detailed assessment of the market. Based on technique, the market is divided into in vivo, in vitro, and in silico. The market on the basis of in vitro is further divided into in vitro toxicity testing market by assays and in vitro toxicity testing market by toxicity endpoints. The in vitro toxicity testing market by assays is further segmented into enzyme toxicity assays, bacterial toxicity assays, cell-based ELISA & western blots, receptor binding assays, and other assays. The in vitro toxicity testing market by toxicity endpoints is further divided into dermal toxicity, systemic toxicity, carcinogenicity, ocular toxicity, skin sensitization and irritation, neurotoxicity, organ toxicity, and other toxicity endpoints. Depending on end user, it is categorized into pharmaceutical industry, food industry, chemicals industry, cosmetics industry, and other industry. Based on region, the Europe early toxicity testing market size is analyzed across Germany, France, the UK, and rest of Europe.
Â
Segment review
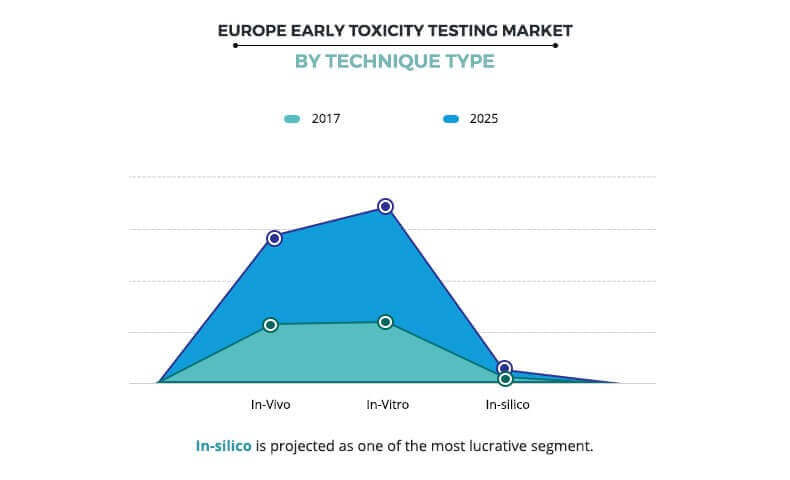
Based on product type market is divided into in vivo, in vitro, and in silico. In vitro segment is largest contributor to the Europe early toxicity testing market in 2017 and is expected to maintain its dominant position throughout the analysis period. In vitro toxicity methods use different laboratory techniques and cell lines to assess the possible adverse effects of different drugs and chemicals on the human health. Cost-effective nature of this technique, technological advancement, and stringent regulation for animal usage during diagnostic procedures are majorly driving the Europe early toxicity testing market growth of this segment. On the other side in silico segment is the fastest growing segment during the forecast period, owing to the rise in its adoption due to advantages offered by the technique. In silico techniques have revolutionized the drug discovery process as these techniques are not only applied to find the new targets and new molecule with high affinity to those targets but also used to determine the metabolic pathways of those active molecules. In addition, these techniques are computer-based that eliminate animal sacrifice, which is another factor that contributes to the growth of Europe Early Toxicity Testing market.
Â
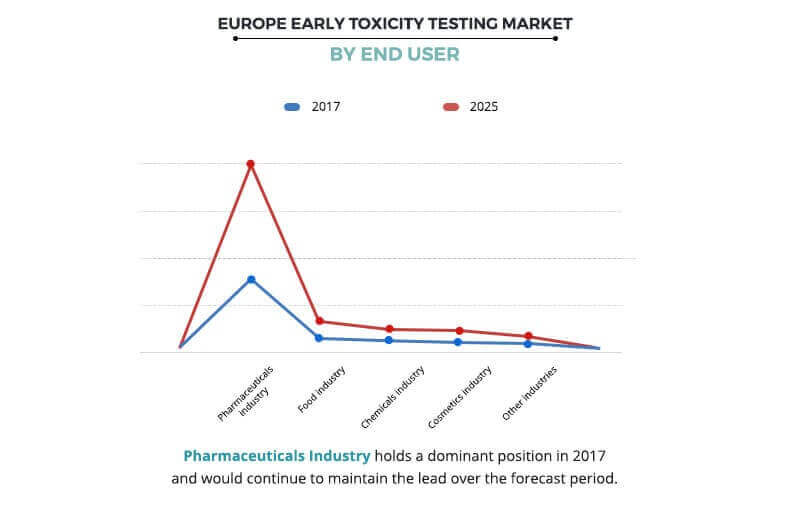
According to Europe early toxicity testing market analysis, the end users segment is classified into pharmaceutical industry, food industry, chemicals industry, cosmetics industry, and other industries. The pharmaceutical segment is expected to be the fastest growing segment throughout the forecast period. It also accounted for the highest Europe early toxicity testing market share in 2017, and is anticipated to maintain this trend over the forecast period, owing to rise in number of clinical trials for drug development. During drug development, early toxicity testing can help reduce the risk of later stage failure for drug development, which predominantly fuels the growth of the pharmaceutical industry market.
Â
The report provides an extensive competitive analysis and profiles of the key market players such as Agilent Technologies, Inc., General Electric Company (GE Healthcare), Danaher Corporation (Beckman Coulter, Inc.), Evotec AG (Cyprotex), Bioanalytical Systems, Inc., Bruker Corporation, Thermo Fisher Scientific, Inc., PerkinElmer Inc., Enzo Biochem, Inc. (Enzo Clinical Labs, Inc.), The Jackson Laboratory.Â
Europe Early Toxicity Testing Market Report Highlights
Aspects | Details |
---|---|
By TECHNIQUE |
|
By APPLICATION |
|
By END USER |
|
By COUNTRY |
|
Key Market Players | Agilent Technologies, Inc, The Jackson Laboratory, Danaher Corporation (Beckman Coulter, Inc.), Evotec AG (Cyprotex), General Electric Company (GE Healthcare), Enzo Biochem, Inc. (Enzo Clinical Labs, Inc.), Bioanalytical Systems, Inc, Thermo Fisher Scientific, Inc, PerkinElmer Inc, BRUKER CORPORATION |
CHAPTER 1:Â Â Â INTRODUCTION
1.1.   Report description
1.2.   Key benefits for stakeholders
1.3.   Key market segments
1.3.1.   List of key players profiled in the report
1.4.   Research methodology
1.4.1.   Secondary research
1.4.2.   Primary research
1.4.3.   Analyst tools and models
CHAPTER 2:Â Â Â EXECUTIVE SUMMARY
2.1.   Key findings of the study
2.2.   CXO perspective
CHAPTER 3:Â Â Â MARKET OVERVIEW
3.1.   Market Definition and Scope
3.2.   Key findings
3.2.1.   Top investment pockets
3.2.2.   Top winning strategies, 2017
3.3.   Top player positioning, 2017
3.4.   Porter’s five forces analysis
3.5.   Government Regulations
3.6.   Market Dynamics
3.6.1.   Drivers
3.6.1.1.   Surge in research and development activities in healthcare
3.6.1.2.   Rise in adoption of vitro model
3.6.1.3.   Increase in stringency of regulatory authorities concerning public healthcare welfare
3.6.1.4.   Surge in adoption of early toxicity testing
3.6.2.   Restraints
3.6.2.1.   Limitations of preclinical testing
3.6.3.   Opportunities
3.6.3.1.   Technological advancement in the field of early toxicity testing
3.6.4.   Impact Analyses
CHAPTER 4:Â Â Â EUROPE EARLY TOXICITY TESTING MARKET, BY TECHNIQUE
4.1.   Overview
4.1.1.   Market size and forecast
4.2.   In Vivo
4.2.1.   Key market trends, growth factors, and opportunities
4.2.2.   Market size and forecast, by country
4.3.   In Vitro
4.3.1.   Key market trends, growth factors, and opportunities
4.3.2.   Market size and forecast, by country
4.3.3.   In Vitro Early Toxicity Testing Market, By Assay
4.3.3.1.   Enzyme toxicity assays
4.3.3.1.1. Â Market size and forecast
4.3.3.2.   Bacterial toxicity assays
4.3.3.2.1.1.   Market size and forecast
4.3.3.3.   Cell-Based ELISA and Western Blots
4.3.3.3.1.1.   Market size and forecast
4.3.3.4.   Tissues Culture Assays
4.3.3.4.1.1.   Market size and forecast
4.3.3.5.   Receptor Binding Assays
4.3.3.5.1.1.   Market size and forecast
4.3.3.6.   Other Assays
4.3.3.6.1.1.   Market size and forecast
4.3.4.   In Vitro Early Toxicity Testing Market, By Toxicity End-Points
4.3.4.1.   Dermal Toxicity
4.3.4.1.1.1.   Market size and forecast
4.3.4.1.1.2.   Market size and forecast, by end user
4.3.4.2.   Systemic toxicity
4.3.4.2.1.1.   Market size and forecast
4.3.4.2.1.2.   Market size and forecast, by end user
4.3.4.3.   Carcinogenicity
4.3.4.3.1.1.   Market size and forecast
4.3.4.4.   Ocular toxicity
4.3.4.4.1.1.   Market size and forecast
4.3.4.4.1.2.   Market size and forecast, by end user
4.3.4.5.   Skin sensitization and irritation
4.3.4.5.1.1.   Market size and forecast
4.3.4.6.   Genotoxicity
4.3.4.6.1.1.   Market size and forecast
4.3.4.7.   Neurotoxicity
4.3.4.7.1.1.   Market size and forecast
4.3.4.8.   Organ toxicity
4.3.4.8.1.1.   Market size and forecast
4.3.4.9.   Other toxicity endpoints
4.3.4.9.1.1.   Market size and forecast
4.4.   In Silico
4.4.1.   Key market trends, growth factors, and opportunities
4.4.2.   Market size and forecast, by country
CHAPTER 5:Â Â Â EUROPE EARLY TOXICITY TESTING MARKET, BY APPLICATION
5.1.   Overview
5.1.1.   Market size and forecast
5.2.   Medical
5.2.1.   Market size and forecast, by type
5.2.1.1.   Examination
5.2.1.1.1.   Market size and forecast
5.2.1.2.   Surgical
5.2.1.2.1.   Market size and forecast
5.2.2.   Market size and forecast, by country
5.3.   Non-Medical
5.3.1.   Market size and forecast, by type
5.3.1.1.   Food services
5.3.1.1.1.   Market size and forecast
5.3.1.2.   Clean Room
5.3.1.2.1.   Market size and forecast
5.3.1.3.   Industrial
5.3.1.3.1.   Market size and forecast
5.3.2.   Market size and forecast, by country
CHAPTER 6:Â Â Â EUROPE EARLY TOXICITY TESTING MARKET, BY END USER
6.1.   Overview
6.1.1.   Market size and forecast
6.2.   Pharmaceutical Industry
6.2.1.   Market size and forecast, by country
6.3.   Diagnostics Industry
6.3.1.   Market size and forecast, by country
6.4.   Food Industry
6.4.1.   Market size and forecast, by country
6.5.   Chemicals Industry
6.5.1.   Market size and forecast, by country
6.6.   Cosmetic Industry
6.6.1.   Market size and forecast, by country
6.7.   Other Industries
6.7.1.   Market size and forecast, by country
CHAPTER 7:Â Â Â EUROPE EARLY TOXICITY TESTING MARKET, BY COUNTRY
7.1.   Overview
7.1.1.   Key market trends, growth factors, and opportunities
7.1.2.   Market size and forecast, by country
7.1.2.1.   Germany
7.1.2.1.1.   Germany market size and forecast, by technique
7.1.2.1.2.   Germany market size and forecast, by application
7.1.2.1.3.   Germany market size and forecast, by end user
7.1.2.2.   France
7.1.2.2.1.   France market size and forecast, by technique
7.1.2.2.2.   France market size and forecast, by application
7.1.2.2.3.   France market size and forecast, by end user
7.1.2.3.   UK
7.1.2.3.1.   UK market size and forecast, by technique
7.1.2.3.2.   UK market size and forecast, by application
7.1.2.3.3.   UK market size and forecast, by end user
7.1.2.4.   Rest of Europe
7.1.2.4.1.   Rest of Europe market size and forecast, by technique
7.1.2.4.2.   Rest of Europe market size and forecast, by application
7.1.2.4.3.   Rest of Europe market size and forecast, by end user
7.1.3.   Market size and forecast, by technique
7.1.4.   Market volume and forecast, by application
7.1.5.   Market volume and forecast, by end user
CHAPTER 8:Â Â Â COMPANY PROFILES, KEY MANUFACTURERS
8.1.   Agilent Technologies, Inc.
8.1.1.   Company overview
8.1.2.   Company snapshot
8.1.3.   Operating business segments
8.1.4.   Product type Portfolio
8.1.5.   Business performance
8.2.   General Electric Company (GE Healthcare)
8.2.1.   Company overview
8.2.2.   Company snapshot
8.2.3.   Operating business segments
8.2.4.   Product portfolio
8.2.5.   Business performance
8.3.   Danaher Corporation (Beckman Coulter, Inc.)
8.3.1.   Company overview
8.3.2.   Company snapshot
8.3.3.   Operating business segments
8.3.4.   Product type portfolio
8.3.5.   Business performance
8.4.   Evotec AG (Cyprotex)
8.4.1.   Company overview
8.4.2.   Company snapshot
8.4.3.   Operating business segments
8.4.4.   Product portfolio
8.4.5.   Business performance
8.5.   Bioanalytical Systems, Inc.
8.5.1.   Company overview
8.5.2.   Company snapshot
8.5.3.   Operating business segments
8.5.4.   Product portfolio
8.5.5.   Business performance
8.6.   BRUKER CORPORATION
8.6.1.   Company overview
8.6.2.   Company snapshot
8.6.3.   Operating business segments
8.6.4.   Product portfolio
8.6.5.   Business performance
8.7.   PerkinElmer Inc.
8.7.1.   Company overview
8.7.2.   Company snapshot
8.7.3.   Operating business segments
8.7.4.   Product Portfolio
8.7.5.   Business performance
8.8.   Enzo Biochem, Inc. (Enzo Clinical Labs, Inc.)
8.8.1.   Company overview
8.8.2.   Company snapshot
8.8.3.   Operating business segments
8.8.4.   Product Portfolio
8.8.5.   Business performance
8.9.   The Jackson Laboratory
Â
8.9.1.   Company overview
8.9.2.   Company snapshot
8.9.3.   Product Portfolio
8.9.4.   Business performance
8.10.   Thermo Fisher Scientific, Inc.
8.10.1.   Company overview
8.10.2.   Company snapshot
8.10.3.   Operating business segments
8.10.4.   Product Portfolio
8.10.5.   BUSINESS PERFORMANCE
LIST OF TABLES
TABLE 01.   EUROPE EARLY TOXICITY TESTING MARKET, BY TECHNIQUE, 2017–2025 ($MILLION)
TABLE 02.   IN VIVO EARLY TOXICITY TESTING MARKET, BY COUNTRY, 2017–2025 ($MILLION)
TABLE 03.   IN VITRO EARLY TOXICITY TESTING MARKET, BY COUNTRY, 2017–2025 ($MILLION)
TABLE 04.   IN VITRO EARLY TOXICITY TESTING MARKET, BY ASSAYS, 2017–2025 ($MILLION)
TABLE 05.   IN VITRO EARLY TOXICITY TESTING MARKET, BY ASSAYS, 2017–2025 ($MILLION)
TABLE 06.   DERMAL TOXICITY MARKET, BY END USER, 2017–2025 ($MILLION)
TABLE 07.   SYSTEMIC TOXICITY MARKET, BY END USER, 2017–2025 ($MILLION)
TABLE 08.   OCULAR TOXICITY MARKET, BY END USER, 2017–2025 ($MILLION)
TABLE 09.   IN SILICO EARLY TOXICITY TESTING MARKET, BY COUNTRY, 2017–2025 ($MILLION)
TABLE 10.   EUROPE EARLY TOXICITY TESTING MARKET, BY APPLICATIONS, 2017–2025 ($MILLION)
TABLE 11.   EUROPE EARLY TOXICITY MEDICAL MARKET, BY TYPE, 2017–2025 ($MILLION)
TABLE 12.   EUROPE EARLY TOXICITY MEDICAL MARKET, BY COUNTRY, 2017–2025 ($MILLION)
TABLE 13.   EUROPE EARLY TOXICITY NON-MEDICAL MARKET, BY TYPE, 2017–2025 ($MILLION)
TABLE 14.   EUROPE EARLY TOXICITY NON-MEDICAL MARKET, BY COUNTRY, 2017–2025 ($MILLION)
TABLE 15.   EUROPE EARLY TOXICITY TESTING MARKET, BY END USER, 2017–2025 ($MILLION)
TABLE 16.   EUROPE EARLY TOXICITY TESTING MARKET FOR PHARMACEUTICAL INDUSTRY, BY COUNTRY, 2017–2025 ($MILLION)
TABLE 17.   EARLY TOXICITY TESTING MARKET FOR DIAGNOSTICS INDUSTRY, BY COUNTRY, 2017–2025 ($MILLION)
TABLE 18.   EARLY TOXICITY TESTING MARKET FOR FOOD INDUSTRY, BY COUNTRY, 2017–2025 ($MILLION)
TABLE 19.   EARLY TOXICITY TESTING MARKET FOR CHEMICALS INDUSTRY, BY COUNTRY, 2017–2025 ($MILLION)
TABLE 20.   EARLY TOXICITY TESTING MARKET FOR COSMETIC INDUSTRY, BY COUNTRY, 2017–2025 ($MILLION)
TABLE 21.   EARLY TOXICITY TESTING MARKET FOR OTEHR INDUSTRIES, BY COUNTRY, 2017–2025 ($MILLION)
TABLE 22.   EUROPE EARLY TOXICITY TESTING MARKET, BY COUNTRY, 2017–2025 ($MILLION)
TABLE 23.   GERMANY EARLY TOXICITY TESTING MARKET, BY TECHNIQUE, 2017–2025 ($MILLION)
TABLE 24.   GERMANY EARLY TOXICITY TESTING MARKET, BY APPLICATIONS, 2017–2025 ($MILLION)
TABLE 25.   GERMANY EARLY TOXICITY TESTING MARKET, BY END USER, 2017–2025 ($MILLION)
TABLE 26.   FRANCE EARLY TOXICITY TESTING MARKET, BY TECHNIQUE, 2017–2025 ($MILLION)
TABLE 27.   FRANCE EARLY TOXICITY TESTING MARKET, BY APPLICATIONS, 2017–2025 ($MILLION)
TABLE 28.   FRANCE EARLY TOXICITY TESTING MARKET, BY END USER, 2017–2025 ($MILLION)
TABLE 29.   UK EARLY TOXICITY TESTING MARKET, BY TECHNIQUE, 2017–2025 ($MILLION)
TABLE 30.   UK EARLY TOXICITY TESTING MARKET, BY APPLICATIONS, 2017–2025 ($MILLION)
TABLE 31.   UK EARLY TOXICITY TESTING MARKET, BY END USER, 2017–2025 ($MILLION)
TABLE 32.   REST OF EUROPE EARLY TOXICITY TESTING MARKET, BY TECHNIQUE, 2017–2025 ($MILLION)
TABLE 33.   REST OF EUROPE EARLY TOXICITY TESTING MARKET, BY APPLICATIONS, 2017–2025 ($MILLION)
TABLE 34.   REST OF EUROPE EARLY TOXICITY TESTING MARKET, BY END USER, 2017–2025 ($MILLION)
TABLE 35.   EUROPE EARLY TOXICITY TESTING MARKET, BY TECHNIQUE, 2017–2025 ($MILLION)
TABLE 36.   EUROPE EARLY TOXICITY TESTING MARKET, BY APPLICATION, 2017–2025 (UNITS)
TABLE 37.   EUROPE EARLY TOXICITY TESTING MARKET, BY END USER, 2017–2025 (UNITS)
TABLE 38.   AGILENT: COMPANY SNAPSHOT
TABLE 39.   AGILENT: OPERATING SEGMENTS
TABLE 40.   AGILENT: PRODUCT TYPE PORTFOLIO
TABLE 41.   GE HEALTHCARE: COMPANY SNAPSHOT
TABLE 42.   GE HEALTHCARE: OPERATING SEGMENTS
TABLE 43.   GE HEALTHCARE: PRODUCT PORTFOLIO
TABLE 44.   DANAHER: COMPANY SNAPSHOT
TABLE 45.   DANAHER: OPERATING SEGMENTS
TABLE 46.   DANAHER: PRODUCT TYPE PORTFOLIO
TABLE 47.   EVOTEC: COMPANY SNAPSHOT
TABLE 48.   EVOTEC: OPERATING SEGMENTS
TABLE 49.   EVOTEC: PRODUCT PORTFOLIO
TABLE 50.   BASI: COMPANY SNAPSHOT
TABLE 51.   BASI: OPERATING SEGMENTS
TABLE 52.   BASI: PRODUCT PORTFOLIO
TABLE 53.   BRUKER: COMPANY SNAPSHOT
TABLE 54.   BRUKER: OPERATING SEGMENTS
TABLE 55.   BRUKER: PRODUCT PORTFOLIO
TABLE 56.   PERKINELMER: COMPANY SNAPSHOT
TABLE 57.   PERKINELMER: OPERATING SEGMENTS
TABLE 58.   PERKINELMER: PRODUCT PORTFOLIO
TABLE 59.   ENZO: COMPANY SNAPSHOT
TABLE 60.   ENZO: OPERATING SEGMENTS
TABLE 61.   ENZO: PRODUCT PORTFOLIO
TABLE 62.   JAX: COMPANY SNAPSHOT
TABLE 63.   JAX: PRODUCT PORTFOLIO
TABLE 64.   THERMO FISHER SCIENTIFIC: COMPANY SNAPSHOT
TABLE 65.   THERMO FISHER SCIENTIFIC: OPERATING SEGMENTS
TABLE 66.   THERMO FISHER SCIENTIFIC: PRODUCT PORTFOLIO
LIST OF FIGURES
FIGURE 01.   EUROPE EARLY TOXICITY TESTING MARKET SEGMENTATION
FIGURE 02.   TOP INVESTMENT POCKETS
FIGURE 03.   TOP WINNING STRATEGIES, 2016-2018
FIGURE 04.   TOP WINNING STRATEGIES, BY YEAR, 2016-2018
FIGURE 05.   TOP WINNING STRATEGIES: NATURE AND TYPE, 2016-2018
FIGURE 06.   TOP PLAYER POSITIONING, 2017
FIGURE 07.   MODERATE BARGANING POWER OF BUYERS
FIGURE 08.   MODERATE BARGANING POWER OF SUPPLIERS
FIGURE 09.   MODERATE THREAT OF SUBSTITUTION
FIGURE 10.   LOW THREAT OF NEW ENTRANTS
FIGURE 11.   HIGH COMPETITIVE RIVALRY
FIGURE 12.   IMPACT ANALYSES, EUROPE EARLY TOXICITY TESTING MARKET
FIGURE 13.   ENZYME TOXICITY ASSASYS MARKET, 2017–2025 ($MILLION)
FIGURE 14.   BACTERIAL TOXICITY ASSAYS MARKET, 2017–2025 ($MILLION)
FIGURE 15.   CELL-BASED ELISA AND WESTERN BLOTS MARKET, 2017–2025 ($MILLION)
FIGURE 16.   TISSUES CULTURE ASSAYS MARKET, 2017–2025 ($MILLION)
FIGURE 17.   RECEPTOR BINDING ASSAYS MARKET, 2017–2025 ($MILLION)
FIGURE 18.   OTHER ASSAYS MARKET, 2017–2025 ($MILLION)
FIGURE 19.   DERMAL TOXICITY MARKET, 2017–2025 ($MILLION)
FIGURE 20.   SYSTEMIC TOXICITY MARKET, 2017–2025 ($MILLION)
FIGURE 21.   CARCINOGENICITY MARKET, 2017–2025 ($MILLION)
FIGURE 22.   OCULAR TOXICITY MARKET, 2017–2025 ($MILLION)
FIGURE 23.   SKIN SENSITIZATION AND IRRITATION MARKET, 2017–2025 ($MILLION)
FIGURE 24.   GENOTOXICITY MARKET, 2017–2025 ($MILLION)
FIGURE 25.   NEUROTOXICITY MARKET, 2017–2025 ($MILLION)
FIGURE 26.   ORGAN TOXICITY MARKET, 2017–2025 ($MILLION)
FIGURE 27.   OTHER TOXICITY ENDPOINTS MARKET, 2017–2025 ($MILLION)
FIGURE 28.   EXAMINATION MARKET, 2017–2025 ($MILLION)
FIGURE 29.   SURGICAL MARKET, 2017–2025 ($MILLION)
FIGURE 30.   FOOD SERVICES MARKET, 2017–2025 ($MILLION)
FIGURE 31.   CLEAN ROOM MARKET, 2017–2025 ($MILLION)
FIGURE 32.   INDUSTRIAL MARKET, 2017–2025 ($MILLION)
FIGURE 33.   AGILENT: REVENUE, 2016–2018 ($MILLION)
FIGURE 34.   AGILENT: REVENUE SHARE BY OPERATING SEGMENT, 2018 (%)
FIGURE 01.   AGILENT: REVENUE SHARE BY GEOGRAPHY, 2017 (%)
FIGURE 02.   GE HEALTHCARE: NET SALES, 2016–2018 ($MILLION)
FIGURE 03.   GE HEALTHCARE: REVENUE SHARE BY SEGMENT, 2018 (%)
FIGURE 04.   GE HEALTHCARE: REVENUE SHARE BY REGION, 2018 (%)
FIGURE 05.   DANAHER: NET SALES, 2016–2018 ($MILLION)
FIGURE 06.   DANAHER: REVENUE SHARE BY SEGMENT, 2018 (%)
FIGURE 07.   DANAHER: REVENUE SHARE BY GEOGRAPHY, 2018 (%)
FIGURE 08.   EVOTEC: NET SALES, 2016–2018 ($MILLION)
FIGURE 09.   EVOTEC: REVENUE SHARE BY SEGMENT, 2018 (%)
FIGURE 10.   EVOTEC: REVENUE SHARE BY REGION, 2018 (%)
FIGURE 11.   BASI: NET SALES, 2016–2018 ($MILLION)
FIGURE 12.   BASI: REVENUE SHARE BY SEGMENT, 2018 (%)
FIGURE 13.   BASI: REVENUE SHARE BY REGION, 2018 (%)
FIGURE 14.   BRUKER: NET SALES, 2016–2018 ($MILLION)
FIGURE 15.   BRUKER: REVENUE SHARE BY SEGMENT, 2018 (%)
FIGURE 16.   BRUKER: REVENUE SHARE BY REGION, 2018 (%)
FIGURE 17.   PERKINELMER: NET SALES, 2016–2018 ($MILLION)
FIGURE 18.   PERKINELMER: REVENUE SHARE BY SEGMENT, 2018 (%)
FIGURE 19.   PERKINELMER: REVENUE SHARE BY REGION, 2018 (%)
FIGURE 20.   ENZO: NET SALES, 2016–2018 ($MILLION)
FIGURE 21.   ENZO: REVENUE SHARE BY REGION, 2018 (%)
FIGURE 22.   JAX: NET SALES, 2016–2018 ($MILLION)
FIGURE 23.   THERMO FISHER SCIENTIFIC: REVENUE, 2016–2018 ($MILLION)
FIGURE 24.   THERMO FISHER SCIENTIFIC: REVENUE SHARE, BY SEGMENT, 2018 (%)
FIGURE 25.   THERMO FISHER SCIENTIFIC: REVENUE SHARE, BY GEOGRAPHY, 2018 (%)
Start reading instantly.
This Report and over 67,404+ more Reports, Available with Avenue Library. T&C*.
Enterprise
License/PDF
Library
Membership
*Taxes/Fees, if applicable will be added during checkout. All prices in USD
To ensure high-level data integrity, accurate analysis, and impeccable forecasts
For complete satisfaction
On-demand customization of scope of the report to exactly meet your needs
Targeted market view to provide pertinent information and save time of readers
Get insights on topics that are crucial for your business. Stay abreast of your interest areas.
Get Industry Data AlertsTo ensure high-level data integrity, accurate analysis, and impeccable forecasts
For complete satisfaction
On-demand customization of scope of the report to exactly meet your needs
Targeted market view to provide pertinent information and save time of readers