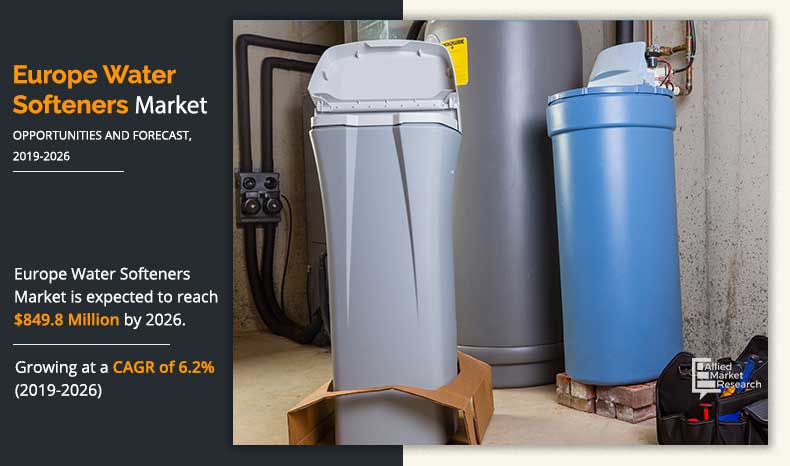
Report Code: A06069 | Mar 2020 | Pages: 195 | ||
Tables: 120 | Charts: 30 |
|
Pandemic disrupted the entire world and affected many industries.
Get detailed COVID-19 impact analysis on the Europe Water Softeners Market
Request Now !The Europe water softeners market was valued at $463.9 million in 2016 and is projected to reach $849.8 million by 2026, growing at a CAGR of 6.2% from 2019 to 2026. Water is a vital raw material in numerous manufacturing industries such as pulp & paper, food & beverages, metal & mining, and power generation. These industries utilize water for production processes such as fabrication, processing, washing, diluting, and cooling. Water is also used for household and drinking purposes. When water contains a significant amount of calcium and magnesium, it is called hard water, which is responsible for clogging pipes and to complicate soap and detergent dissolving in water. Water softening is a technique that removes the ions that cause the water to be hard, in most cases calcium and magnesium ions. Iron ions are also removed during the softening process.
Europe water softeners market growth is driven by rapid urbanization which has increased the need for residential water treatment to cater to the increase in demand for drinking water and sanitation services. Increase in demand for water softeners in end-user industries and rise in investment in industrial sector are expected to boost the demand for water softeners in the European market. On the other hand, increase in use of innovative wastewater treatment techniques such as ion-exchange resin method, lime softening, reverse osmosis, and washing soda method is also expected to accelerate the market growth.
However, alternate water purifying technologies are restraining the growth of the Europe water softeners market. Substitute methods for water treatment, such as membrane processes and UV radiation, involves membrane processes, which include microfiltration, ultrafiltration, nanofiltration, and reverse osmosis.
These methods can remove bacteria, viruses, and a wide range of chemical contaminants with negligible or least chemical usage on a small scale. There is an increase in the adoption of alternate methods to reduce the usage of chemicals and thus filter the water for consumption. Lack of financial needs in European water treatment sector and potential health risks of Softeners for people on low sodium diets is also expected to hamper the growth of the market.
The Europe water softeners market is yet to explore its full potential. Opportunities for key players to expand and introduce innovation in the water Softeners market for the emerging economies are anticipated to provide lucrative growth to the market. Partnership between key public and private stakeholders and introduction of energy efficient advanced water treatment technologies is also expected to offer growth opportunities to the Europe water Softeners market.
In Europe, Public-private partnerships (PPPs) is enabling governments to fund the required investment and bring water treatment technology and efficiency in the water sector. Partnership between key public and private stakeholders of Europe is expected to drive the growth of the market in near future. The European Water Partnership, a Brussels based nonprofit organization, combine with people and stakeholders to build a common water vision for Europe. The organization is involved in developing policies, and standard to address Europe’s water challenges by 2030. Such partnerships are expected to play a major role in increasing the demand for clean water. The requirement of water softeners is predicted to increase significantly with the rise in demand for clean water.
By type, the Europe water softeners market is bifurcated into salt-based water softeners and salt-free water softeners. The increase in use of salt-based water softeners in residential application drives the growth of the salt-based water softeners market. By process, the market is categorized into ion exchange, conditioning, and reverse osmosis. By end use, the market is divided into residential, industrial, and commercial. The rise in requirement of clean and safe drinking water in residential areas also boosts the growth of the water softeners market. Country wise, the market is analyzed across Netherland, France, UK, Italy, Germany, Spain, and rest of Europe.
Spain, France, and the Netherlands holds the significant position in Europe water softeners market size and are the top investment regions. The market growth, innovation, technologies, and leading competitors boost the adoption of water softeners. Water softeners players adopt strategies to compete in customer attractiveness and distribution channels. Strict government guidelines to control contamination in drinking water, as well as rise in awareness toward public health is predicted to increase adoption of water softeners in these regions.
The key players involved in Europe water softeners industry are A. O. Smith Corporation, Cumulus Nederland BV, Delta WATER TECHNOLOGY, Enmetec GmbH, Hatenboer-Water BV, Kinetico UK Ltd., LENNTECH, Lubron Waterbehandeling B.V., Pentair PLC, Pollet Water Group (Euraqua Europe is subsidiary) and SUEZ Water Technologies & Solutions.
To stay competitive in the market, key players have adopted strategies such as agreement, acquisition, collaboration, partnership, expansion, and product & technology launch to gain competitive advantage in the Europe water softeners market share. A.O. Smith Corporation acquired Water-Right, Inc., a Wisconsin-based water treatment company. This acquisition reinforced its geographical position and added a brand named Evolve, WaterCare, Sanitizer Series, Impression Series and CustomCare to its product portfolio. Pentair acquired Pelican Water Systems, in DeLand, Fla. Pelican provides residential whole home water treatment systems. This acquisition reinforced its geographical position and added a brand named to its product portfolio.
Europe Water Softeners Market Report Highlights
Aspects | Details |
---|---|
By Type |
|
By Process |
|
By End Use |
|
By Country |
|
Key Market Players | LENNTECH, SUEZ WATER TECHNOLOGIES & SOLUTIONS, ENMETEC GmbH, LUBRON WATERBEHANDELING B.V., POLLET WATER GROUP NV, KINETICO UK LTD., AQUACOMBI, CUMULUS NEDERLAND BV, REMON WATERONTHERDERS, A. O. SMITH CORPORATION, SENSORSOFT, HATENBOER-WATER BV, PENTAIR PLC |
CHAPTER 1: INTRODUCTION
1.1. Report description
1.2. Key benefits for stakeholders
1.3. Key market segments
1.3.1. List of key players profiled in the report
1.4. Research methodology
1.4.1. Secondary research
1.4.2. Primary research
1.4.3. Analyst tools and models
CHAPTER 2: EXECUTIVE SUMMARY
2.1. CXO Perspective
CHAPTER 3: MARKET OVERVIEW
3.1. Market definition and scope
3.2. Key findings
3.2.1. Top investment pockets
3.3. Key forces shaping Europe water Softeners market
3.3.1. Bargaining power of suppliers
3.3.2. Bargaining power of buyer
3.3.3. Threat of new entrants
3.3.4. Threat of substitute
3.3.5. Intensity of competitive rivalry
3.4. Market dynamics
3.4.1. Drivers
3.4.1.1. Surge in population drives demand for water
3.4.1.2. Increase in demand for water Softeners in municipalities and industries
3.4.1.3. Increase in investment in industrial sector
3.4.2. Restraints
3.4.2.1. Presence of alternative water treatment methods
3.4.2.2. Potential health risks for people on low sodium diets
3.4.3. Opportunities
3.4.3.1. Increase in demand from emerging economies
3.4.3.2. Partnership between key public and private stakeholders
3.5. Pricing analysis
3.5.1. Pricing analysis of water Softeners market, by country, 2016 to 2026
3.6. Impact of government regulations on water softeners market
3.7. Value chain analysis
3.8. Patent analysis
3.8.1. By Region (2012-2018)
CHAPTER 4: EUROPE WATER SOFTENERS MARKET, BY TYPE
4.1. Overview
4.1.1. Market size and forecast
4.2. Salt based water Softeners
4.2.1. Key market trends, growth factors and opportunities
4.2.2. Market size and forecast
4.3. Salt free
4.3.1. Key market trends, growth factors and opportunities
4.3.2. Market size and forecast
CHAPTER 5: EUROPE WATER SOFTENERS MARKET, BY PROCESS
5.1. Overview
5.1.1. Market size and forecast
5.2. Ion exchange
5.2.1. Key market trends, growth factors and opportunities
5.2.2. Market size and forecast
5.3. Conditioning
5.3.1. Key market trends, growth factors and opportunities
5.3.2. Market size and forecast
5.4. Reverse osmosis
5.4.1. Key market trends, growth factors and opportunities
5.4.2. Market size and forecast
CHAPTER 6: EUROPE WATER SOFTENERS MARKET, BY END USE
6.1. Overview
6.1.1. Market size and forecast
6.2. Residential
6.2.1. Key market trends, growth factors and opportunities
6.2.2. Market size and forecast
6.3. Industrial
6.3.1. Key market trends, growth factors and opportunities
6.3.2. Market size and forecast
6.4. Commercial
6.4.1. Key market trends, growth factors and opportunities
6.4.2. Market size and forecast
6.4.3. Office Buildings
6.4.4. Hotel & Restaurants
6.4.5. Hospitals & Nursing Homes
6.4.6. Others
CHAPTER 7: WATER SOFTENERS MARKET, BY COUNTRY
7.1. Overview
7.1.1. Market size and forecast
7.2. Europe
7.2.1. Key market trends, growth factors, and opportunities
7.2.1.1. Germany
7.2.1.1.1. Germany Market size and forecast, by type
7.2.1.1.2. Germany Market size and forecast, by process
7.2.1.1.3. Germany Market size and forecast, by commercial
7.2.1.1.4. Germany Market size and forecast, by end-use
7.2.1.2. Netherland
7.2.1.2.1. Netherland Market size and forecast, by type
7.2.1.2.2. Netherland Market size and forecast, by process
7.2.1.2.3. Netherland Market size and forecast, by commercial
7.2.1.2.4. Netherland Market size and forecast, by end-use
7.2.1.3. France
7.2.1.3.1. France Market size and forecast, by type
7.2.1.3.2. France Market size and forecast, by process
7.2.1.3.3. France Market size and forecast, by commercial
7.2.1.3.4. France Market size and forecast, by end-use
7.2.1.4. UK
7.2.1.4.1. UK Market size and forecast, by type
7.2.1.4.2. UK Market size and forecast, by process
7.2.1.4.3. UK Market size and forecast, by commercial
7.2.1.4.4. UK Market size and forecast, by end-use
7.2.1.5. Italy
7.2.1.5.1. Italy Market size and forecast, by type
7.2.1.5.2. Italy Market size and forecast, by process
7.2.1.5.3. Italy Market size and forecast, by commercial
7.2.1.5.4. Italy Market size and forecast, by end-use
7.2.1.6. Spain
7.2.1.6.1. Spain Market size and forecast, by type
7.2.1.6.2. Spain Market size and forecast, by process
7.2.1.6.3. Spain Market size and forecast, by commercial
7.2.1.6.4. Spain Market size and forecast, by end-use
7.2.1.7. Rest of Europe
7.2.1.7.1. Rest of Europe Market size and forecast, by type
7.2.1.7.2. Rest of Europe Market size and forecast, by process
7.2.1.7.3. Rest of Europe Market size and forecast, by commercial
7.2.1.7.4. Rest of Europe Market size and forecast, by end-use
CHAPTER 8: COMPETITIVE LANDSCAPE
8.1. Introduction
8.1.1. Market player positioning, 2018
8.2. Top winning strategies
8.2.1. Top winning strategies, by year
8.2.2. Top winning strategies, by development
8.2.3. Top winning strategies, by company
8.3. Product Mapping of Top 10 Player
8.4. Competitive Dashboard
8.5. Key Developments
8.5.1. Mergers and acquisition
CHAPTER 9: COMPANY PROFILES:
9.1. A. O. SMITH CORPORATION
9.1.1. Company overview
9.1.2. Company snapshot
9.1.3. Operating business segments
9.1.4. Product portfolio
9.1.5. Business performance
9.1.6. Key strategic moves and developments
9.2. AQUACOMBI
9.2.1. Company overview
9.2.2. Company snapshot
9.2.3. Product portfolio
9.3. CUMULUS NEDERLAND BV
9.3.1. Company overview
9.3.2. Company snapshot
9.3.3. Product portfolio
9.4. ENMETEC GmbH
9.4.1. Company overview
9.4.2. Company snapshot
9.4.3. Product portfolio
9.5. HATENBOER-WATER BV
9.5.1. Company overview
9.5.2. Company snapshot
9.5.3. Operating business segments
9.5.4. Product portfolio
9.6. KINETICO UK LTD.
9.6.1. Company overview
9.6.2. Company snapshot
9.6.3. Operating business segments
9.6.4. Product portfolio
9.7. LENNTECH
9.7.1. Company overview
9.7.2. Company snapshot
9.7.3. Product portfolio
9.8. LUBRON WATERBEHANDELING B.V.
9.8.1. Company overview
9.8.2. Company snapshot
9.8.3. Product portfolio
9.9. PENTAIR PLC
9.9.1. Company overview
9.9.2. Company snapshot
9.9.3. Operating business segments
9.9.4. Product portfolio
9.9.5. Business performance
9.9.6. Key strategic moves and developments
9.10. POLLET WATER GROUP NV
9.10.1. Company overview
9.10.2. Company snapshot
9.10.3. Product portfolio
9.11. REMON WATERONTHERDERS
9.11.1. Company overview
9.11.2. Company snapshot
9.11.3. Product portfolio
9.12. SENSORSOFT
9.12.1. Company overview
9.12.2. Company snapshot
9.12.3. Product portfolio
9.13. SUEZ WATER TECHNOLOGIES & SOLUTIONS
9.13.1. Company overview
9.13.2. Company snapshot
9.13.3. Operating business segments
9.13.4. Product portfolio
9.13.5. Business performance
9.13.6. Key strategic moves and developments
LIST OF TABLES
TABLE 01. EUROPE WATER SOFTENERS MARKET, BY TYPE 2016-2026, ($MILLION)
TABLE 02. EUROPE WATER SOFTENERS MARKET, BY TYPE 2016-2026, (UNITS)
TABLE 03. SALT-BASED WATER SOFTENERS MARKET, BY COUNTRY 2016-2026, ($MILLION)
TABLE 04. SALT-BASED WATER SOFTENERS MARKET, BY COUNTRY 2016-2026, (UNITS)
TABLE 05. SALT-FREE WATER SOFTENERS MARKET, BY COUNTRY 2016-2026, ($MILLION)
TABLE 06. SALT-FREE WATER SOFTENERS MARKET, BY COUNTRY 2016-2026, (UNITS)
TABLE 07. EUROPE WATER SOFTENERS MARKET, BY PROCESS 2016-2026, ($MILLION)
TABLE 08. EUROPE WATER SOFTENERS MARKET, BY PROCESS 2016-2026, (UNITS)
TABLE 09. EUROPE WATER SOFTENERS MARKET FOR ION EXCHANGE, BY COUNTRY 2016-2026, ($MILLION)
TABLE 10. EUROPE WATER SOFTENERS MARKET FOR ION EXCHANGE, BY COUNTRY 2016-2026, (UNITS)
TABLE 11. EUROPE WATER SOFTENERS MARKET FOR CONDITIONING, BY COUNTRY 2016-2026, ($MILLION)
TABLE 12. EUROPE WATER SOFTENERS MARKET FOR CONDITIONING, BY COUNTRY 2016-2026, (UNITS)
TABLE 13. EUROPE WATER SOFTENERS MARKET FOR REVERSE OSMOSIS, BY COUNTRY 2016-2026, ($MILLION)
TABLE 14. EUROPE WATER SOFTENERS MARKET FOR REVERSE OSMOSIS, BY COUNTRY 2016-2026, (UNITS)
TABLE 15. EUROPE WATER SOFTENERS MARKET, BY END-USE 2016-2026, ($MILLION)
TABLE 16. EUROPE WATER SOFTENERS MARKET, BY END-USE 2016-2026, (UNITS)
TABLE 17. EUROPE WATER SOFTENERS MARKET, BY COMMERCIAL END-USE 2016-2026, ($MILLION)
TABLE 18. EUROPE WATER SOFTENERS MARKET, BY COMMERCIAL END-USE 2016-2026, (UNITS)
TABLE 19. RESIDENTIAL WATER SOFTENERS MARKET, BY COUNTRY 2016-2026, ($MILLION)
TABLE 20. RESIDENTIAL WATER SOFTENERS MARKET, BY COUNTRY 2016-2026, (UNITS)
TABLE 21. INDUSTRIAL WATER SOFTENERS MARKET, BY COUNTRY 2016-2026, ($MILLION)
TABLE 22. INDUSTRIAL WATER SOFTENERS MARKET, BY COUNTRY 2016-2026, (UNITS)
TABLE 23. COMMERCIAL WATER SOFTENERS MARKET, BY COUNTRY 2016-2026, ($MILLION)
TABLE 24. COMMERCIAL WATER SOFTENERS MARKET, BY COUNTRY 2016-2026, (UNITS)
TABLE 25. EUROPE WATER SOFTENERS MARKET, BY COUNTRY 2016-2026, ($MILLION)
TABLE 26. EUROPE WATER SOFTENERS MARKET, BY COUNTRY 2016-2026, (UNITS)
TABLE 27. GERMANY WATER SOFTENERS MARKET, BY TYPE 2016-2026, ($MILLION)
TABLE 28. GERMANY WATER SOFTENERS MARKET, BY TYPE 2016-2026, (UNITS)
TABLE 29. GERMANY WATER SOFTENERS MARKET, BY PROCESS 2016-2026, ($MILLION)
TABLE 30. GERMANY WATER SOFTENERS MARKET, BY PROCESS 2016-2026, (UNITS)
TABLE 31. GERMANY WATER SOFTENERS MARKET, BY COMMERCIAL 2016-2026, ($MILLION)
TABLE 32. GERMANY WATER SOFTENERS MARKET, BY COMMERCIAL 2016-2026, (UNITS)
TABLE 33. GERMANY WATER SOFTENERS MARKET, BY END-USE 2016-2026, ($MILLION)
TABLE 34. GERMANY WATER SOFTENERS MARKET, BY END-USE 2016-2026, (UNITS)
TABLE 35. NETHERLAND WATER SOFTENERS MARKET, BY TYPE 2016-2026, ($MILLION)
TABLE 36. NETHERLAND WATER SOFTENERS MARKET, BY TYPE 2016-2026, (UNITS)
TABLE 37. NETHERLAND WATER SOFTENERS MARKET, BY PROCESS 2016-2026, ($MILLION)
TABLE 38. NETHERLAND WATER SOFTENERS MARKET, BY PROCESS 2016-2026, (UNITS)
TABLE 39. NETHERLAND WATER SOFTENERS MARKET, BY COMMERCIAL 2016-2026, ($MILLION)
TABLE 40. NETHERLAND WATER SOFTENERS MARKET, BY COMMERCIAL 2016-2026, (UNITS)
TABLE 41. NETHERLAND WATER SOFTENERS MARKET, BY END-USE 2016-2026, ($MILLION)
TABLE 42. NETHERLAND WATER SOFTENERS MARKET, BY END-USE 2016-2026, (UNITS)
TABLE 43. FRANCE WATER SOFTENERS MARKET, BY TYPE 2016-2026, ($MILLION)
TABLE 44. FRANCE WATER SOFTENERS MARKET, BY TYPE 2016-2026, (UNITS)
TABLE 45. FRANCE WATER SOFTENERS MARKET, BY PROCESS 2016-2026, ($MILLION)
TABLE 46. FRANCE WATER SOFTENERS MARKET, BY PROCESS 2016-2026, (UNITS)
TABLE 47. FRANCE WATER SOFTENERS MARKET, BY COMMERCIAL 2016-2026, ($MILLION)
TABLE 48. FRANCE WATER SOFTENERS MARKET, BY COMMERCIAL 2016-2026, (UNITS)
TABLE 49. FRANCE WATER SOFTENERS MARKET, BY END-USE 2016-2026, ($MILLION)
TABLE 50. FRANCE WATER SOFTENERS MARKET, BY END-USE 2016-2026, (UNITS)
TABLE 51. UK WATER SOFTENERS MARKET, BY TYPE 2016-2026, ($MILLION)
TABLE 52. UK WATER SOFTENERS MARKET, BY TYPE 2016-2026, (UNITS)
TABLE 53. UK WATER SOFTENERS MARKET, BY PROCESS 2016-2026, ($MILLION)
TABLE 54. UK WATER SOFTENERS MARKET, BY PROCESS 2016-2026, (UNITS)
TABLE 55. UK WATER SOFTENERS MARKET, BY COMMERCIAL 2016-2026, ($MILLION)
TABLE 56. UK WATER SOFTENERS MARKET, BY COMMERCIAL 2016-2026, (UNITS)
TABLE 57. UK WATER SOFTENERS MARKET, BY END-USE 2016-2026, ($MILLION)
TABLE 58. UK WATER SOFTENERS MARKET, BY END-USE 2016-2026, (UNITS)
TABLE 59. ITALY WATER SOFTENERS MARKET, BY TYPE 2016-2026, ($MILLION)
TABLE 60. ITALY WATER SOFTENERS MARKET, BY TYPE 2016-2026, (UNITS)
TABLE 61. ITALY WATER SOFTENERS MARKET, BY PROCESS 2016-2026, ($MILLION)
TABLE 62. ITALY WATER SOFTENERS MARKET, BY PROCESS 2016-2026, (UNITS)
TABLE 63. ITALY WATER SOFTENERS MARKET, BY COMMERCIAL 2016-2026, ($MILLION)
TABLE 64. ITALY WATER SOFTENERS MARKET, BY COMMERCIAL 2016-2026, (UNITS)
TABLE 65. ITALY WATER SOFTENERS MARKET, BY END-USE 2016-2026, ($MILLION)
TABLE 66. ITALY WATER SOFTENERS MARKET, BY END-USE 2016-2026, (UNITS)
TABLE 67. SPAIN WATER SOFTENERS MARKET, BY TYPE 2016-2026, ($MILLION)
TABLE 68. SPAIN WATER SOFTENERS MARKET, BY TYPE 2016-2026, (UNITS)
TABLE 69. SPAIN WATER SOFTENERS MARKET, BY PROCESS 2016-2026, ($MILLION)
TABLE 70. SPAIN WATER SOFTENERS MARKET, BY PROCESS 2016-2026, (UNITS)
TABLE 71. SPAIN WATER SOFTENERS MARKET, BY COMMERCIAL 2016-2026, ($MILLION)
TABLE 72. SPAIN WATER SOFTENERS MARKET, BY COMMERCIAL 2016-2026, (UNITS)
TABLE 73. SPAIN WATER SOFTENERS MARKET, BY END-USE 2016-2026, ($MILLION)
TABLE 74. SPAIN WATER SOFTENERS MARKET, BY END-USE 2016-2026, (UNITS)
TABLE 75. REST OF EUROPE WATER SOFTENERS MARKET, BY TYPE 2016-2026, ($MILLION)
TABLE 76. REST OF EUROPE WATER SOFTENERS MARKET, BY TYPE 2016-2026, (UNITS)
TABLE 77. REST OF EUROPE WATER SOFTENERS MARKET, BY PROCESS 2016-2026, ($MILLION)
TABLE 78. REST OF EUROPE WATER SOFTENERS MARKET, BY PROCESS 2016-2026, (UNITS)
TABLE 79. REST OF EUROPE WATER SOFTENERS MARKET, BY COMMERCIAL 2016-2026, ($MILLION)
TABLE 80. REST OF EUROPE WATER SOFTENERS MARKET, BY COMMERCIAL 2016-2026, (UNITS)
TABLE 81. REST OF EUROPE WATER SOFTENERS MARKET, BY END-USE 2016-2026, ($MILLION)
TABLE 82. REST OF EUROPE WATER SOFTENERS MARKET, BY END-USE 2016-2026, (UNITS)
TABLE 83. KEY MERGERS AND ACQUISITION (2016-2019)
TABLE 84. A. O. SMITH: COMPANY SNAPSHOT
TABLE 85. A. O. SMITH: OPERATING SEGMENTS
TABLE 86. A. O. SMITH: PRODUCT PORTFOILIO
TABLE 87. OVERALL FINANCIAL STATUS ($MILLION)
TABLE 88. A. O. SMITH: KEY STRATEGIC MOVES AND DEVELOPMENTS
TABLE 89. AQUACOMBI: COMPANY SNAPSHOT
TABLE 90. AQUACOMBI: PRODUCT PORTFOLIO
TABLE 91. CUMULUS: COMPANY SNAPSHOT
TABLE 92. CUMULUS: PRODUCT PORTFOLIO
TABLE 93. ENMET: COMPANY SNAPSHOT
TABLE 94. MITSUBISHI MOTORS CORPORATION: PRODUCT PORTFOLIO
TABLE 95. HATENBOER: COMPANY SNAPSHOT
TABLE 96. HATENBOER: OPERATING SEGMENTS
TABLE 97. HATENBOER: PRODUCT PORTFOLIO
TABLE 98. KINETICO: COMPANY SNAPSHOT
TABLE 99. KINETICO: OPERATING SEGMENTS
TABLE 100. KINETICO: PRODUCT PORTFOLIO
TABLE 101. LENNTECH: COMPANY SNAPSHOT
TABLE 102. LENNTECH: PRODUCT PORTFOLIO
TABLE 103. LUBRON: COMPANY SNAPSHOT
TABLE 104. LUBRON: PRODUCT PORTFOLIO
TABLE 105. PENTAIR: COMPANY SNAPSHOT
TABLE 106. PENTAIR: OPERATING SEGMENTS
TABLE 107. PENTAIR: PRODUCT PORTFOLIO
TABLE 108. OVERALL FINANCIAL STATUS ($MILLION)
TABLE 109. PENTAIR: KEY STRATEGIC MOVES AND DEVELOPMENTS
TABLE 110. POLLET WATER GROUP: COMPANY SNAPSHOT
TABLE 111. POLLET WATER GROUP: PRODUCT PORTFOLIO
TABLE 112. REMON: COMPANY SNAPSHOT
TABLE 113. REMON: PRODUCT PORTFOLIO
TABLE 114. SENSORSOFT: COMPANY SNAPSHOT
TABLE 115. SENSORSOFT: PRODUCT PORTFOLIO
TABLE 116. SUEZ WATER TECHNOLOGIES & SOLUTIONS: COMPANY SNAPSHOT
TABLE 117. SUEZ WATER TECHNOLOGIES & SOLUTIONS: OPERATING SEGMENTS
TABLE 118. SUEZ WATER TECHNOLOGIES & SOLUTIONS: PRODUCT PORTFOLIO
TABLE 119. OVERALL FINANCIAL STATUS ($MILLION)
TABLE 120. SUEZ WATER TECHNOLOGIES & SOLUTIONS: KEY STRATEGIC MOVES AND DEVELOPMENTS
LIST OF FIGURES
FIGURE 01. WATER SOFTENERS MARKET SEGMENTATION
FIGURE 02. TOP INVESTMENT POCKETS
FIGURE 03. MODERATE BARGAINING POWER OF SUPPLIERS
FIGURE 04. MODERATE BARGAINING POWER OF BUYERS
FIGURE 05. LOW THREAT OF NEW ENTRANTS
FIGURE 06. MODERATE THREAT OF SUBSTITUTES
FIGURE 07. HIGH INTENSITY OF COMPETITIVE RIVALRY
FIGURE 08. MARKET DYNAMICS
FIGURE 09. PATENT ANALYSIS, BY REGION (2011-2029)
FIGURE 10. GERMANY CAUSTIC SODA MARKET REVENUE, 2016–2026 ($MILLION)
FIGURE 11. NETHERLAND CAUSTIC SODA MARKET REVENUE, 2016–2026 ($MILLION)
FIGURE 12. FRANCE CAUSTIC SODA MARKET REVENUE, 2016–2026 ($MILLION)
FIGURE 13. UK CAUSTIC SODA MARKET REVENUE, 2016–2026 ($MILLION)
FIGURE 14. ITALY CAUSTIC SODA MARKET REVENUE, 2016–2026 ($MILLION)
FIGURE 15. SPAIN CAUSTIC SODA MARKET REVENUE, 2016–2026 ($MILLION)
FIGURE 16. REST OF EUROPE CAUSTIC SODA MARKET REVENUE, 2016–2026 ($MILLION)
FIGURE 17. MARKET PLAYER POSITIONING, 2018
FIGURE 18. TOP WINNING STRATEGIES, BY YEAR, 2016–2019
FIGURE 19. TOP WINNING STRATEGIES, BY DEVELOPMENT, 2016–2019 (%)
FIGURE 20. TOP WINNING STRATEGIES, BY COMPANY, 2016–2019
FIGURE 21. PRODUCT MAPPING OF TOP 10 PLAYERS
FIGURE 22. COMPETITIVE DASHBOARD
FIGURE 23. A. O. SMITH: REVENUE, 2016–2018 ($MILLION)
FIGURE 24. A. O. SMITH: REVENUE SHARE BY SEGMENT, 2018 (%)
FIGURE 25. A. O. SMITH: REVENUE SHARE BY REGION, 2018 (%)
FIGURE 26. PENTAIR: REVENUE, 2016–2019 ($MILLION)
FIGURE 27. PENTAIR: REVENUE SHARE BY SEGMENT, 2018 (%)
FIGURE 28. SUEZ WATER TECHNOLOGIES & SOLUTIONS: REVENUE, 2016–2018 ($MILLION)
FIGURE 29. SUEZ WATER TECHNOLOGIES & SOLUTIONS: REVENUE SHARE BY SEGMENT, 2018 (%)
FIGURE 30. SUEZ WATER TECHNOLOGIES & SOLUTIONS: REVENUE SHARE BY REGION, 2018 (%)
The rise in number of end-user industries and increase in investment in industries, such as chemical, pharmaceuticals, pulp & paper, metal processing, and food & beverages including others lead to high demand for water treatment processes. As a result, there is a growth in demand for water softeners in these industries. The Netherlands spent around $4.12 billion on treating drinking water, managing the sewer system and treating wastewater in 2010. This sum is expected to rise by $4.77 billion by 2020.
Supply water is composed of several chemical impurities, such as calcium, magnesium, silica, iron, and various other metal ions and minerals in Netherland. Hence, water softeners as purification systems are used increasingly to soften water by removing minerals, such as calcium and magnesium. Around 2,000 companies are active in the Dutch water sector, out of which 1,500 in water technology. Several water purification companies have come forward into the water softeners business to expand market opportunities. In 2016, Total Soft Water had launched efficient, cost-effective Kinetico Premier Compact Water Softeners with a longer life span. The presence of alternative water treatment processes, such as UV radiation hampers the growth of the market. At present, power generation is one of the leading consumers of water among all industries. There is an increase in the use of water softeners owing to need for water treatment & its reuse.
A. Rapid urbanization in Europe has increased the need for residential and commercial water treatment to cater to the increase in demand for drinking water and sanitation services. Increase in demand for water softener in end-user industries and rise in investment in industrial sector are expected to boost the demand for water softener in the European market.
A. The Europe water softeners market is projected to reach $849.8 million by 2026.
A. The Spain water softeners market is growing significantly due to growth in the water consumption. Prevalence of water-borne diseases in this country is also generating need for water softener. In addition, environmental obligations regarding use of clean water, water recycling, and reuse also drive the growth of the water softeners market.
A. To stay competitive in the Europe water softeners market, key players have adopted strategies such as agreement, acquisition, collaboration, partnership, expansion, and product & technology launch to gain competitive advantage in this market.
A. End-user industries, such as oil & gas, food & beverages, paper & pulp, personal care & chemicals, and metal processing including many others are using water softeners for converting hard water to soft water.
A. Acquisiiton is the main growth strategy adopted by key players. In an instance, A.O. Smith Corporation acquired Water-Right, Inc., a Wisconsin-based water treatment company. This acquisition reinforced its geographical position and added a brand named Evolve, WaterCare, Sanitizer Series, Impression Series and CustomCare to its product portfolio
A. The Europe water softeners market is bifurcated into salt-based water softener and salt-free water softener. The increase in use of salt-based water softener in residential application drives the growth of the salt-based water softener market.
A. The Europe water softeners market was valued at $463.9 million in 2016 and is projected to reach $849.8 million by 2026, growing at a CAGR of 6.2% from 2019 to 2026.
Start reading instantly.
This Report and over 67,404+ more Reports, Available with Avenue Library. T&C*.
Enterprise
License/PDF
Library
Membership
*Taxes/Fees, if applicable will be added during checkout. All prices in USD
To ensure high-level data integrity, accurate analysis, and impeccable forecasts
For complete satisfaction
On-demand customization of scope of the report to exactly meet your needs
Targeted market view to provide pertinent information and save time of readers
Get insights on topics that are crucial for your business. Stay abreast of your interest areas.
Get Industry Data AlertsTo ensure high-level data integrity, accurate analysis, and impeccable forecasts
For complete satisfaction
On-demand customization of scope of the report to exactly meet your needs
Targeted market view to provide pertinent information and save time of readers