0
2022
Europic Chloride Market

Europic Chloride Market

by End use industry (Food and beverages, Chemical, Petrochemical, Marine, Others): Global Opportunity Analysis and Industry Forecast, 2021-2031

Report Code: A16989
Jun 2022 | Pages: 151
Tables: 90
Charts: 56
  • Formats*:

  • pdf

    Single User License, Five User
    License & Enterprise User License

  • xls

    Data Pack Excel License

  • ppt

    It comes with the additional cost
    of $2500.00 contact sales.


Europic Chloride Market Research, 2031

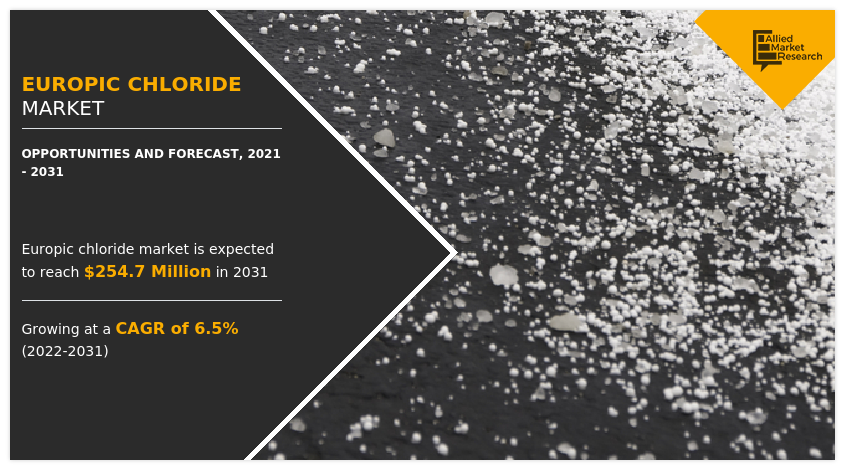
The global europic chloride market was valued at $136.6 million in 2021, and is projected to reach $254.7 million by 2031, growing at a CAGR of 6.5% from 2022 to 2031.

COVID-19 had negative impact on europic chloride market owing to decreased in demand from chemical and petrochemical industry.

Europic chloride (EuCl3), also known as anhydrous europium chloride (III), is an inorganic compound. By rapidly absorbing water, the anhydrous chemical may be immediately transformed into the white crystalline hexahydrate (EuCl36H2O), which is a yellow solid. There are several other names for europic chloride, including , europium chloride (VAN), europium chloride (EuCl3), europium trichloride, europium chloride (Eu2Cl6), and europium (III) chloride anhydrous Europium is present in high-grade minerals such calcium aluminum silicates. It is a soft metal with a silvery hue that resembles lead. In the food & beverage sector, europic chloride is utilized in the process of food preservation. In addition, it can be utilized in the process of desalination, which draws out chloride salts from seawater to produce drinkable water.
Europic Chloride Market, Europic Chloride Industry, Europic Chloride Market Size, Europic Chloride Market Share, Europic Chloride Market Growth, Europic Chloride Market Forecast, Europic Chloride Market Trends

The principal application for europium is in phosphors, which are compounds that emit light. Red phosphors, which are more widely accessible, can be used to create televisions with brighter colors. Europium oxide-based phosphors provide red and blue light, which may be combined with yellow–green phosphor to produce white light. Europium phosphors are used in TVs, certain LEDs, and fluorescent lighting. Europium is further used in other optoelectronic devices and in lasers. As more people opt to buy their food already packed, there has been a simultaneous rise in the utilization of europic chloride as a food preservative.  This factor is the primary reason behind the growth of the europic chloride market. Furthermore, in the chemical and petrochemical industries, europic chloride is utilized as a source of alternative energy to produce electricity and to catalyze the decomposition of chloride-based materials via the electrolysis process, which results in the production of chlorine gas and metal.  Furthermore, expansion of the chemical and petrochemical industries is fueling the demand for europic chloride, which, in turn, is propelling the growth of the europic chloride market. However, europic chemical results in quick defecation, writhing, incoordination, hard breathing, and lethargy upon inhalation. It can further cause respiratory and cardiac collapse, leading to death. These factors are expected to hamper the expansion of europic chloride market.

The global europic chloride market is segmented into end-use industry and region. On the basis of end-use industry, the market is categorized into food & beverage, chemical, petrochemical, marine, and others. Region wise, the market is studied across North America, Europe, Asia-Pacific, and LAMEA.

The major players operating in the global europic chloride market include AK Scientific, Inc., Alfa Aesar Thermo Fisher Scientific, American Elements, Glentham Life Sciences Limited, MaTecK GmbH, Otto Chemie Pvt., Ltd., Santa Cruz Biotechnology, Inc., Stanford Advanced Materials, Strem Chemicals Inc., TCI Chemicals (India) Pvt., Ltd.

Other players operating in the europic chloride market are SRL (Sisco Research Laboratories Private Limited), Central Drug House, and Shanghai Xinglu Chemical Technology Co.
Europic Chloride Market

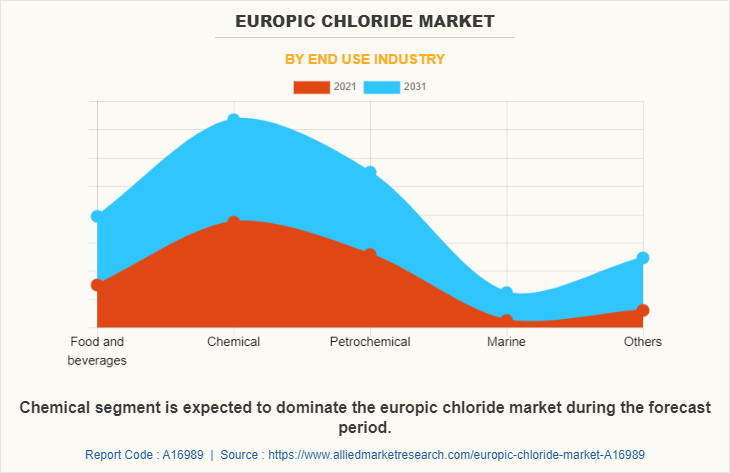
The chemical segment accounted for the largest share, i.e., 34.5%, and is estimated to grow at a CAGR of 5.9% during the forecast period. This is attributed to increased demand for europic chloride from the chemical sector ,as it is used in the production of electrolyte.
Europic Chloride Market

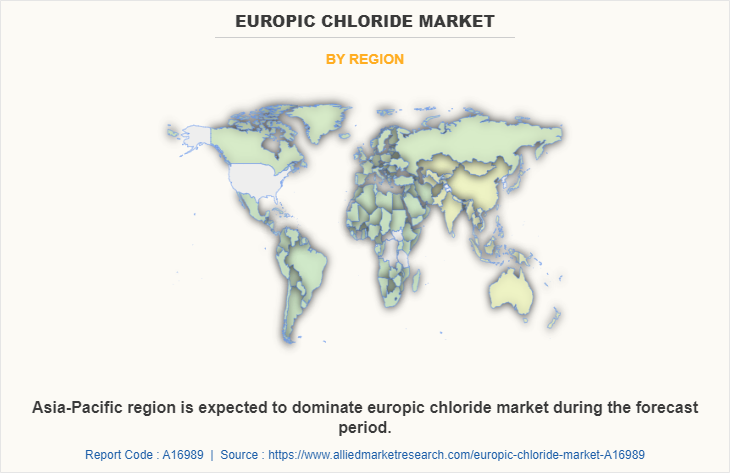
Asia-Pacific contributed the 46.4% market share in 2021, and is projected to grow at CAGR of 7.1% during the forecast period. This is attributed to surge in demand from chemical and petrochemical industries in Asia-Pacific.

COVID-19 Impact Analysis On The Global Europic Chloride Market

  • COVID-19 is an infectious disease that originated in Hubei province of the Wuhan city in China in late December. The highly contagious disease, caused by a virus, severe acute respiratory syndrome coronavirus 2 (SARS-CoV-2), is transmitted from humans to humans. Since the outbreak in December 2019, the disease has spread to almost 213 countries around the globe with the World Health Organization declaring it a public health emergency on March 11, 2020. 
  • The outbreak of COVID-19 pandemic had led to partial or complete shutdown of production facilities, which do not come under essential goods, owing to prolonged lockdown in major countries such as the U.S., China, Japan, India, and Germany. It has led to either closure or suspension of their production activities in most of the industrial units across the world. There is an uneven impact of COVID-19 pandemic on the europic chloride market, owing to implementation of lockdowns worldwide to halt spread of the virus. This resulted in shutting off of almost all operations, manufacturing, and distribution of all industries.
  • This has resulted in decrease in demand from chemical industry which, in turn, has led to sluggish growth of the market.
  • The demand–supply gap, disruptions in raw material procurement, price volatility, and many other such factors are expected to hamper growth of the chemical industry during the COVID-19 pandemic.
  • The COVID-19 crisis has affected the chemical industry supply chain to a major extent, thus, having a major impact on raw material procurement.
  • However, increase in demand for distilled and drinkable water due to the awareness regarding the cleanliness and hygiene boosts growth of the europic chloride market, which, in turn, tends to overcome effects of COVID-19 on this sector.
  • The future of the europic chloride market industry will be shaped by post pandemic changes in social, economic, trade, and political situations, as well as planned environmental regulatory reforms.

Key Benefits For Stakeholders

  • This report provides a quantitative analysis of the market segments, current trends, estimations, and dynamics of the europic chloride market analysis from 2021 to 2031 to identify the prevailing europic chloride market opportunities.
  • The market research is offered along with information related to key drivers, restraints, and opportunities.
  • Porter's five forces analysis highlights the potency of buyers and suppliers to enable stakeholders make profit-oriented business decisions and strengthen their supplier-buyer network.
  • In-depth analysis of the europic chloride market segmentation assists to determine the prevailing market opportunities.
  • Major countries in each region are mapped according to their revenue contribution to the global market.
  • Market player positioning facilitates benchmarking and provides a clear understanding of the present position of the market players.
  • The report includes the analysis of the regional as well as global europic chloride market trends, key players, market segments, application areas, and market growth strategies.

Europic Chloride Market Report Highlights

Aspects Details
By End use industry
  • Food and beverages
  • Chemical
  • Petrochemical
  • Marine
  • Others
By Region
  • North America  (U.S., Canada, Mexico)
  • Europe  (Germany, France, U.K., Spain, Italy, Rest of Europe)
  • Asia-Pacific  (China, Japan, India, South Korea, Australia, Rest Of Asia Pacific)
  • LAMEA  (Brazil, Saudi Arabia, South Africa, Rest of LAMEA)
Key Market Players TCI Chemicals, stanford advance materials, santa cruz biotechnology, strem chemicals, otto chemie, AK scientific incorporation, matech, alfa aesar a johnson matthey company, American Elements, Glentham Life Science
 
  • CHAPTER 1:INTRODUCTION

    • 1.1.Report description

    • 1.2.Key market segments

    • 1.3.Key benefits to the stakeholders

    • 1.4.Research Methodology

      • 1.4.1.Secondary research

      • 1.4.2.Primary research

      • 1.4.3.Analyst tools and models

  • CHAPTER 2:EXECUTIVE SUMMARY

    • 2.1.Key findings of the study

    • 2.2.CXO Perspective

  • CHAPTER 3:MARKET OVERVIEW

    • 3.1.Market definition and scope

    • 3.2.Key findings

      • 3.2.1.Top investment pockets

    • 3.3.Porter’s five forces analysis

    • 3.4.Top player positioning

    • 3.5.Market dynamics

      • 3.5.1.Drivers

      • 3.5.2.Restraints

      • 3.5.3.Opportunities

    • 3.6.COVID-19 Impact Analysis on the market

    • 3.7.Value Chain Analysis

    • 3.8.Patent Landscape

  • CHAPTER 4: EUROPIC CHLORIDE MARKET, BY END USE INDUSTRY

    • 4.1 Overview

      • 4.1.1 Market size and forecast

    • 4.2 Food and beverages

      • 4.2.1 Key market trends, growth factors and opportunities

      • 4.2.2 Market size and forecast, by region

      • 4.2.3 Market analysis by country

    • 4.3 Chemical

      • 4.3.1 Key market trends, growth factors and opportunities

      • 4.3.2 Market size and forecast, by region

      • 4.3.3 Market analysis by country

    • 4.4 Petrochemical

      • 4.4.1 Key market trends, growth factors and opportunities

      • 4.4.2 Market size and forecast, by region

      • 4.4.3 Market analysis by country

    • 4.5 Marine

      • 4.5.1 Key market trends, growth factors and opportunities

      • 4.5.2 Market size and forecast, by region

      • 4.5.3 Market analysis by country

    • 4.6 Others

      • 4.6.1 Key market trends, growth factors and opportunities

      • 4.6.2 Market size and forecast, by region

      • 4.6.3 Market analysis by country

  • CHAPTER 5: EUROPIC CHLORIDE MARKET, BY REGION

    • 5.1 Overview

      • 5.1.1 Market size and forecast

    • 5.2 North America

      • 5.2.1 Key trends and opportunities

      • 5.2.2 North America Market size and forecast, by End use industry

      • 5.2.3 North America Market size and forecast, by country

        • 5.2.3.1 U.S.
          • 5.2.3.1.1 Market size and forecast, by End use industry
        • 5.2.3.2 Canada
          • 5.2.3.2.1 Market size and forecast, by End use industry
        • 5.2.3.3 Mexico
          • 5.2.3.3.1 Market size and forecast, by End use industry
    • 5.3 Europe

      • 5.3.1 Key trends and opportunities

      • 5.3.2 Europe Market size and forecast, by End use industry

      • 5.3.3 Europe Market size and forecast, by country

        • 5.3.3.1 Germany
          • 5.3.3.1.1 Market size and forecast, by End use industry
        • 5.3.3.2 France
          • 5.3.3.2.1 Market size and forecast, by End use industry
        • 5.3.3.3 U.K.
          • 5.3.3.3.1 Market size and forecast, by End use industry
        • 5.3.3.4 Spain
          • 5.3.3.4.1 Market size and forecast, by End use industry
        • 5.3.3.5 Italy
          • 5.3.3.5.1 Market size and forecast, by End use industry
        • 5.3.3.6 Rest of Europe
          • 5.3.3.6.1 Market size and forecast, by End use industry
    • 5.4 Asia-Pacific

      • 5.4.1 Key trends and opportunities

      • 5.4.2 Asia-Pacific Market size and forecast, by End use industry

      • 5.4.3 Asia-Pacific Market size and forecast, by country

        • 5.4.3.1 China
          • 5.4.3.1.1 Market size and forecast, by End use industry
        • 5.4.3.2 Japan
          • 5.4.3.2.1 Market size and forecast, by End use industry
        • 5.4.3.3 India
          • 5.4.3.3.1 Market size and forecast, by End use industry
        • 5.4.3.4 South Korea
          • 5.4.3.4.1 Market size and forecast, by End use industry
        • 5.4.3.5 Australia
          • 5.4.3.5.1 Market size and forecast, by End use industry
        • 5.4.3.6 Rest Of Asia Pacific
          • 5.4.3.6.1 Market size and forecast, by End use industry
    • 5.5 LAMEA

      • 5.5.1 Key trends and opportunities

      • 5.5.2 LAMEA Market size and forecast, by End use industry

      • 5.5.3 LAMEA Market size and forecast, by country

        • 5.5.3.1 Brazil
          • 5.5.3.1.1 Market size and forecast, by End use industry
        • 5.5.3.2 Saudi Arabia
          • 5.5.3.2.1 Market size and forecast, by End use industry
        • 5.5.3.3 South Africa
          • 5.5.3.3.1 Market size and forecast, by End use industry
        • 5.5.3.4 Rest of LAMEA
          • 5.5.3.4.1 Market size and forecast, by End use industry
  • CHAPTER 6: COMPANY LANDSCAPE

    • 6.1. Introduction

    • 6.2. Top winning strategies

    • 6.3. Product Mapping of Top 10 Player

    • 6.4. Competitive Dashboard

    • 6.5. Competitive Heatmap

    • 6.6. Key developments

  • CHAPTER 7: COMPANY PROFILES

    • 7.1 AK scientific incorporation

      • 7.1.1 Company overview

      • 7.1.2 Company snapshot

      • 7.1.3 Operating business segments

      • 7.1.4 Product portfolio

      • 7.1.5 Business performance

      • 7.1.6 Key strategic moves and developments

    • 7.2 alfa aesar a johnson matthey company

      • 7.2.1 Company overview

      • 7.2.2 Company snapshot

      • 7.2.3 Operating business segments

      • 7.2.4 Product portfolio

      • 7.2.5 Business performance

      • 7.2.6 Key strategic moves and developments

    • 7.3 American Elements

      • 7.3.1 Company overview

      • 7.3.2 Company snapshot

      • 7.3.3 Operating business segments

      • 7.3.4 Product portfolio

      • 7.3.5 Business performance

      • 7.3.6 Key strategic moves and developments

    • 7.4 Glentham Life Science

      • 7.4.1 Company overview

      • 7.4.2 Company snapshot

      • 7.4.3 Operating business segments

      • 7.4.4 Product portfolio

      • 7.4.5 Business performance

      • 7.4.6 Key strategic moves and developments

    • 7.5 matech

      • 7.5.1 Company overview

      • 7.5.2 Company snapshot

      • 7.5.3 Operating business segments

      • 7.5.4 Product portfolio

      • 7.5.5 Business performance

      • 7.5.6 Key strategic moves and developments

    • 7.6 TCI Chemicals

      • 7.6.1 Company overview

      • 7.6.2 Company snapshot

      • 7.6.3 Operating business segments

      • 7.6.4 Product portfolio

      • 7.6.5 Business performance

      • 7.6.6 Key strategic moves and developments

    • 7.7 strem chemicals

      • 7.7.1 Company overview

      • 7.7.2 Company snapshot

      • 7.7.3 Operating business segments

      • 7.7.4 Product portfolio

      • 7.7.5 Business performance

      • 7.7.6 Key strategic moves and developments

    • 7.8 otto chemie

      • 7.8.1 Company overview

      • 7.8.2 Company snapshot

      • 7.8.3 Operating business segments

      • 7.8.4 Product portfolio

      • 7.8.5 Business performance

      • 7.8.6 Key strategic moves and developments

    • 7.9 stanford advance materials

      • 7.9.1 Company overview

      • 7.9.2 Company snapshot

      • 7.9.3 Operating business segments

      • 7.9.4 Product portfolio

      • 7.9.5 Business performance

      • 7.9.6 Key strategic moves and developments

    • 7.10 santa cruz biotechnology

      • 7.10.1 Company overview

      • 7.10.2 Company snapshot

      • 7.10.3 Operating business segments

      • 7.10.4 Product portfolio

      • 7.10.5 Business performance

      • 7.10.6 Key strategic moves and developments

  • LIST OF TABLES

  • TABLE 1. GLOBAL EUROPIC CHLORIDE MARKET, BY END USE INDUSTRY, 2021-2031,($MILLION)
    TABLE 2. EUROPIC CHLORIDE MARKET REVENUE, FOR FOOD AND BEVERAGES, BY REGION , 2021-2031,($MILLION)
    TABLE 3. EUROPIC CHLORIDE MARKET FOR FOOD AND BEVERAGES BY COUNTRY, 2021-2031,($MILLION)
    TABLE 4. EUROPIC CHLORIDE MARKET REVENUE, FOR CHEMICAL, BY REGION , 2021-2031,($MILLION)
    TABLE 5. EUROPIC CHLORIDE MARKET FOR CHEMICAL BY COUNTRY, 2021-2031,($MILLION)
    TABLE 6. EUROPIC CHLORIDE MARKET REVENUE, FOR PETROCHEMICAL, BY REGION , 2021-2031,($MILLION)
    TABLE 7. EUROPIC CHLORIDE MARKET FOR PETROCHEMICAL BY COUNTRY, 2021-2031,($MILLION)
    TABLE 8. EUROPIC CHLORIDE MARKET REVENUE, FOR MARINE, BY REGION , 2021-2031,($MILLION)
    TABLE 9. EUROPIC CHLORIDE MARKET FOR MARINE BY COUNTRY, 2021-2031,($MILLION)
    TABLE 10. EUROPIC CHLORIDE MARKET REVENUE, FOR OTHERS, BY REGION , 2021-2031,($MILLION)
    TABLE 11. EUROPIC CHLORIDE MARKET FOR OTHERS BY COUNTRY, 2021-2031,($MILLION)
    TABLE 12. EUROPIC CHLORIDE MARKET, BY REGION, 2021-2031,($MILLION)
    TABLE 13. NORTH AMERICA EUROPIC CHLORIDE MARKET, BY END USE INDUSTRY, 2021-2031,($MILLION)
    TABLE 14. NORTH AMERICA EUROPIC CHLORIDE MARKET, BY COUNTRY, 2021-2031,($MILLION)
    TABLE 15. U.S. EUROPIC CHLORIDE MARKET, BY END USE INDUSTRY, 2021-2031,($MILLION)
    TABLE 16. CANADA EUROPIC CHLORIDE MARKET, BY END USE INDUSTRY, 2021-2031,($MILLION)
    TABLE 17. MEXICO EUROPIC CHLORIDE MARKET, BY END USE INDUSTRY, 2021-2031,($MILLION)
    TABLE 18. EUROPE EUROPIC CHLORIDE MARKET, BY END USE INDUSTRY, 2021-2031,($MILLION)
    TABLE 19. EUROPE EUROPIC CHLORIDE MARKET, BY COUNTRY, 2021-2031,($MILLION)
    TABLE 20. GERMANY EUROPIC CHLORIDE MARKET, BY END USE INDUSTRY, 2021-2031,($MILLION)
    TABLE 21. FRANCE EUROPIC CHLORIDE MARKET, BY END USE INDUSTRY, 2021-2031,($MILLION)
    TABLE 22. U.K. EUROPIC CHLORIDE MARKET, BY END USE INDUSTRY, 2021-2031,($MILLION)
    TABLE 23. SPAIN EUROPIC CHLORIDE MARKET, BY END USE INDUSTRY, 2021-2031,($MILLION)
    TABLE 24. ITALY EUROPIC CHLORIDE MARKET, BY END USE INDUSTRY, 2021-2031,($MILLION)
    TABLE 25. REST OF EUROPE EUROPIC CHLORIDE MARKET, BY END USE INDUSTRY, 2021-2031,($MILLION)
    TABLE 26. ASIA-PACIFIC EUROPIC CHLORIDE MARKET, BY END USE INDUSTRY, 2021-2031,($MILLION)
    TABLE 27. ASIA-PACIFIC EUROPIC CHLORIDE MARKET, BY COUNTRY, 2021-2031,($MILLION)
    TABLE 28. CHINA EUROPIC CHLORIDE MARKET, BY END USE INDUSTRY, 2021-2031,($MILLION)
    TABLE 29. JAPAN EUROPIC CHLORIDE MARKET, BY END USE INDUSTRY, 2021-2031,($MILLION)
    TABLE 30. INDIA EUROPIC CHLORIDE MARKET, BY END USE INDUSTRY, 2021-2031,($MILLION)
    TABLE 31. SOUTH KOREA EUROPIC CHLORIDE MARKET, BY END USE INDUSTRY, 2021-2031,($MILLION)
    TABLE 32. AUSTRALIA EUROPIC CHLORIDE MARKET, BY END USE INDUSTRY, 2021-2031,($MILLION)
    TABLE 33. REST OF ASIA PACIFIC EUROPIC CHLORIDE MARKET, BY END USE INDUSTRY, 2021-2031,($MILLION)
    TABLE 34. LAMEA EUROPIC CHLORIDE MARKET, BY END USE INDUSTRY, 2021-2031,($MILLION)
    TABLE 35. LAMEA EUROPIC CHLORIDE MARKET, BY COUNTRY, 2021-2031,($MILLION)
    TABLE 36. BRAZIL EUROPIC CHLORIDE MARKET, BY END USE INDUSTRY, 2021-2031,($MILLION)
    TABLE 37. SAUDI ARABIA EUROPIC CHLORIDE MARKET, BY END USE INDUSTRY, 2021-2031,($MILLION)
    TABLE 38. SOUTH AFRICA EUROPIC CHLORIDE MARKET, BY END USE INDUSTRY, 2021-2031,($MILLION)
    TABLE 39. REST OF LAMEA EUROPIC CHLORIDE MARKET, BY END USE INDUSTRY, 2021-2031,($MILLION)
    TABLE 40.AK SCIENTIFIC INCORPORATION: COMPANY SNAPSHOT
    TABLE 41.AK SCIENTIFIC INCORPORATION: OPERATING SEGMENTS
    TABLE 42.AK SCIENTIFIC INCORPORATION: PRODUCT PORTFOLIO
    TABLE 43.AK SCIENTIFIC INCORPORATION: NET SALES,
    TABLE 44.AK SCIENTIFIC INCORPORATION: KEY STRATERGIES
    TABLE 45.ALFA AESAR A JOHNSON MATTHEY COMPANY: COMPANY SNAPSHOT
    TABLE 46.ALFA AESAR A JOHNSON MATTHEY COMPANY: OPERATING SEGMENTS
    TABLE 47.ALFA AESAR A JOHNSON MATTHEY COMPANY: PRODUCT PORTFOLIO
    TABLE 48.ALFA AESAR A JOHNSON MATTHEY COMPANY: NET SALES,
    TABLE 49.ALFA AESAR A JOHNSON MATTHEY COMPANY: KEY STRATERGIES
    TABLE 50.AMERICAN ELEMENTS: COMPANY SNAPSHOT
    TABLE 51.AMERICAN ELEMENTS: OPERATING SEGMENTS
    TABLE 52.AMERICAN ELEMENTS: PRODUCT PORTFOLIO
    TABLE 53.AMERICAN ELEMENTS: NET SALES,
    TABLE 54.AMERICAN ELEMENTS: KEY STRATERGIES
    TABLE 55.GLENTHAM LIFE SCIENCE: COMPANY SNAPSHOT
    TABLE 56.GLENTHAM LIFE SCIENCE: OPERATING SEGMENTS
    TABLE 57.GLENTHAM LIFE SCIENCE: PRODUCT PORTFOLIO
    TABLE 58.GLENTHAM LIFE SCIENCE: NET SALES,
    TABLE 59.GLENTHAM LIFE SCIENCE: KEY STRATERGIES
    TABLE 60.MATECH: COMPANY SNAPSHOT
    TABLE 61.MATECH: OPERATING SEGMENTS
    TABLE 62.MATECH: PRODUCT PORTFOLIO
    TABLE 63.MATECH: NET SALES,
    TABLE 64.MATECH: KEY STRATERGIES
    TABLE 65.TCI CHEMICALS: COMPANY SNAPSHOT
    TABLE 66.TCI CHEMICALS: OPERATING SEGMENTS
    TABLE 67.TCI CHEMICALS: PRODUCT PORTFOLIO
    TABLE 68.TCI CHEMICALS: NET SALES,
    TABLE 69.TCI CHEMICALS: KEY STRATERGIES
    TABLE 70.STREM CHEMICALS: COMPANY SNAPSHOT
    TABLE 71.STREM CHEMICALS: OPERATING SEGMENTS
    TABLE 72.STREM CHEMICALS: PRODUCT PORTFOLIO
    TABLE 73.STREM CHEMICALS: NET SALES,
    TABLE 74.STREM CHEMICALS: KEY STRATERGIES
    TABLE 75.OTTO CHEMIE: COMPANY SNAPSHOT
    TABLE 76.OTTO CHEMIE: OPERATING SEGMENTS
    TABLE 77.OTTO CHEMIE: PRODUCT PORTFOLIO
    TABLE 78.OTTO CHEMIE: NET SALES,
    TABLE 79.OTTO CHEMIE: KEY STRATERGIES
    TABLE 80.STANFORD ADVANCE MATERIALS: COMPANY SNAPSHOT
    TABLE 81.STANFORD ADVANCE MATERIALS: OPERATING SEGMENTS
    TABLE 82.STANFORD ADVANCE MATERIALS: PRODUCT PORTFOLIO
    TABLE 83.STANFORD ADVANCE MATERIALS: NET SALES,
    TABLE 84.STANFORD ADVANCE MATERIALS: KEY STRATERGIES
    TABLE 85.SANTA CRUZ BIOTECHNOLOGY: COMPANY SNAPSHOT
    TABLE 86.SANTA CRUZ BIOTECHNOLOGY: OPERATING SEGMENTS
    TABLE 87.SANTA CRUZ BIOTECHNOLOGY: PRODUCT PORTFOLIO
    TABLE 88.SANTA CRUZ BIOTECHNOLOGY: NET SALES,
    TABLE 89.SANTA CRUZ BIOTECHNOLOGY: KEY STRATERGIES
  • LIST OF FIGURES

  • FIGURE 1.EUROPIC CHLORIDE MARKET SEGMENTATION
    FIGURE 2.EUROPIC CHLORIDE MARKET,2021-2031
    FIGURE 3.EUROPIC CHLORIDE MARKET,2021-2031
    FIGURE 4. TOP INVESTMENT POCKETS, BY REGION
    FIGURE 5.PORTER FIVE-1
    FIGURE 6.PORTER FIVE-2
    FIGURE 7.PORTER FIVE-3
    FIGURE 8.PORTER FIVE-4
    FIGURE 9.PORTER FIVE-5
    FIGURE 10.TOP PLAYER POSITIONING
    FIGURE 11.EUROPIC CHLORIDE MARKET:DRIVERS, RESTRAINTS AND OPPORTUNITIES
    FIGURE 12.VALUE CHAIN ANALYSIS
    FIGURE 13.PATENT ANALYSIS BY COMPANY
    FIGURE 14.PATENT ANALYSIS BY COUNTRY
    FIGURE 15.EUROPIC CHLORIDE MARKET,BY END USE INDUSTRY,2021(%)
    FIGURE 16.COMPARATIVE SHARE ANALYSIS OF FOOD AND BEVERAGES EUROPIC CHLORIDE MARKET,2021-2031(%)
    FIGURE 17.COMPARATIVE SHARE ANALYSIS OF CHEMICAL EUROPIC CHLORIDE MARKET,2021-2031(%)
    FIGURE 18.COMPARATIVE SHARE ANALYSIS OF PETROCHEMICAL EUROPIC CHLORIDE MARKET,2021-2031(%)
    FIGURE 19.COMPARATIVE SHARE ANALYSIS OF MARINE EUROPIC CHLORIDE MARKET,2021-2031(%)
    FIGURE 20.COMPARATIVE SHARE ANALYSIS OF OTHERS EUROPIC CHLORIDE MARKET,2021-2031(%)
    FIGURE 21.EUROPIC CHLORIDE MARKET BY REGION,2021
    FIGURE 22.U.S. EUROPIC CHLORIDE MARKET,2021-2031($MILLION)
    FIGURE 23.CANADA EUROPIC CHLORIDE MARKET,2021-2031($MILLION)
    FIGURE 24.MEXICO EUROPIC CHLORIDE MARKET,2021-2031($MILLION)
    FIGURE 25.GERMANY EUROPIC CHLORIDE MARKET,2021-2031($MILLION)
    FIGURE 26.FRANCE EUROPIC CHLORIDE MARKET,2021-2031($MILLION)
    FIGURE 27.U.K. EUROPIC CHLORIDE MARKET,2021-2031($MILLION)
    FIGURE 28.SPAIN EUROPIC CHLORIDE MARKET,2021-2031($MILLION)
    FIGURE 29.ITALY EUROPIC CHLORIDE MARKET,2021-2031($MILLION)
    FIGURE 30.REST OF EUROPE EUROPIC CHLORIDE MARKET,2021-2031($MILLION)
    FIGURE 31.CHINA EUROPIC CHLORIDE MARKET,2021-2031($MILLION)
    FIGURE 32.JAPAN EUROPIC CHLORIDE MARKET,2021-2031($MILLION)
    FIGURE 33.INDIA EUROPIC CHLORIDE MARKET,2021-2031($MILLION)
    FIGURE 34.SOUTH KOREA EUROPIC CHLORIDE MARKET,2021-2031($MILLION)
    FIGURE 35.AUSTRALIA EUROPIC CHLORIDE MARKET,2021-2031($MILLION)
    FIGURE 36.REST OF ASIA PACIFIC EUROPIC CHLORIDE MARKET,2021-2031($MILLION)
    FIGURE 37.BRAZIL EUROPIC CHLORIDE MARKET,2021-2031($MILLION)
    FIGURE 38.SAUDI ARABIA EUROPIC CHLORIDE MARKET,2021-2031($MILLION)
    FIGURE 39.SOUTH AFRICA EUROPIC CHLORIDE MARKET,2021-2031($MILLION)
    FIGURE 40.REST OF LAMEA EUROPIC CHLORIDE MARKET,2021-2031($MILLION)
    FIGURE 41. TOP WINNING STRATEGIES, BY YEAR
    FIGURE 42. TOP WINNING STRATEGIES, BY DEVELOPMENT
    FIGURE 43. TOP WINNING STRATEGIES, BY COMPANY
    FIGURE 44.PRODUCT MAPPING OF TOP 10 PLAYERS
    FIGURE 45.COMPETITIVE DASHBOARD
    FIGURE 46.COMPETITIVE HEATMAP OF TOP 10 KEY PLAYERS
    FIGURE 47.AK SCIENTIFIC INCORPORATION.: NET SALES ,($MILLION)
    FIGURE 48.ALFA AESAR A JOHNSON MATTHEY COMPANY.: NET SALES ,($MILLION)
    FIGURE 49.AMERICAN ELEMENTS.: NET SALES ,($MILLION)
    FIGURE 50.GLENTHAM LIFE SCIENCE.: NET SALES ,($MILLION)
    FIGURE 51.MATECH.: NET SALES ,($MILLION)
    FIGURE 52.TCI CHEMICALS.: NET SALES ,($MILLION)
    FIGURE 53.STREM CHEMICALS.: NET SALES ,($MILLION)
    FIGURE 54.OTTO CHEMIE.: NET SALES ,($MILLION)
    FIGURE 55.STANFORD ADVANCE MATERIALS.: NET SALES ,($MILLION)
    FIGURE 56.SANTA CRUZ BIOTECHNOLOGY.: NET SALES ,($MILLION)


According to the perspective of the CXOs of leading companies, the market for europic chloride is expected to exhibit high growth potential in the near future due to rapid expansion of the chemical and petrochemical sectors. North America and Europe are seen as mature markets for the chemical and petrochemical sectors, despite the fact that Asia-Pacific has become a valuable region for investors due to their strong revenue growth rates. The primary growth drivers of the europic chloride market are technological advancement in the field of earth metal nano-crystals, increase in demand for flat panel displays and LEDs, and the expanding civil infrastructure. The rapidly expanding consumer electronics business around the globe, as a result of improved internet access, technical breakthroughs, and rising consumer spending on luxury gadgets, is projected to have a substantial effect on the expansion of the market.

PURCHASE OPTIONS

Call or Email us

U.S.-Canada Toll-free: +1-800-792-5285
Int'l : +1-503-894-6022
Europe : +44-845-528-1300
Email : help@alliedmarketresearch.com
 
FREQUENTLY ASKED QUESTIONS?

A. The global europic chloride market was valued at $ 136.6 million in 2021, and is projected to reach $ 254.7 million by 2031, growing at a CAGR of 6.5% from 2022 to 2031.

A. The global europic chloride market was valued at $ 136.6 million in 2021, and is projected to reach $ 254.7 million by 2031, growing at a CAGR of 6.5% from 2022 to 2031.

A. Asia-Pacific contributed the 46.4% market share in 2021, and is projected to grow at CAGR of 7.1% during the forecast period. This is attributed to surge in demand from chemical and petrochemical industries in Asia-Pacific.

A. AK Scientific, Inc., Alfa Aesar Thermo Fisher Scientific, American Elements, Glentham Life Sciences Limited, MaTecK GmbH, Otto Chemie Pvt., Ltd., Santa Cruz Biotechnology, Inc., Stanford Advanced Materials, Strem Chemicals Inc., TCI Chemicals (India) Pvt., Ltd.

A. Increased demand from chemical industry is the main drivers for europic chloride market.

A. COVID-19 has mix impact on europic chloride market. Europic chloride saw decreased in demand from chemical industry and increased demand from food and beverage industry.

A. Chemical is is the leading application of europic Chloride Market.

A. Food and beverage industry is projected to increase the demand for europic chloride during the forecasted period.

Looking for Customization?

 Customization Request

Have a Question?

 Speak with Analyst

Any Confusion?

 Inquire Before Buying

Have a glance of the Report

  Request Sample
RELATED TAGS

Purchase Full Report of
Europic Chloride Market

Start reading instantly.
This Report and over 66,804+ more Reports, Available with Avenue Library. T&C*.

  • Online Only
  • $3,456
  • Online cloud access only
  • Restricted print, copy, paste & download
  • Read only
  • Free industry update
    (Within 180 days)
  • Free report update in next update cycle
    (Jun 2023 - Jun 2024)
  • Data Pack
  • $3,840
  • Restricted to one authorized user
  • One print only
  • Available in
    Excel
  • Free industry update
    (Within 180 days)
  •   Free report update in next update cycle
    (Jun 2023 - Jun 2024)
  • Single User
  • $5,769
  • Restricted to one authorized user
  • One print only
  • Available in
    PDF
  • Free industry update
    (Within 180 days)
  •   Free report update in next update cycle
    (Jun 2023 - Jun 2024)
  • Five Users
  • $6,450
  • Limited to five authorized users
  • Print upto five copies
  • Available in
    PDF
  • Free industry update
    (Within 180 days)
  •   Free report update in next update cycle
    (Jun 2023 - Jun 2024)
  • Enterprise
    License/PDF

  • $10,995
  • Unlimited
    within
    company/enterprise
  • Available in Excel & PDF
  • Free industry update
    (Within 180 days)
  •   Free report update in next update cycle
    (Jun 2023 - Jun 2024)
  • Library
    Membership

  • $999 $ 1,175
    Per User/ Per month/ Billed annually
  • Published Content
    E-access
  • Company Profiles
    E-access
  • Newly Added Content Access
  • 10 PDF
    Downloads
  • 5 Excel Data
    Pack Downloads
  • 250 Company Profiles PDF Downloads
  • Buy Now

*Taxes/Fees, if applicable will be added during checkout. All prices in USD

RELATED REPORTS
 

Why Allied Market Research?


Infallible Methodology

To ensure high-level data integrity, accurate analysis, and impeccable forecasts

Analyst Support

For complete satisfaction

Customization

On-demand customization of scope of the report to exactly meet your needs

TARGETED MARKET VIEW

Targeted market view to provide pertinent information and save time of readers

Get fresh content delivered

Get insights on topics that are crucial for your business. Stay abreast of your interest areas.

Get Industry Data Alerts

Why Allied Market Research?

Infallible Methodology

To ensure high-level data integrity, accurate analysis, and impeccable forecasts

Analyst Support

For complete satisfaction

Customization

On-demand customization of scope of the report to exactly meet your needs

TARGETED MARKET VIEW

Targeted market view to provide pertinent information and save time of readers