0
2018
Exterior Doors Market

Exterior Doors Market

by Door Type (Panel doors, Bypass doors, Bifold doors, Pocket doors, and others), Material (Wood, Metal, Glass, Vinyl, Fiberglass, Fiberboard, and Others), Mechanism (Swinging, Sliding, Folding, Revolving and Others), and End User (Residential and Nonresidential) - Opportunity Analysis and Industry Forecast, 2017-2023

Report Code: A04179
Jan 2018 | Pages: 132
Tables: 115
Charts: 82
  • Formats*:

  • pdf

    Single User License, Five User
    License & Enterprise User License

  • xls

    Data Pack Excel License

  • ppt

    It comes with the additional cost
    of $2500.00 contact sales.


COVID-19

Pandemic disrupted the entire world and affected many industries.

Get detailed COVID-19 impact analysis on the Exterior Doors Market

Request Now !

Exterior Doors Market Overview:

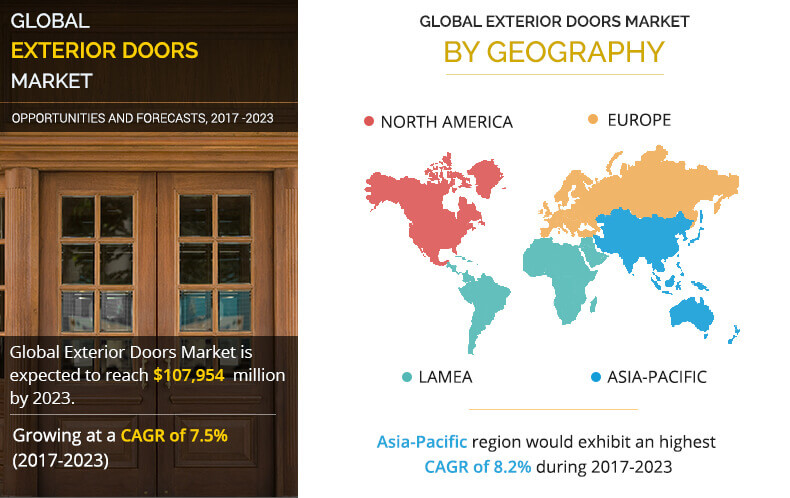
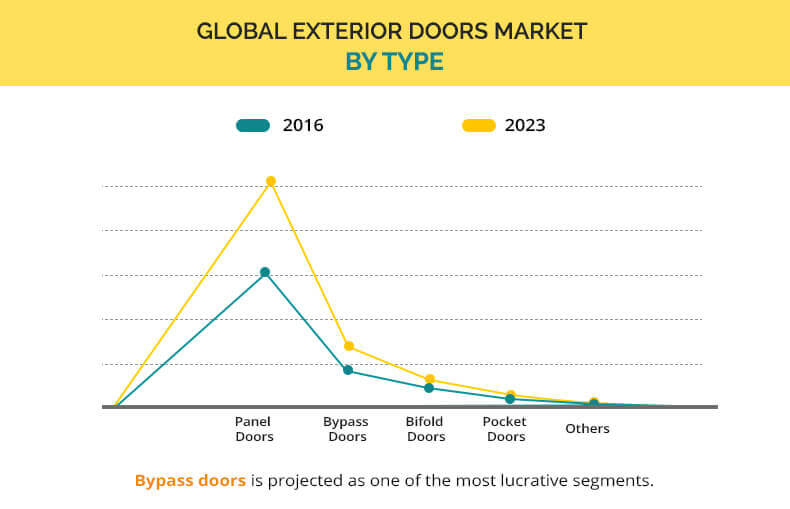
Exterior Doors Market was valued at $65,327 million in 2016 and is expected to reach $107,954 million in 2023, growing at a CAGR of 7.5% from 2017 to 2023. Exterior doors include panel doors, bypass doors, bifold doors, pocket doors, and others. These doors are generally fitted on the front gate of the entrance of houses and other nonresidential areas, thereby, enhancing the overall appearance. Exterior doors are also known as entry doors and provide various features such as energy efficiency, cost reduction, and high durability. Customers can easily choose doors according to their choices, preferences, and individual personalities owing to the availability of a wide range, style, and designs of exterior doors.

Exterior Doors Market by geography

Exterior doors, besides enhancing the aesthetic appeal of a building, also serve as ideal solutions for energy efficiency and convenience depending on the mechanism used. Various types of mechanisms available in exterior doors include swinging, sliding, folding, and revolving & others. Swinging exterior doors have a wide application among consumers in the commercial and residential sectors owing to its convenience in usage.

Segment Overview

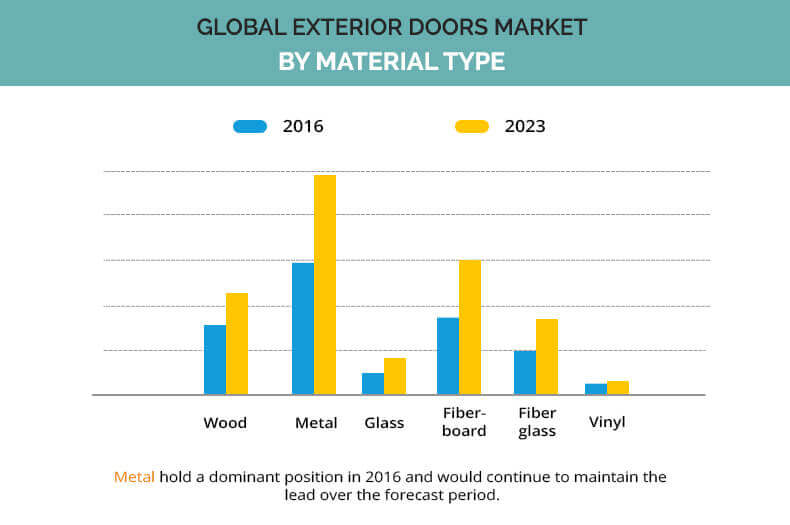
The global exterior doors market is segmented based on material type into wood, metal, glass, fiberboard, fiberglass, and vinyl. In 2016, the metal segment accounted for maximum share of the total exterior doors market revenue owing to the high dimensional stability and durability & resistance to fire and chemicals, often preferred in the commercial sector. Leading players profiled in the report include ASSA ABLOY AB, JELD-WEN Holding, Inc., Marvin Doors & Windows Inc., Pella Corporation, Masonite, VKR, Atrium Corporation, Bayer Built Inc., ETO Doors, JS Doors Manufacturer PTE Ltd..

Exterior Doors Market by type

Market Segmentation

Residential construction dominates the market; however, nonresidential construction is expected to grow at relatively higher rate globally. The maximum demand for exterior doors market is generated from panel doors. Panel doors are gaining traction among the end user due to their ability to accentuate the aesthetic appeal of building entrances.

Exterior Doors Market by material type

Top Investment Pockets for Doors

Currently, doors are witnessing increased penetration among both residential and nonresidential users. Wood and metal have witnessed considerable demand, owing to their various features such as easy availability in the market, durability, and strong aesthetics properties.

Key Benefits for Stakeholders

  • The study provides an in-depth analysis of the exterior doors market and current & future trends to elucidate the imminent investment pockets.
  • Information about key drivers, restrains, and opportunities and their impact analysis on the market is provided.
  • Porters Five Forces analysis illustrates the potency of buyers & suppliers operating in the industry.
  • The quantitative analysis of the exterior doors market is from 2017 to 2023 is provided to determine the market potential.

Exterior Doors Market Key Segments:

By Type

  • Panel Doors
  • Bypass Doors
  • Bifold Doors
  • Pocket
  • Others

By Material Type

  • Wood
  • Metal
  • Glass
  • Fiberglass
  • Fiberboard
  • Vinyl
  • Others

By Mechanism

  • Swinging
  • Sliding
  • Bypass
  • Folding
  • Revolving & Others

By End User

  • Residential
  • Non-residential

Key Market Players

  • ASSA ABLOY AB
  • JELD-WEN Holding, Inc.
  • Marvin Doors & Windows Inc.
  • Pella Corporation
  • Masonite
  • VKR
  • Atrium Corporation
  • Bayer Built Inc.
  • ETO Doors
  • JS Doors Manufacturer PTE Ltd..

Exterior Doors Market Report Highlights

Aspects Details
By DOOR TYPE
  • PANEL DOORS
  • BYPASS DOORS
  • BIFOLD DOORS
  • POCKET DOORS
  • OTHERS
By MATERIAL
  • WOOD
  • METAL
  • GLASS
  • FIBERBOARD
  • FIBERGLASS
  • VINYL
By MECHANISM
  • SWINGING
  • SLIDING
  • FOLDING
  • REVOLVING & OTHERS
By END USER
  • RESIDENTIAL
  • NONRESIDENTIAL
By GEOGRAPHY
  • North America
    • U.S.
    • Canada
    • Mexico
  • Europe
    • France
    • Germany
    • Italy
    • Spain
    • UK
    • Russia
    • Rest of Europe
  • Asia-Pacific
    • China
    • Japan
    • India
    • South Korea
    • Australia
    • Thailand
    • Malaysia
    • Indonesia
    • Rest of Asia-Pacific
  • LAMEA
    • Brazil
    • South Africa
    • Saudi Arabia
    • UAE
    • Argentina
    • Rest of LAMEA
Key Market Players PELLA CORPORATION, BAYER BUILT INC., JELD-WEN HOLDING, INC. (JELD-WEN, INC.), MARVIN WINDOWS AND DOORS, INC., ETO DOORS, VKR HOLDING A/S, MASONITE INTERNATIONAL CORPORATION, JS DOORS MANUFACTURER PTE LTD., ATRIUM CORPORATION, ASSA ABLOY AB
 

CHAPTER 1 INTRODUCTION

1.1. REPORT DESCRIPTION
1.2. KEY BENEFITS
1.3. KEY MARKET SEGMENTS
1.4. RESEARCH METHODOLOGY

1.4.1. Secondary research
1.4.2. Primary research
1.4.3. Analyst tools and models

CHAPTER 2 EXECUTIVE SUMMARY

2.1. KEY FINDINGS OF THE STUDY
2.2. CXO PERSPECTIVE

CHAPTER 3 MARKET OVERVIEW

3.1. MARKET DEFINITION AND SCOPE
3.2. KEY FINDINGS

3.2.1. Top impacting factors
3.2.2. Top investment pocket for exterior doors
3.2.3. Top winning strategies

3.3. PORTER’S FIVE FORCES ANALYSIS

3.3.1. Low bargaining power of suppliers
3.3.2. High bargaining power of buyers
3.3.3. Low threat of substitution
3.3.4. Moderate threat of new entrants
3.3.5. High competitive rivalry

3.4. MARKET PLAYER POSITIONING, 2016
3.5. MERGERS & ACQUISITIONS
3.6. MARKET DYNAMICS

3.6.1. Drivers

3.6.1.1. Advancements by market players
3.6.1.2. Surge in residential & nonresidential construction
3.6.1.3. Increase in spending on home remodeling

3.6.2. Restraint

3.6.2.1. High price packages of some ecofriendly products

3.6.3. Opportunities

3.6.3.1. Rapid urbanization & industrialization
3.6.3.2. Rise in disposable income in emerging economies

CHAPTER 4 EXTERIOR DOORS MARKET, BY DOOR TYPE

4.1. OVERVIEW

4.1.1. Market size and forecast
4.1.2. Market volume and forecast

4.2. PANEL DOORS

4.2.1. Key growth factors and opportunities
4.2.2. Market size and forecast
4.2.3. Market volume and forecast

4.3. BYPASS DOORS

4.3.1. Key growth factors and opportunities
4.3.2. Market size and forecast
4.3.3. Market volume and forecast

4.4. BIFOLD DOORS

4.4.1. Key growth factors and opportunities
4.4.2. Market size and forecast
4.4.3. Market volume and forecast

4.5. POCKET DOORS

4.5.1. Key growth factors and opportunities
4.5.2. Market size and forecast
4.5.3. Market volume and forecast

4.6. OTHERS

4.6.1. Key growth factors and opportunities
4.6.2. Market size and forecast
4.6.3. Market volume and forecast

CHAPTER 5 EXTERIOR DOORS MARKET, BY MATERIAL

5.1. OVERVIEW

5.1.1. Market size and forecast
5.1.2. Market size and volume

5.2. WOOD

5.2.1. Key growth factors and opportunities
5.2.2. Market size and forecast
5.2.3. Market volume and forecast

5.3. METAL

5.3.1. Key growth factors and opportunities
5.3.2. Market size and forecast
5.3.3. Market volume and forecast

5.4. GLASS

5.4.1. Key growth factors and opportunities
5.4.2. Market size and forecast
5.4.3. Market volume and forecast

5.5. FIBERBOARD

5.5.1. Key growth factors and opportunities
5.5.2. Market size and forecast
5.5.3. Market volume and forecast

5.6. FIBERGLASS

5.6.1. Key growth factors and opportunities
5.6.2. Market size and forecast
5.6.3. Market volume and forecast

5.7. VINYL

5.7.1. Key growth factors and opportunities
5.7.2. Market size and forecast
5.7.3. Market volume and forecast

CHAPTER 6 EXTERIOR DOORS MARKET, BY MECHANISM

6.1. OVERVIEW

6.1.1. Market size and forecast
6.1.2. Market volume and forecast

6.2. SWINGING

6.2.1. Key growth factors and opportunities
6.2.2. Market size and forecast
6.2.3. Market volume and forecast

6.3. SLIDING

6.3.1. Key growth factors and opportunities
6.3.2. Market size and forecast
6.3.3. Market volume and forecast

6.4. FOLDING

6.4.1. Key growth factors and opportunities
6.4.2. Market size and forecast
6.4.3. Market volume and forecast

6.5. REVOLVING & OTHERS

6.5.1. Key growth factors and opportunities
6.5.2. Market size and forecast
6.5.3. Market volume and forecast

CHAPTER 7 EXTERIOR DOORS MARKET, BY END USER

7.1. OVERVIEW

7.1.1. Market size and forecast
7.1.2. Market volume and forecast

7.2. RESIDENTIAL

7.2.1. Key growth factors and opportunities
7.2.2. Market size and forecast
7.2.3. Market volume and forecast

7.3. NONRESIDENTIAL

7.3.1. Key growth factors and opportunities
7.3.2. Market size and forecast
7.3.3. Market volume and forecast

CHAPTER 8 EXTERIOR DOORS MARKET, BY GEOGRAPHY

8.1. OVERVIEW

8.1.1. Market size and forecast
8.1.2. Market volume and forecast

8.2. NORTH AMERICA

8.2.1. Key growth factors and opportunities
8.2.2. Market size and forecast
8.2.3. Market volume and forecast

8.2.3.1. U.S.
8.2.3.2. Canada
8.2.3.3. Mexico

8.3. EUROPE

8.3.1. Key growth factors and opportunities
8.3.2. Market size and forecast
8.3.3. Market volume and forecast

8.3.3.1. Germany
8.3.3.2. France
8.3.3.3. UK
8.3.3.4. Italy
8.3.3.5. Rest of Europe

8.4. ASIA-PACIFIC

8.4.1. Key growth factors and opportunities
8.4.2. Market size and forecast
8.4.3. Market volume and forecast

8.4.3.1. China
8.4.3.2. India
8.4.3.3. Japan
8.4.3.4. Rest of Asia-Pacific

8.5. LAMEA

8.5.1. Key growth factors and opportunities
8.5.2. Market size and forecast
8.5.3. Market volume and forecast

8.5.3.1. Latin America
8.5.3.2. Middle East
8.5.3.3. Africa

CHAPTER 9 COMPANY PROFILES

9.1. ASSA ABLOY AB

9.1.1. Company overview
9.1.2. Company snapshot
9.1.3. Operating business segments
9.1.4. Product portfolio
9.1.5. Business performance

9.1.5.1. Sales Breakdown

9.1.6. Key strategic moves

9.1.6.1. Distribution & Sales Strategy
9.1.6.2. M&A Strategy
9.1.6.3. Innovation Strategy

9.1.7. Key developments

9.2. ATRIUM CORPORATION

9.2.1. Company overview
9.2.2. Company snapshot
9.2.3. Operating business segments
9.2.4. Product portfolio
9.2.5. Sales breakdown
9.2.6. Distribution & Sales Strategy

9.3. BAYER BUILT INC.

9.3.1. Company overview
9.3.2. Company snapshot
9.3.3. Operating business segments
9.3.4. Product portfolio
9.3.5. Sales Breakdown

9.3.5.1. Distribution & Sales Strategy
9.3.5.2. Innovation Strategy

9.4. ETO DOORS

9.4.1. Company overview
9.4.2. Company snapshot
9.4.3. Operating business segments
9.4.4. Product portfolio
9.4.5. Sales Breakdown
9.4.6. Distribution & Sales Strategy

9.5. JELD-WEN HOLDING, INC. (JELD-WEN, INC.)

9.5.1. Company overview
9.5.2. Company snapshot
9.5.3. Operating business segments
9.5.4. Sales Breakdown
9.5.5. Product portfolio
9.5.6. Key strategic moves

9.5.6.1. Distribution & Sales Strategy
9.5.6.2. M&A Strategy
9.5.6.3. Key developments
9.5.6.4. Innovation Strategy

9.6. JS DOORS MANUFACTURER PTE LTD.

9.6.1. Company overview
9.6.2. Company snapshot
9.6.3. Operating business segments
9.6.4. Product portfolio
9.6.5. Sales Breakdown

9.7. MARVIN WINDOWS AND DOORS, INC.

9.7.1. Company overview
9.7.2. Company snapshot
9.7.3. Operating business segments
9.7.4. Product portfolio
9.7.5. Sales Breakdown
9.7.6. Key strategic moves
9.7.7. Distribution & Sales Strategy
9.7.8. Innovation Strategy

9.8. MASONITE INTERNATIONAL CORPORATION

9.8.1. Company overview
9.8.2. Company snapshot
9.8.3. Operating business segments
9.8.4. Product portfolio
9.8.5. Business performance
9.8.6. Sales Breakdown
9.8.7. Key strategic moves

9.8.7.1. Distribution & Sales Strategy
9.8.7.2. M&A Strategy
9.8.7.3. Innovation Strategy

9.9. VKR HOLDING A/S

9.9.1. Company overview
9.9.2. Company snapshot
9.9.3. Operating business segments
9.9.4. Product portfolio
9.9.5. Business performance
9.9.6. Sales Breakdown
9.9.7. Key strategic moves

9.9.7.1. Distribution & Sales Strategy
9.9.7.2. Innovation Strategy

9.10. PELLA CORPORATION

9.10.1. Company overview
9.10.2. Company snapshot
9.10.3. Operating business segments
9.10.4. Product portfolio
9.10.5. Sales Breakdown
9.10.6. Key strategic moves

9.10.6.1. Distribution & Sales Strategy
9.10.6.2. M&A Strategy
9.10.6.3. Innovation Strategy

LIST OF TABLES

TABLE 1. MERGERS & ACQUISTIONS
TABLE 2. GLOBAL EXTERIOR DOORS MARKET, BY DOOR TYPE, 2014-2023 ($MILLION)
TABLE 3. GLOBAL EXTERIOR DOORS MARKET, BY DOOR TYPE, 2014-2023 (‘000 UNITS)
TABLE 4. PANEL EXTERIOR DOORS MARKET, BY GEOGRAPHY, 2014-2023 ($MILLION)
TABLE 5. PANEL EXTERIOR DOORS MARKET, BY GEOGRAPHY, 2014-2023 (‘000 UNITS)
TABLE 6. BYPASS EXTERIOR DOORS MARKET, BY GEOGRAPHY, 2014-2023 ($MILLION)
TABLE 7. BYPASS EXTERIOR DOORS MARKET, BY GEOGRAPHY, 2014-2023 (‘000 UNITS)
TABLE 8. BIFOLD EXTERIOR DOORS MARKET, BY GEOGRAPHY, 2014-2023 ($MILLION)
TABLE 9. BIFOLD EXTERIOR DOORS MARKET, BY GEOGRAPHY, 2014-2023 (‘000 UNITS)
TABLE 10. POCKET EXTERIOR DOORS MARKET, BY GEOGRAPHY, 2014-2023 ($MILLION)
TABLE 11. POCKET EXTERIOR DOORS MARKET, BY GEOGRAPHY, 2014-2023 (‘000 UNITS)
TABLE 12. OTHER EXTERIOR DOORS MARKET, BY GEOGRAPHY, 2014-2023 ($MILLION)
TABLE 13. OTHER EXTERIOR DOORS MARKET, BY GEOGRAPHY, 2014-2023 (‘000 UNITS)
TABLE 14. GLOBAL EXTERIOR DOORS MARKET, BY MATERIAL, 2014-2023 ($MILLION)
TABLE 15. GLOBAL EXTERIOR DOORS MARKET, BY MATERIAL, 2014-2023 (‘000 UNITS)
TABLE 16. WOODEN EXTERIOR DOORS MARKET, BY GEOGRAPHY, 2014-2023 ($MILLION)
TABLE 17. WOODEN EXTERIOR DOORS MARKET, BY GEOGRAPHY, 2014-2023 (‘000 UNITS)
TABLE 18. METALLIC EXTERIOR DOORS MARKET, BY GEOGRAPHY, 2014-2023 ($MILLION)
TABLE 19. METALLIC EXTERIOR DOORS MARKET, BY GEOGRAPHY, 2014-2023 (‘000 UNITS)
TABLE 20. GLASS EXTERIOR DOORS MARKET, BY GEOGRAPHY, 2014-2023 ($MILLION)
TABLE 21. GLASS EXTERIOR DOORS MARKET, BY GEOGRAPHY, 2014-2023 (‘000 UNITS)
TABLE 22. FIBERBOARD EXTERIOR DOORS MARKET, BY GEOGRAPHY, 2014-2023 ($MILLION)
TABLE 23. FIBERBOARD EXTERIOR DOORS MARKET, BY GEOGRAPHY, 2014-2023 (‘000 UNITS)
TABLE 24. FIBERGLASS EXTERIOR DOORS MARKET, BY GEOGRAPHY, 2014-2023 ($MILLION)
TABLE 25. FIBERGLASS EXTERIOR DOORS MARKET, BY GEOGRAPHY, 2014-2023 (‘000 UNITS)
TABLE 26. VINYL EXTERIOR DOORS MARKET, BY GEOGRAPHY, 2014-2023 ($MILLION)
TABLE 27. VINYL EXTERIOR DOORS MARKET, BY GEOGRAPHY, 2014-2023 (‘000 UNITS)
TABLE 28. GLOBAL EXTERIOR DOORS MARKET, BY MECHANISM, 2014-2023 ($MILLION)
TABLE 29. GLOBAL EXTERIOR DOORS MARKET, BY MECHANISM, 2014-2023 (‘000 UNITS)
TABLE 30. SWINGING EXTERIOR DOORS MARKET, BY GEOGRAPHY, 2014-2023 ($MILLION)
TABLE 31. SWINGING EXTERIOR DOORS MARKET, BY GEOGRAPHY, 2014-2023 (‘000 UNITS)
TABLE 32. SLIDING EXTERIOR DOORS MARKET, BY GEOGRAPHY, 2014-2023 ($MILLION)
TABLE 33. SLIDING EXTERIOR DOORS MARKET, BY GEOGRAPHY, 2014-2023 (‘000 UNITS)
TABLE 34. FOLDING EXTERIOR DOORS MARKET, BY GEOGRAPHY, 2014-2023 ($MILLION)
TABLE 35. FOLDING EXTERIOR DOORS MARKET, BY GEOGRAPHY, 2014-2023 (‘000 UNITS)
TABLE 36. REVOLVING & OTHER EXTERIOR DOORS MARKET, BY GEOGRAPHY, 2014-2023 ($MILLION)
TABLE 37. REVOLVING & OTHER EXTERIOR DOORS MARKET, BY GEOGRAPHY, 2014-2023 (‘000 UNITS)
TABLE 38. GLOBAL EXTERIOR DOORS MARKET, BY END USER, 2014-2023 ($MILLION)
TABLE 39. GLOBAL EXTERIOR DOORS MARKET, BY END USER, 2014-2023 (‘000 UNITS)
TABLE 40. EXTERIOR DOORS MARKET FOR RESIDENTIAL SECTOR, BY GEOGRAPHY, 2014-2023 ($MILLION)
TABLE 41. EXTERIOR DOORS MARKET FOR RESIDENTIAL SECTOR, BY GEOGRAPHY, 2014-2023 (‘000 UNITS)
TABLE 42. EXTERIOR DOORS MARKET FOR NONRESIDENTIAL SECTOR, BY GEOGRAPHY, 2014-2023 ($MILLION)
TABLE 43. EXTERIOR DOORS MARKET FOR NONRESIDENTIAL SECTOR, BY GEOGRAPHY, 2014-2023 (‘000 UNITS)
TABLE 44. EXTERIOR DOORS MARKET, BY GEOGRAPHY, 2014-2023 ($MILLION)
TABLE 45. EXTERIOR DOORS MARKET, BY GEOGRAPHY, 2014-2023 (‘000 UNITS)
TABLE 46. NORTH AMERICA EXTERIOR DOORS MARKET, BY MATERIAL, 2014-2023 ($MILLION)
TABLE 47. NORTH AMERICA EXTERIOR DOORS MARKET, BY MATERIAL, 2014-2023 (‘000 UNITS)
TABLE 48. NORTH AMERICA EXTERIOR DOORS MARKET, BY MECHANISM, 2014-2023 ($MILLION)
TABLE 49. NORTH AMERICA EXTERIOR DOORS MARKET, BY MECHANISM, 2014-2023 (‘000 UNITS)
TABLE 50. NORTH AMERICA EXTERIOR DOORS MARKET, BY DOOR TYPE, 2014-2023 ($MILLION)
TABLE 51. NORTH AMERICA EXTERIOR DOORS MARKET, BY DOOR TYPE, 2014-2023 (‘000 UNITS)
TABLE 52. NORTH AMERICA EXTERIOR DOORS MARKET, BY END USER, 2014-2023 ($MILLION)
TABLE 53. NORTH AMERICA EXTERIOR DOORS MARKET, BY END USER, 2014-2023 (‘000 UNITS)
TABLE 54. NORTH AMERICA EXTERIOR DOORS MARKET, BY COUNTRY, 2014-2023 ($MILLION)
TABLE 55. NORTH AMERICA EXTERIOR DOORS MARKET, BY COUNTRY, 2014-2023 (‘000 UNITS)
TABLE 56. EUROPE EXTERIOR DOORS MARKET, BY MATERIAL, 2014-2023 ($MILLION)
TABLE 57. EUROPE EXTERIOR DOORS MARKET, BY MATERIAL, 2014-2023 (‘000 UNITS)
TABLE 58. EUROPE EXTERIOR DOORS MARKET, BY MECHANISM, 2014-2023 ($MILLION)
TABLE 59. EUROPE EXTERIOR DOORS MARKET, BY MECHANISM, 2014-2023 (‘000 UNITS)
TABLE 60. EUROPE EXTERIOR DOORS MARKET, BY DOOR TYPE, 2014-2023 ($MILLION)
TABLE 61. EUROPE EXTERIOR DOORS MARKET, BY DOOR TYPE, 2014-2023 (‘000 UNITS)
TABLE 62. EUROPE EXTERIOR DOORS MARKET, BY END USER, 2014-2023 ($MILLION)
TABLE 63. EUROPE EXTERIOR DOORS MARKET, BY END USER, 2014-2023 (‘000 UNITS)
TABLE 64. EUROPE EXTERIOR DOORS MARKET, BY COUNTRY, 2014-2023 ($MILLION)
TABLE 65. EUROPE EXTERIOR DOORS MARKET, BY COUNTRY, 2014-2023 (‘000 UNITS)
TABLE 66. ASIA-PACIFIC EXTERIOR DOORS MARKET, BY MATERIAL, 2014-2023 ($MILLION)
TABLE 67. ASIA-PACIFIC EXTERIOR DOORS MARKET, BY MATERIAL, 2014-2023 (‘000 UNITS)
TABLE 68. ASIA-PACIFIC EXTERIOR DOORS MARKET, BY MECHANISM, 2014-2023 ($MILLION)
TABLE 69. ASIA-PACIFIC EXTERIOR DOORS MARKET, BY MECHANISM, 2014-2023 (‘000 UNITS)
TABLE 70. ASIA-PACIFIC EXTERIOR DOORS MARKET, BY DOOR TYPE, 2014-2023 ($MILLION)
TABLE 71. ASIA-PACIFIC EXTERIOR DOORS MARKET, BY DOOR TYPE, 2014-2023 (‘000 UNITS)
TABLE 72. ASIA-PACIFIC EXTERIOR DOORS MARKET, BY END USER, 2014-2023 ($MILLION)
TABLE 73. ASIA-PACIFIC EXTERIOR DOORS MARKET, BY END USER, 2014-2023 (‘000 UNITS)
TABLE 74. ASIA-PACIFIC EXTERIOR DOORS MARKET, BY COUNTRY, 2014-2023 ($MILLION)
TABLE 75. ASIA-PACIFIC EXTERIOR DOORS MARKET, BY COUNTRY, 2014-2023 (‘000 UNITS)
TABLE 76. LAMEA EXTERIOR DOORS MARKET, BY MATERIAL, 2014-2023 ($MILLION)
TABLE 77. LAMEA EXTERIOR DOORS MARKET, BY MATERIAL, 2014-2023 (‘000 UNITS)
TABLE 78. LAMEA EXTERIOR DOORS MARKET, BY MECHANISM, 2014-2023 ($MILLION)
TABLE 79. LAMEA EXTERIOR DOORS MARKET, BY MECHANISM, 2014-2023 (‘000 UNITS)
TABLE 80. LAMEA EXTERIOR DOORS MARKET, BY DOOR TYPE, 2014-2023 ($MILLION)
TABLE 81. LAMEA EXTERIOR DOORS MARKET, BY DOOR TYPE, 2014-2023 (‘000 UNITS)
TABLE 82. LAMEA EXTERIOR DOORS MARKET, BY END USER, 2014-2023 ($MILLION)
TABLE 83. LAMEA EXTERIOR DOORS MARKET, BY END USER, 2014-2023 (‘000 UNITS)
TABLE 84. LAMEA EXTERIOR DOORS MARKET, BY REGION, 2014-2023 ($MILLION)
TABLE 85. LAMEA EXTERIOR DOORS MARKET, BY REGION, 2014-2023 (‘000 UNITS)
TABLE 86. ASSA ABLOY AB: COMPANY SNAPSHOT
TABLE 87. ASSA ABLOY AB: OPERATING SEGMENTS
TABLE 88. ASSA ABLOY AB: PRODUCT PORTFOLIO
TABLE 89. ATRIUM CORPORATION: COMPANY SNAPSHOT
TABLE 90. ATRIUM CORPORATION: OPERATING SEGMENTS
TABLE 91. ATRIUM CORPORATION: PRODUCT PORTFOLIO
TABLE 92. BAYER BUILT INC.: COMPANY SNAPSHOT
TABLE 93. BAYER BUILT INC.: OPERATING SEGMENTS
TABLE 94. BAYER BUILT INC.: PRODUCT PORTFOLIO
TABLE 95. ETO DOORS: COMPANY SNAPSHOT
TABLE 96. ETO DOORS: OPERATING SEGMENTS
TABLE 97. ETO DOORS: PRODUCT PORTFOLIO
TABLE 98. JELD-WEN HOLDING, INC.: COMPANY SNAPSHOT
TABLE 99. JELD-WEN HOLDING, INC.: OPERATING SEGMENTS
TABLE 100. JELD-WEN HOLDING, INC.: PRODUCT PORTFOLIO
TABLE 101. JS DOORS MANUFACTURER PTE LTD.: COMPANY SNAPSHOT
TABLE 102. JS DOORS MANUFACTURER PTE LTD.: OPERATING SEGMENTS
TABLE 103. JS DOORS MANUFACTURER PTE LTD.: PRODUCT PORTFOLIO
TABLE 104. MASONITE INTERNATIONAL CORPORATION: COMPANY SNAPSHOT
TABLE 105. MASONITE INTERNATIONAL CORPORATION: OPERATING SEGMENTS
TABLE 106. MASONITE INTERNATIONAL CORPORATION: PRODUCT PORTFOLIO
TABLE 107. MARVIN WINDOWS AND DOORS, INC.: COMPANY SNAPSHOT
TABLE 108. MARVIN WINDOWS AND DOORS, INC.: OPERATING SEGMENTS
TABLE 109. MARVIN WINDOWS AND DOORS, INC.: PRODUCT PORTFOLIO
TABLE 110. VKR HOLDING: COMPANY SNAPSHOT
TABLE 111. VKR HOLDING: OPERATING SEGMENTS
TABLE 112. VKR HOLDING: PRODUCT PORTFOLIO
TABLE 113. PELLA CORPORATION: COMPANY SNAPSHOT
TABLE 114. PELLA CORPORATION: OPERATING SEGMENTS
TABLE 115. PELLA CORPORATION: PRODUCT PORTFOLIO

LIST OF FIGURES

FIGURE 1. TOP WINNING STRATEGIES
FIGURE 2. PORTER’S FIVE FORCES
FIGURE 3. TOP WINNING STRATEGIES
FIGURE 4. GLOBAL EXTERIOR DOORS MARKET, BY DOOR TYPE, 2016 (%)
FIGURE 5. GLOBAL PANEL EXTERIOR DOORS MARKET, 2016-2023 ($MILLION)
FIGURE 6. GLOBAL PANEL EXTERIOR DOORS MARKET, 2016-2023 (‘000 UNITS)
FIGURE 7. GLOBAL BYPASS EXTERIOR DOORS MARKET, 2016-2023 ($MILLION)
FIGURE 8. GLOBAL BYPASS EXTERIOR DOORS MARKET, 2016-2023 (‘000 UNITS)
FIGURE 9. GLOBAL BIFOLD EXTERIOR DOORS MARKET, 2016-2023 ($MILLION)
FIGURE 10. GLOBAL BIFOLD EXTERIOR DOORS MARKET, 2016-2023 (‘000 UNITS)
FIGURE 11. GLOBAL POCKET EXTERIOR DOORS MARKET, 2016-2023 ($MILLION)
FIGURE 12. GLOBAL POCKET EXTERIOR DOORS MARKET, 2016-2023 (‘000 UNITS)
FIGURE 13. GLOBAL OTHER EXTERIOR DOORS MARKET, 2016-2023 ($MILLION)
FIGURE 14. GLOBAL OTHER EXTERIOR DOORS MARKET, 2016-2023 (‘000 UNITS)
FIGURE 15. GLOBAL EXTERIOR DOOR MARKET, BY MATERIAL, 2016 (%)
FIGURE 16. GLOBAL WOODEN EXTERIOR DOORS MARKET, 2016-2023 ($MILLION)
FIGURE 17. GLOBAL WOODEN EXTERIOR DOORS MARKET, 2016-2023 (‘000 UNITS)
FIGURE 18. GLOBAL METALLIC EXTERIOR DOORS MARKET, 2016-2023 ($MILLION)
FIGURE 19. GLOBAL METALLIC EXTERIOR DOORS MARKET, 2016-2023 (‘000 UNITS)
FIGURE 20. GLOBAL GLASS EXTERIOR DOORS MARKET, 2016-2023 ($MILLION)
FIGURE 21. GLOBAL GLASS EXTERIOR DOORS MARKET, 2016-2023 (‘000 UNITS)
FIGURE 22. GLOBAL FIBERBOARD EXTERIOR DOORS MARKET, 2016-2023 ($MILLION)
FIGURE 23. GLOBAL FIBERBOARD EXTERIOR DOORS MARKET, 2016-2023 (‘000 UNITS)
FIGURE 24. GLOBAL FIBERGLASS EXTERIOR DOORS MARKET, 2016-2023 ($MILLION)
FIGURE 25. GLOBAL FIBERGLASS EXTERIOR DOORS MARKET, 2016-2023 (‘000 UNITS)
FIGURE 26. GLOBAL VINYL EXTERIOR DOORS MARKET, 2016-2023 ($MILLION)
FIGURE 27. GLOBAL VINYL EXTERIOR DOORS MARKET, 2016-2023 (‘000 UNITS)
FIGURE 28. GLOBAL EXTERIOR DOORS MARKET, BY MECHANISM, 2016 (%)
FIGURE 29. GLOBAL SWINGING EXTERIOR DOORS MARKET, 2016-2023 ($MILLION)
FIGURE 30. GLOBAL SWINGING EXTERIOR DOORS MARKET, 2016-2023 (‘000 UNITS)
FIGURE 31. GLOBAL SLIDING EXTERIOR DOORS MARKET, 2016-2023 ($MILLION)
FIGURE 32. GLOBAL SLIDING EXTERIOR DOORS MARKET, 2016-2023 (‘000 UNITS)
FIGURE 33. GLOBAL FOLDING EXTERIOR DOORS MARKET, 2016-2023 ($MILLION)
FIGURE 34. GLOBAL FOLDING EXTERIOR DOORS MARKET, 2016-2023 (‘000 UNITS)
FIGURE 35. GLOBAL REVOLVING & OTHER EXTERIOR DOORS MARKET, 2016-2023 ($MILLION)
FIGURE 36. GLOBAL REVOLVING & OTHER EXTERIOR DOORS MARKET, 2016-2023 (‘000 UNITS)
FIGURE 37. GLOBAL EXTERIOR DOORS MARKET, BY END USER, 2016 (%)
FIGURE 38. GLOBAL EXTERIOR DOORS MARKET FOR RESIDENTIAL SECTOR, 2014-2023 ($MILLION)
FIGURE 39. GLOBAL EXTERIOR DOORS MARKET FOR RESIDENTIAL SECTOR, 2014-2023 (‘000 UNITS)
FIGURE 40. GLOBAL EXTERIOR DOORS MARKET FOR NONRESIDENTIAL SECTOR, 2014-2023 ($MILLION)
FIGURE 41. GLOBAL EXTERIOR DOORS MARKET FOR NONRESIDENTIAL SECTOR, 2014-2023 (‘000 UNITS)
FIGURE 42. U.S. EXTERIOR DOORS MARKET, 2016-2023 ($MILLION)
FIGURE 43. U.S. EXTERIOR DOORS MARKET, 2016-2023 (‘000 UNITS)
FIGURE 44. CANADA EXTERIOR DOORS MARKET, 2016-2023 ($MILLION)
FIGURE 45. CANADA EXTERIOR DOORS MARKET, 2016-2023 (‘000 UNITS)
FIGURE 46. MEXICO EXTERIOR DOORS MARKET, 2016-2023 ($MILLION)
FIGURE 47. MEXICO EXTERIOR DOORS MARKET, 2016-2023 (‘000 UNITS)
FIGURE 48. GERMANY EXTERIOR DOORS MARKET, 2016-2023 ($MILLION)
FIGURE 49. GERMANY EXTERIOR DOORS MARKET, 2016-2023 (‘000 UNITS)
FIGURE 50. FRANCE EXTERIOR DOORS MARKET, 2016-2023 ($MILLION)
FIGURE 51. FRANCE EXTERIOR DOORS MARKET, 2016-2023 (‘000 UNITS)
FIGURE 52. UK EXTERIOR DOORS MARKET, 2016-2023 ($MILLION)
FIGURE 53. UK EXTERIOR DOORS MARKET, 2016-2023 (‘000 UNITS)
FIGURE 54. ITALY EXTERIOR DOORS MARKET, 2016-2023 ($MILLION)
FIGURE 55. ITALY EXTERIOR DOORS MARKET, 2016-2023 (‘000 UNITS)
FIGURE 56. REST OF EUROPE EXTERIOR DOORS MARKET, 2016-2023 ($MILLION)
FIGURE 57. REST OF EUROPE EXTERIOR DOORS MARKET, 2016-2023 (‘000 UNITS)
FIGURE 58. CHINA EXTERIOR DOORS MARKET, 2016-2023 ($MILLION)
FIGURE 59. CHINA EXTERIOR DOORS MARKET, 2016-2023 (‘000 UNITS)
FIGURE 60. INDIA EXTERIOR DOORS MARKET, 2016-2023 ($MILLION)
FIGURE 61. INDIA EXTERIOR DOORS MARKET, 2016-2023 (‘000 UNITS)
FIGURE 62. JAPAN EXTERIOR DOORS MARKET, 2016-2023 ($MILLION)
FIGURE 63. JAPAN EXTERIOR DOORS MARKET, 2016-2023 (‘000 UNITS)
FIGURE 64. REST OF ASIA-PACIFIC EXTERIOR DOORS MARKET, 2016-2023 ($MILLION)
FIGURE 65. REST OF ASIA-PACIFIC EXTERIOR DOORS MARKET, 2016-2023 (‘000 UNITS)
FIGURE 66. LATIN AMERICA EXTERIOR DOORS MARKET, 2016-2023 ($MILLION)
FIGURE 67. LATIN AMERICA EXTERIOR DOORS MARKET, 2016-2023 (‘000 UNITS)
FIGURE 68. MIDDLE EAST EXTERIOR DOORS MARKET, 2016-2023 ($MILLION)
FIGURE 69. MIDDLE EAST EXTERIOR DOORS MARKET, 2016-2023 (‘000 UNITS)
FIGURE 70. AFRICA EXTERIOR DOORS MARKET, 2016-2023 ($MILLION)
FIGURE 71. AFRICA EXTERIOR DOORS MARKET, 2016-2023 (‘000 UNITS)
FIGURE 72. ASSA ABLOY AB: NET SALE, 2014-2016 ($MILLION)
FIGURE 73. ASSA ABLOY AB: REVENUE SHARE BY SEGMENT, 2016 (%)
FIGURE 74. ASSA ABLOY AB: REVENUE SHARE BY GEOGRAPHY, 2016 (%)
FIGURE 75. MASONITE INTERNATIONAL CORPORATION: NET SALES, 2014-2016 ($MILLION)
FIGURE 76. MASONITE INTERNATIONAL CORPORATION: REVENUE SHARE BY PRODUCT, 2016 (%)
FIGURE 77. MASONITE INTERNATIONAL CORPORATION: REVENUE SHARE BY GEOGRAPHY, 2016 (%)
FIGURE 78. VKR HOLDING: NET SALES, 2014-2016 ($MILLION)
FIGURE 79. VKR HOLDING: REVENUE SHARE BY GEOGRAPHY, 2016 (%)
FIGURE 80. YKK CORPORATION: NET SALES, 2014-2016 ($MILLION)
FIGURE 81. YKK CORPORATION: REVENUE SHARE BY SEGMENT, 2016 (%)
FIGURE 82. YKK CORPORATION: REVENUE SHARE BY GEOGRAPHY, 2016 (%)


Exterior doors create appropriate and well-designed functional space with proper access points and effective circulatory patterns in a building. The maximum demand for exterior doors market is generated from panel doors. Panel doors are gaining traction among the end user due to their ability to accentuate the aesthetic appeal of building entrances.

Developed regions, such as the North America and Western Europe, have reported hugger penetration of residential over nonresidential construction due to recovery of the housing market over the last few years. Increase in demand from nonresidential construction sectors, namely, lodging and commercial sectors in the U.S. and office and retail sectors in Western Europe is expected to provide the necessary impetus for the exterior doors market growth. The relative revenue contribution of residential and nonresidential sector in Asia-Pacific is more or less equally distributed. The nonresidential sector is expected to witness the highest growth rate due to increase in demand from China, India, and other emerging countries such as Indonesia, Philippines, and others. Rapid industrialization and urbanization acts as the key driver for market growth. Moreover, rise in population and a surge in disposable income supplement this growth. Numerous players operating in the market have adopted strategies such as acquisition and product launch to sustain the intense competition.

PURCHASE OPTIONS

Call or Email us

U.S.-Canada Toll-free: +1-800-792-5285
Int'l : +1-503-894-6022
Europe : +44-845-528-1300
Email : help@alliedmarketresearch.com

Looking for Customization?

 Customization Request

Have a Question?

 Speak with Analyst

Any Confusion?

 Inquire Before Buying

Have a glance of the Report

  Request Sample

Purchase Full Report of
Exterior Doors Market

Start reading instantly.
This Report and over 68,244+ more Reports, Available with Avenue Library. T&C*.

  • Online Only
  • $3,570
  • Online cloud access only
  • Restricted print, copy, paste & download
  • Read only
  • Free industry update
    (Within 180 days)
  • Free report update in next update cycle
    (Jan 2019 - Jan 2020)
  • Data Pack
  • $3,840
  • Restricted to one authorized user
  • One print only
  • Available in
    Excel
  • Free industry update
    (Within 180 days)
  •   Free report update in next update cycle
    (Jan 2019 - Jan 2020)
  • Single User
  • $5,730
  • Restricted to one authorized user
  • One print only
  • Available in
    PDF
  • Free industry update
    (Within 180 days)
  •   Free report update in next update cycle
    (Jan 2019 - Jan 2020)
  • Five Users
  • $6,450
  • Limited to five authorized users
  • Print upto five copies
  • Available in
    PDF
  • Free industry update
    (Within 180 days)
  •   Free report update in next update cycle
    (Jan 2019 - Jan 2020)
  • Enterprise
    License/PDF

  • $9,600
  • Unlimited
    within
    company/enterprise
  • Available in Excel & PDF
  • Free industry update
    (Within 180 days)
  •   Free report update in next update cycle
    (Jan 2019 - Jan 2020)
  • Library
    Membership

  • $999 $ 1,175
    Per User/ Per month/ Billed annually
  • Published Content
    E-access
  • Company Profiles
    E-access
  • Newly Added Content Access
  • 10 PDF
    Downloads
  • 5 Excel Data
    Pack Downloads
  • 250 Company Profiles PDF Downloads
  • Buy Now

*Taxes/Fees, if applicable will be added during checkout. All prices in USD

RELATED REPORTS
 

Why Allied Market Research?


Infallible Methodology

To ensure high-level data integrity, accurate analysis, and impeccable forecasts

Analyst Support

For complete satisfaction

Customization

On-demand customization of scope of the report to exactly meet your needs

TARGETED MARKET VIEW

Targeted market view to provide pertinent information and save time of readers

Get fresh content delivered

Get insights on topics that are crucial for your business. Stay abreast of your interest areas.

Get Industry Data Alerts

Why Allied Market Research?

Infallible Methodology

To ensure high-level data integrity, accurate analysis, and impeccable forecasts

Analyst Support

For complete satisfaction

Customization

On-demand customization of scope of the report to exactly meet your needs

TARGETED MARKET VIEW

Targeted market view to provide pertinent information and save time of readers