0
New
New
2023
Fan Market

Fan Market

by Product Type (Ceiling Fan, Pedestal Fan, Table Fan, Exhaust Fan, Wall Fan, Others), by End User (Residential, Light Commercial), by Distribution Channel (Multi Brand Store, Hypermarkets, Exclusive Store, Online, Others): Global Opportunity Analysis and Industry Forecast, 2022-2031

Report Code: A12405
May 2023 | Pages: 274
Tables: 151
Charts: 68
  • Formats*:

  • pdf

    Single User License, Five User
    License & Enterprise User License

  • xls

    Data Pack Excel License

  • ppt

    It comes with the additional cost
    of $2500.00 contact sales.


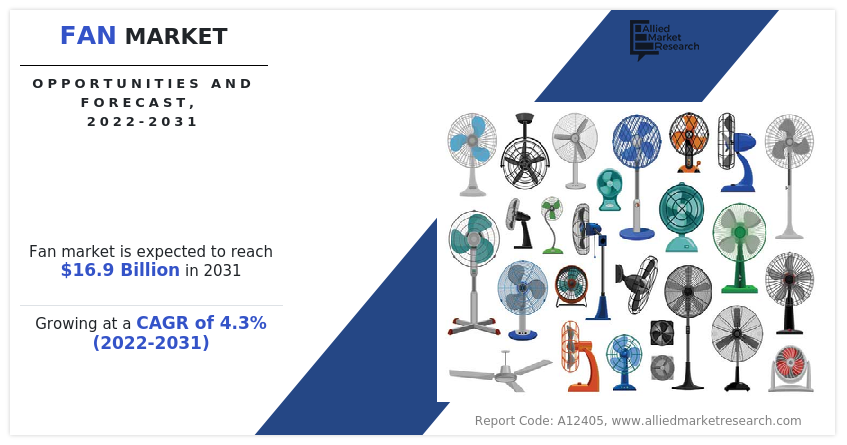
The global fan market size was valued at $11.1 billion in 2021 and is projected to reach $16.9 billion by 2031, growing at a CAGR of 4.3% from 2022 to 2031.
As the climate is changing every year, there is an increase in humidity that causes individuals to carry or use fans. The market for fan is expected to witness an increase in demand from regions that are highly humid. An increase in the level of carbon dioxide and depletion of the ozone layer have led to rise in the temperature across the globe.

Fan Market

The fan is an electrical device that uses an electric motor to circulate air in a room or space. It typically consists of a set of blades mounted on a rotating shaft, which is powered by an electric motor. Different types of fans are offered by the manufacturers such as ceiling fan, pedestal fan, table fan, exhaust fan, and wall fan, which are widely used in residential and light commercial spaces. Fans are used for ventilation, to remove stale air and bring in fresh air. It is often used in bathrooms, kitchens, and other areas where moisture and odor need to be removed.

Market Dynamics

Innovative and advanced home appliances have gained major popularity among customers. People have started preferring & replacing traditional fans with smart and advanced-featured fan. Smartphone compatibility, voice & remote control, and Wi-Fi connectivity are some of the key features that have gained major popularity among people. With the rise in awareness about technologically advanced home appliances including portable fans and ACs, the manufacturers offer voice-controlled system-based fans that are integrated with popular voice-operated systems such as Amazon Alexa, Apple HomeKit, or Google Assistant. Consumers appalling innovations and aesthetic designs of fans a factor that is expected to propel the growth of the fan industry in the upcoming years.

As the climate is changing every year, there is an increase in humidity that causes individuals to carry or use fans. The market for fans is expected to witness an increase in demand from regions that are highly humid. An increase in the level of carbon dioxide and depletion of the ozone layer has led to a rise in temperature across the globe. Such a rise in temperature and humidity has increased the need for fans in various regions to maintain fresh air ventilation. With the surge in temperature and climatic changes, the demand for innovative and fast fans is increasing day by day. The change in climatic conditions is expected to fuel the growth of the fan market in the upcoming years.

The global fan industry was impacted profoundly by the outbreak of the coronavirus. The demand for fans slightly declined across the world, owing to supply chain disruptions and the implementation of stringent restrictions to follow social distancing & consistent lockdowns across the globe.

Manufacturers have modified their marketing and branding approaches for their goods to boost sales in various nations. They have implemented innovative tactics to boost sales of different fans, such as ceiling fan, pedestal fan, table fan¸ exhaust fan, and wall fan, along with the introduction of new products with innovative technology and features. A common tactic used by manufacturers to draw in more consumers is the production of energy-efficient with value-added features. This aids in boosting the revenue of businesses engaged in this sector. Collectively, all these strategies adopted by manufacturers drive the growth of the fan market.

Smart and upgraded household appliances not only require the advertisement to increase awareness about the products, however, also require a wide area distribution network. A rapidly increasing number of large retail stores including supermarkets and hypermarkets in developing economies has enabled easier availability of white goods such as fans, as these stores help increase the sales of household appliances. Supermarkets & hypermarkets and specialty stores have served as better distribution points for various consumer goods including air conditioners, fans, and heaters. The growth in the retail sector in developing countries such as India, China, Chile, Thailand, and other developing countries is expected to create more opportunities for fan manufacturers during the fan market forecast.

Improvement in economic conditions is a key factor that contributes to the growth of the market. An increase in per capita disposable income enhances the spending capacity of consumers, leading to rise in expenditure on premium household appliances, which is expected to foster the growth of the fan market. The rise in spending capacity is further anticipated to improve the standard of living, enabling consumers to buy highly advanced and smart featured home appliances such as portable fan and smart fan, which is expected to propel the demand in the upcoming years. In addition, the rise in disposable income in developing countries such as India and China has increased the expenditure on household appliances, which further drives the growth of the global fan market.

Electricity is the foremost part of household appliances including fan. Energy prices are a significant part of domestic expenditures and play a significant role in industrial competitiveness and influence energy consumption patterns. The lack of proper electricity in the village and remote areas demotivates people to buy an electric fan. In areas where electrification is limited, people may not have access to electricity to power fans. This limits the potential customer base for fan manufacturers and reduces the demand for fans. In some remote areas where electricity is not readily available, the installation of electrical infrastructure can be costly. This can make it difficult for manufacturers to reach potential customers and for consumers to afford the installation of electrical infrastructure. For instance, according to the Alliance for Rural Electrification (ARE), as of 2017, over one billion people worldwide lack household electric power – 14% of the global population. The lack of proper electrification in remote areas is expected to hinder the growth of the fan market.

Segmental Overview

The fan market is segmented into product type, end user, distribution channel, and region. By product type, the market is divided into ceiling fan, pedestal fan, table fan, exhaust fan, wall fan, and others. By end user, the market is bifurcated into residential and light commercial. By distribution channel, the market is classified into multi-brand store, hypermarkets, exclusive store, online, and others. Region-wise, the market is analyzed across North America (the U.S., Canada, and Mexico), Europe (Germany, France, Italy, Spain, UK, Russia, and rest of Europe), Asia-Pacific (China, Japan, India, South Korea, Australia, Thailand, Malaysia, Indonesia, and rest of Asia-Pacific), and LAMEA (Brazil, South Africa, Saudi Arabia, UAE, Argentina, and rest of LAMEA).
Fan Market

By Product Type

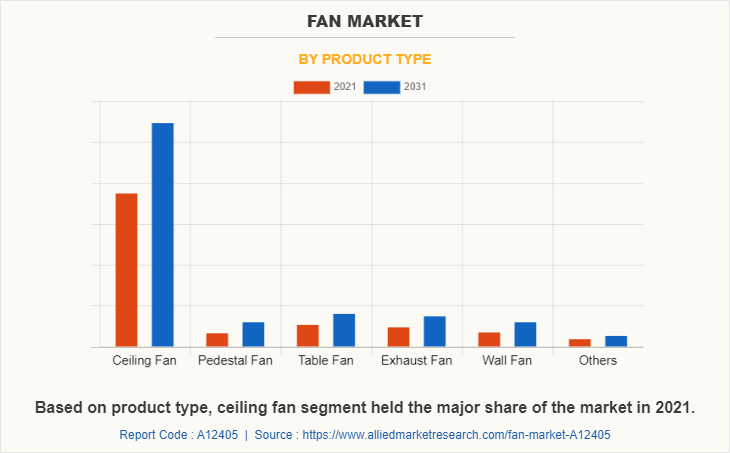
By product type, the ceiling fan segment held the major fan market share in 2021 as ceiling fans are more energy-efficient and cost-effective than air conditioning systems. In addition, some smart ceiling fans offer features such as timers and schedules, which can help users save energy and money by only operating the fan when needed. With the ongoing trends in the market, manufacturers offer several types of decorative fans. Decorative ceiling fans have gained popularity as they serve as a statement piece in a room.
Fan Market

By End User

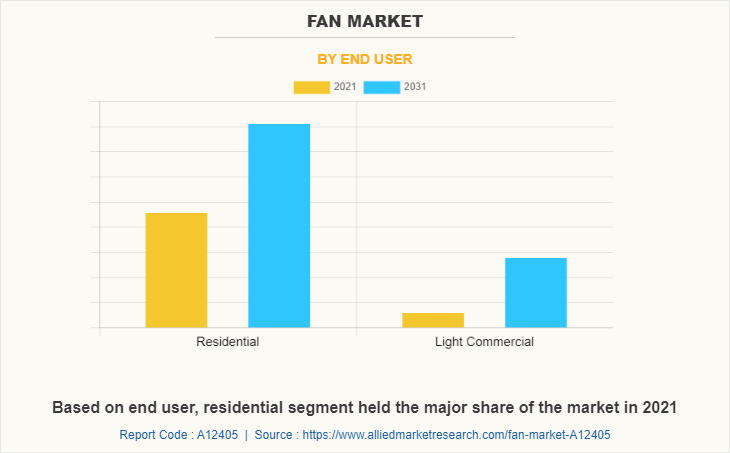
By end user, the residential segment held the major share of the market in 2021. The residential segment refers to the non-commercial use of the fan. Improved lifestyle and standard of living of the people are the factors that boost the demand for household consumer durables. The rise in spending on home improvement with the smart and advanced featured appliances, upsurge in the standard of living, and surge in disposable income are majorly attributable to the fan market growth through the residential segment, during the forecast period.
Fan Market

By Distribution Channel

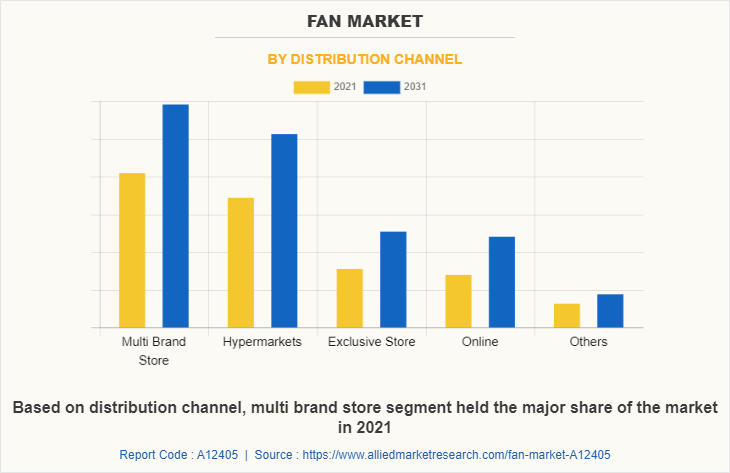
By distribution channel, the multi-brand store segment held the major share of the market in 2021 and is expected to maintain its dominance during the forecast period. A multi-brand store in the fan market refers to a retail store that offers a variety of fan-related products from varied brands. The fan market includes products such as ceiling fans, pedestal fans, table fans, exhaust fans, wall fans, and others. The multi-brand store market for fan merchandise has seen a surge in recent years, driven by the demand for unique and high-quality merchandise.
Fan Market

By Region

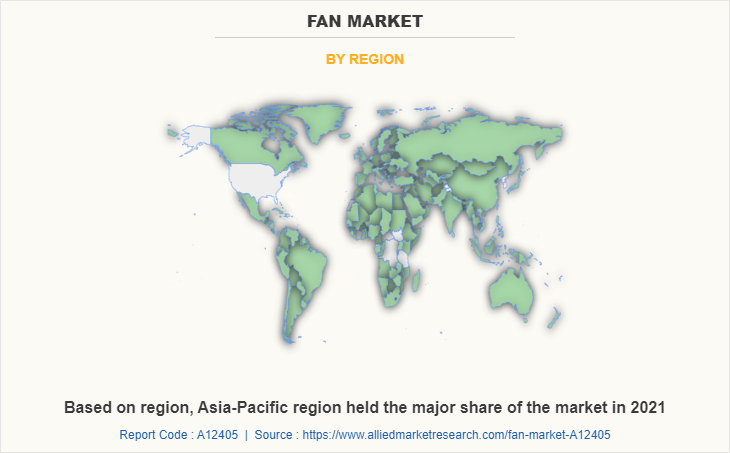
Region-wise, Asia-Pacific was the largest market in 2021 and held the major market share of the market in 2021. Global brands strive among themselves to deliver better value propositions and effective marketing strategies. Asia-Pacific is projected to grow at the highest CAGR, owing to the constantly expanding infrastructure and real estate sector, where electric fans is demanded. The surge in urbanization and the high standard of living of the people, especially in developing countries including India and China, drive the growth of the fan market in Asia-Pacific. Rise in disposable income and high spending on home improvement are some of the major factors positively influencing fan market demand.

Competition Analysis

The players in the fan market have adopted acquisition, business expansion, partnership, collaboration, and product launch as their key development strategies to increase profitability and improve their position in the fan market.

Some of the key players profiled in the fan market analysis include Ajanta Electricals, Broan-NuTone, LLC, Crompton Greaves Consumer Electricals Limited, Emerson Electric Co., Fanimation, Hunter Fan Company, Minka Lighting Inc, Panasonic Holdings Corporation, The Henley Fan Company, and Westinghouse Electric Corporation.

Key Benefits For Stakeholders

  • This report provides a quantitative analysis of the market segments, current trends, estimations, and dynamics of the fan market analysis from 2021 to 2031 to identify the prevailing fan market opportunities.
  • The market research is offered along with information related to key drivers, restraints, and opportunities.
  • Porter's five forces analysis highlights the potency of buyers and suppliers to enable stakeholders make profit-oriented business decisions and strengthen their supplier-buyer network.
  • In-depth analysis of the fan market segmentation assists to determine the prevailing market opportunities.
  • Major countries in each region are mapped according to their revenue contribution to the global market.
  • Market player positioning facilitates benchmarking and provides a clear understanding of the present position of the market players.
  • The report includes the analysis of the regional as well as global fan market trends, key players, market segments, application areas, and market growth strategies.

Fan Market Report Highlights

Aspects Details
Market Size By 2031 USD 16.9 billion
Growth Rate CAGR of 4.3%
Forecast period 2021 - 2031
Report Pages 274
By Product Type
  • Ceiling Fan
  • Pedestal Fan
  • Table Fan
  • Exhaust Fan
  • Wall Fan
  • Others
By End User
  • Residential
  • Light Commercial
By Distribution Channel
  • Multi Brand Store
  • Hypermarkets
  • Exclusive Store
  • Online
  • Others
By Region
  • North America  (U.S., Canada, Mexico)
  • Europe  (Germany, France, Italy, Spain, UK, Russia, Rest of Europe)
  • Asia-Pacific  (China, Japan, India, South Korea, Australia, Thailand, Malaysia, Indonesia, Rest of Asia-Pacific)
  • LAMEA  (Brazil, South Africa,, Saudi Arabia, UAE, Argentina, Rest of LAMEA)
Key Market Players Panasonic Holdings Corporation, Ajanta Electricals, Emerson Electric Co., The Henley Fan Company, Broan-NuTone, LLC, Fanimation, Hunter Fan Company, Westinghouse Electric Corporation, Crompton Greaves Consumer Electricals Limited, Minka Lighting Inc

Analyst Review

According to the insights of CXOs of leading companies, the fan market holds a substantial scope for growth; however, its contribution to the world market would increase significantly during the forecast period. Innovation is the key to the success of the fan market.

The fan market exhibits high growth potential in developing economies such as India and China, owing to an increase in disposable income and high spending for improving a high standard of living. People are actively replacing old consumer durables goods with smart and highly technologically advanced consumer durable goods including fans. Nowadays, key players are making advanced and smart-featured home and commercial appliances. Wi-Fi connectivity, voice & remote control, and smartphone compatibility featured fans are expected to attract consumers and create huge demand during the forecast period.

 
  • CHAPTER 1: INTRODUCTION

    • 1.1. Report description

    • 1.2. Key market segments

    • 1.3. Key benefits to the stakeholders

    • 1.4. Research Methodology

      • 1.4.1. Primary research

      • 1.4.2. Secondary research

      • 1.4.3. Analyst tools and models

  • CHAPTER 2: EXECUTIVE SUMMARY

    • 2.1. CXO Perspective

  • CHAPTER 3: MARKET OVERVIEW

    • 3.1. Market definition and scope

    • 3.2. Key findings

      • 3.2.1. Top impacting factors

      • 3.2.2. Top investment pockets

    • 3.3. Porter’s five forces analysis

      • 3.3.1. Bargaining power of suppliers

      • 3.3.2. Bargaining power of buyers

      • 3.3.3. Threat of substitutes

      • 3.3.4. Threat of new entrants

      • 3.3.5. Intensity of rivalry

    • 3.4. Market dynamics

      • 3.4.1. Drivers

        • 3.4.1.1. Global climatic changes
        • 3.4.1.2. The rise in popularity of smart and Wi-Fi-enabled fan
        • 3.4.1.3. Surge in construction activities and number of households

      • 3.4.2. Restraints

        • 3.4.2.1. Rise in energy consumption and increase in electricity prices
        • 3.4.2.2. Lack of proper electrification

      • 3.4.3. Opportunities

        • 3.4.3.1. Effective marketing
        • 3.4.3.2. The rapid growth of the retail sector

    • 3.5. COVID-19 Impact Analysis on the market

  • CHAPTER 4: FAN MARKET, BY PRODUCT TYPE

    • 4.1. Overview

      • 4.1.1. Market size and forecast

    • 4.2. Ceiling Fan

      • 4.2.1. Key market trends, growth factors and opportunities

      • 4.2.2. Market size and forecast, by region

      • 4.2.3. Market share analysis by country

    • 4.3. Pedestal Fan

      • 4.3.1. Key market trends, growth factors and opportunities

      • 4.3.2. Market size and forecast, by region

      • 4.3.3. Market share analysis by country

    • 4.4. Table Fan

      • 4.4.1. Key market trends, growth factors and opportunities

      • 4.4.2. Market size and forecast, by region

      • 4.4.3. Market share analysis by country

    • 4.5. Exhaust Fan

      • 4.5.1. Key market trends, growth factors and opportunities

      • 4.5.2. Market size and forecast, by region

      • 4.5.3. Market share analysis by country

    • 4.6. Wall Fan

      • 4.6.1. Key market trends, growth factors and opportunities

      • 4.6.2. Market size and forecast, by region

      • 4.6.3. Market share analysis by country

    • 4.7. Others

      • 4.7.1. Key market trends, growth factors and opportunities

      • 4.7.2. Market size and forecast, by region

      • 4.7.3. Market share analysis by country

  • CHAPTER 5: FAN MARKET, BY END USER

    • 5.1. Overview

      • 5.1.1. Market size and forecast

    • 5.2. Residential

      • 5.2.1. Key market trends, growth factors and opportunities

      • 5.2.2. Market size and forecast, by region

      • 5.2.3. Market share analysis by country

    • 5.3. Light Commercial

      • 5.3.1. Key market trends, growth factors and opportunities

      • 5.3.2. Market size and forecast, by region

      • 5.3.3. Market share analysis by country

  • CHAPTER 6: FAN MARKET, BY DISTRIBUTION CHANNEL

    • 6.1. Overview

      • 6.1.1. Market size and forecast

    • 6.2. Multi Brand Store

      • 6.2.1. Key market trends, growth factors and opportunities

      • 6.2.2. Market size and forecast, by region

      • 6.2.3. Market share analysis by country

    • 6.3. Hypermarkets

      • 6.3.1. Key market trends, growth factors and opportunities

      • 6.3.2. Market size and forecast, by region

      • 6.3.3. Market share analysis by country

    • 6.4. Exclusive Store

      • 6.4.1. Key market trends, growth factors and opportunities

      • 6.4.2. Market size and forecast, by region

      • 6.4.3. Market share analysis by country

    • 6.5. Online

      • 6.5.1. Key market trends, growth factors and opportunities

      • 6.5.2. Market size and forecast, by region

      • 6.5.3. Market share analysis by country

    • 6.6. Others

      • 6.6.1. Key market trends, growth factors and opportunities

      • 6.6.2. Market size and forecast, by region

      • 6.6.3. Market share analysis by country

  • CHAPTER 7: FAN MARKET, BY REGION

    • 7.1. Overview

      • 7.1.1. Market size and forecast By Region

    • 7.2. North America

      • 7.2.1. Key trends and opportunities

      • 7.2.2. Market size and forecast, by Product Type

      • 7.2.3. Market size and forecast, by End User

      • 7.2.4. Market size and forecast, by Distribution Channel

      • 7.2.5. Market size and forecast, by country

        • 7.2.5.1. U.S.
          • 7.2.5.1.1. Key market trends, growth factors and opportunities
          • 7.2.5.1.2. Market size and forecast, by Product Type
          • 7.2.5.1.3. Market size and forecast, by End User
          • 7.2.5.1.4. Market size and forecast, by Distribution Channel
        • 7.2.5.2. Canada
          • 7.2.5.2.1. Key market trends, growth factors and opportunities
          • 7.2.5.2.2. Market size and forecast, by Product Type
          • 7.2.5.2.3. Market size and forecast, by End User
          • 7.2.5.2.4. Market size and forecast, by Distribution Channel
        • 7.2.5.3. Mexico
          • 7.2.5.3.1. Key market trends, growth factors and opportunities
          • 7.2.5.3.2. Market size and forecast, by Product Type
          • 7.2.5.3.3. Market size and forecast, by End User
          • 7.2.5.3.4. Market size and forecast, by Distribution Channel
    • 7.3. Europe

      • 7.3.1. Key trends and opportunities

      • 7.3.2. Market size and forecast, by Product Type

      • 7.3.3. Market size and forecast, by End User

      • 7.3.4. Market size and forecast, by Distribution Channel

      • 7.3.5. Market size and forecast, by country

        • 7.3.5.1. Germany
          • 7.3.5.1.1. Key market trends, growth factors and opportunities
          • 7.3.5.1.2. Market size and forecast, by Product Type
          • 7.3.5.1.3. Market size and forecast, by End User
          • 7.3.5.1.4. Market size and forecast, by Distribution Channel
        • 7.3.5.2. France
          • 7.3.5.2.1. Key market trends, growth factors and opportunities
          • 7.3.5.2.2. Market size and forecast, by Product Type
          • 7.3.5.2.3. Market size and forecast, by End User
          • 7.3.5.2.4. Market size and forecast, by Distribution Channel
        • 7.3.5.3. Italy
          • 7.3.5.3.1. Key market trends, growth factors and opportunities
          • 7.3.5.3.2. Market size and forecast, by Product Type
          • 7.3.5.3.3. Market size and forecast, by End User
          • 7.3.5.3.4. Market size and forecast, by Distribution Channel
        • 7.3.5.4. Spain
          • 7.3.5.4.1. Key market trends, growth factors and opportunities
          • 7.3.5.4.2. Market size and forecast, by Product Type
          • 7.3.5.4.3. Market size and forecast, by End User
          • 7.3.5.4.4. Market size and forecast, by Distribution Channel
        • 7.3.5.5. UK
          • 7.3.5.5.1. Key market trends, growth factors and opportunities
          • 7.3.5.5.2. Market size and forecast, by Product Type
          • 7.3.5.5.3. Market size and forecast, by End User
          • 7.3.5.5.4. Market size and forecast, by Distribution Channel
        • 7.3.5.6. Russia
          • 7.3.5.6.1. Key market trends, growth factors and opportunities
          • 7.3.5.6.2. Market size and forecast, by Product Type
          • 7.3.5.6.3. Market size and forecast, by End User
          • 7.3.5.6.4. Market size and forecast, by Distribution Channel
        • 7.3.5.7. Rest of Europe
          • 7.3.5.7.1. Key market trends, growth factors and opportunities
          • 7.3.5.7.2. Market size and forecast, by Product Type
          • 7.3.5.7.3. Market size and forecast, by End User
          • 7.3.5.7.4. Market size and forecast, by Distribution Channel
    • 7.4. Asia-Pacific

      • 7.4.1. Key trends and opportunities

      • 7.4.2. Market size and forecast, by Product Type

      • 7.4.3. Market size and forecast, by End User

      • 7.4.4. Market size and forecast, by Distribution Channel

      • 7.4.5. Market size and forecast, by country

        • 7.4.5.1. China
          • 7.4.5.1.1. Key market trends, growth factors and opportunities
          • 7.4.5.1.2. Market size and forecast, by Product Type
          • 7.4.5.1.3. Market size and forecast, by End User
          • 7.4.5.1.4. Market size and forecast, by Distribution Channel
        • 7.4.5.2. Japan
          • 7.4.5.2.1. Key market trends, growth factors and opportunities
          • 7.4.5.2.2. Market size and forecast, by Product Type
          • 7.4.5.2.3. Market size and forecast, by End User
          • 7.4.5.2.4. Market size and forecast, by Distribution Channel
        • 7.4.5.3. India
          • 7.4.5.3.1. Key market trends, growth factors and opportunities
          • 7.4.5.3.2. Market size and forecast, by Product Type
          • 7.4.5.3.3. Market size and forecast, by End User
          • 7.4.5.3.4. Market size and forecast, by Distribution Channel
        • 7.4.5.4. South Korea
          • 7.4.5.4.1. Key market trends, growth factors and opportunities
          • 7.4.5.4.2. Market size and forecast, by Product Type
          • 7.4.5.4.3. Market size and forecast, by End User
          • 7.4.5.4.4. Market size and forecast, by Distribution Channel
        • 7.4.5.5. Australia
          • 7.4.5.5.1. Key market trends, growth factors and opportunities
          • 7.4.5.5.2. Market size and forecast, by Product Type
          • 7.4.5.5.3. Market size and forecast, by End User
          • 7.4.5.5.4. Market size and forecast, by Distribution Channel
        • 7.4.5.6. Thailand
          • 7.4.5.6.1. Key market trends, growth factors and opportunities
          • 7.4.5.6.2. Market size and forecast, by Product Type
          • 7.4.5.6.3. Market size and forecast, by End User
          • 7.4.5.6.4. Market size and forecast, by Distribution Channel
        • 7.4.5.7. Malaysia
          • 7.4.5.7.1. Key market trends, growth factors and opportunities
          • 7.4.5.7.2. Market size and forecast, by Product Type
          • 7.4.5.7.3. Market size and forecast, by End User
          • 7.4.5.7.4. Market size and forecast, by Distribution Channel
        • 7.4.5.8. Indonesia
          • 7.4.5.8.1. Key market trends, growth factors and opportunities
          • 7.4.5.8.2. Market size and forecast, by Product Type
          • 7.4.5.8.3. Market size and forecast, by End User
          • 7.4.5.8.4. Market size and forecast, by Distribution Channel
        • 7.4.5.9. Rest of Asia-Pacific
          • 7.4.5.9.1. Key market trends, growth factors and opportunities
          • 7.4.5.9.2. Market size and forecast, by Product Type
          • 7.4.5.9.3. Market size and forecast, by End User
          • 7.4.5.9.4. Market size and forecast, by Distribution Channel
    • 7.5. LAMEA

      • 7.5.1. Key trends and opportunities

      • 7.5.2. Market size and forecast, by Product Type

      • 7.5.3. Market size and forecast, by End User

      • 7.5.4. Market size and forecast, by Distribution Channel

      • 7.5.5. Market size and forecast, by country

        • 7.5.5.1. Brazil
          • 7.5.5.1.1. Key market trends, growth factors and opportunities
          • 7.5.5.1.2. Market size and forecast, by Product Type
          • 7.5.5.1.3. Market size and forecast, by End User
          • 7.5.5.1.4. Market size and forecast, by Distribution Channel
        • 7.5.5.2. South Africa,
          • 7.5.5.2.1. Key market trends, growth factors and opportunities
          • 7.5.5.2.2. Market size and forecast, by Product Type
          • 7.5.5.2.3. Market size and forecast, by End User
          • 7.5.5.2.4. Market size and forecast, by Distribution Channel
        • 7.5.5.3. Saudi Arabia
          • 7.5.5.3.1. Key market trends, growth factors and opportunities
          • 7.5.5.3.2. Market size and forecast, by Product Type
          • 7.5.5.3.3. Market size and forecast, by End User
          • 7.5.5.3.4. Market size and forecast, by Distribution Channel
        • 7.5.5.4. UAE
          • 7.5.5.4.1. Key market trends, growth factors and opportunities
          • 7.5.5.4.2. Market size and forecast, by Product Type
          • 7.5.5.4.3. Market size and forecast, by End User
          • 7.5.5.4.4. Market size and forecast, by Distribution Channel
        • 7.5.5.5. Argentina
          • 7.5.5.5.1. Key market trends, growth factors and opportunities
          • 7.5.5.5.2. Market size and forecast, by Product Type
          • 7.5.5.5.3. Market size and forecast, by End User
          • 7.5.5.5.4. Market size and forecast, by Distribution Channel
        • 7.5.5.6. Rest of LAMEA
          • 7.5.5.6.1. Key market trends, growth factors and opportunities
          • 7.5.5.6.2. Market size and forecast, by Product Type
          • 7.5.5.6.3. Market size and forecast, by End User
          • 7.5.5.6.4. Market size and forecast, by Distribution Channel
  • CHAPTER 8: COMPETITIVE LANDSCAPE

    • 8.1. Introduction

    • 8.2. Top winning strategies

    • 8.3. Product Mapping of Top 10 Player

    • 8.4. Competitive Dashboard

    • 8.5. Competitive Heatmap

    • 8.6. Top player positioning, 2021

  • CHAPTER 9: COMPANY PROFILES

    • 9.1. Emerson Electric Co.

      • 9.1.1. Company overview

      • 9.1.2. Key Executives

      • 9.1.3. Company snapshot

      • 9.1.4. Operating business segments

      • 9.1.5. Product portfolio

      • 9.1.6. Business performance

    • 9.2. Crompton Greaves Consumer Electricals Limited

      • 9.2.1. Company overview

      • 9.2.2. Key Executives

      • 9.2.3. Company snapshot

      • 9.2.4. Operating business segments

      • 9.2.5. Product portfolio

      • 9.2.6. Business performance

      • 9.2.7. Key strategic moves and developments

    • 9.3. Hunter Fan Company

      • 9.3.1. Company overview

      • 9.3.2. Key Executives

      • 9.3.3. Company snapshot

      • 9.3.4. Operating business segments

      • 9.3.5. Product portfolio

    • 9.4. Ajanta Electricals

      • 9.4.1. Company overview

      • 9.4.2. Key Executives

      • 9.4.3. Company snapshot

      • 9.4.4. Operating business segments

      • 9.4.5. Product portfolio

    • 9.5. Westinghouse Electric Corporation

      • 9.5.1. Company overview

      • 9.5.2. Key Executives

      • 9.5.3. Company snapshot

      • 9.5.4. Operating business segments

      • 9.5.5. Product portfolio

    • 9.6. Minka Lighting Inc

      • 9.6.1. Company overview

      • 9.6.2. Key Executives

      • 9.6.3. Company snapshot

      • 9.6.4. Operating business segments

      • 9.6.5. Product portfolio

    • 9.7. Panasonic Holdings Corporation

      • 9.7.1. Company overview

      • 9.7.2. Key Executives

      • 9.7.3. Company snapshot

      • 9.7.4. Operating business segments

      • 9.7.5. Product portfolio

      • 9.7.6. Business performance

      • 9.7.7. Key strategic moves and developments

    • 9.8. The Henley Fan Company

      • 9.8.1. Company overview

      • 9.8.2. Key Executives

      • 9.8.3. Company snapshot

      • 9.8.4. Operating business segments

      • 9.8.5. Product portfolio

    • 9.9. Broan-NuTone, LLC

      • 9.9.1. Company overview

      • 9.9.2. Key Executives

      • 9.9.3. Company snapshot

      • 9.9.4. Operating business segments

      • 9.9.5. Product portfolio

      • 9.9.6. Key strategic moves and developments

    • 9.10. Fanimation

      • 9.10.1. Company overview

      • 9.10.2. Key Executives

      • 9.10.3. Company snapshot

      • 9.10.4. Operating business segments

      • 9.10.5. Product portfolio

  • LIST OF TABLES

  • TABLE 01. GLOBAL FAN MARKET, BY PRODUCT TYPE, 2021-2031 ($MILLION)
    TABLE 02. FAN MARKET FOR CEILING FAN, BY REGION, 2021-2031 ($MILLION)
    TABLE 03. FAN MARKET FOR PEDESTAL FAN, BY REGION, 2021-2031 ($MILLION)
    TABLE 04. FAN MARKET FOR TABLE FAN, BY REGION, 2021-2031 ($MILLION)
    TABLE 05. FAN MARKET FOR EXHAUST FAN, BY REGION, 2021-2031 ($MILLION)
    TABLE 06. FAN MARKET FOR WALL FAN, BY REGION, 2021-2031 ($MILLION)
    TABLE 07. FAN MARKET FOR OTHERS, BY REGION, 2021-2031 ($MILLION)
    TABLE 08. GLOBAL FAN MARKET, BY END USER, 2021-2031 ($MILLION)
    TABLE 09. FAN MARKET FOR RESIDENTIAL, BY REGION, 2021-2031 ($MILLION)
    TABLE 10. FAN MARKET FOR LIGHT COMMERCIAL, BY REGION, 2021-2031 ($MILLION)
    TABLE 11. GLOBAL FAN MARKET, BY DISTRIBUTION CHANNEL, 2021-2031 ($MILLION)
    TABLE 12. FAN MARKET FOR MULTI BRAND STORE, BY REGION, 2021-2031 ($MILLION)
    TABLE 13. FAN MARKET FOR HYPERMARKETS, BY REGION, 2021-2031 ($MILLION)
    TABLE 14. FAN MARKET FOR EXCLUSIVE STORE, BY REGION, 2021-2031 ($MILLION)
    TABLE 15. FAN MARKET FOR ONLINE, BY REGION, 2021-2031 ($MILLION)
    TABLE 16. FAN MARKET FOR OTHERS, BY REGION, 2021-2031 ($MILLION)
    TABLE 17. FAN MARKET, BY REGION, 2021-2031 ($MILLION)
    TABLE 18. NORTH AMERICA FAN MARKET, BY PRODUCT TYPE, 2021-2031 ($MILLION)
    TABLE 19. NORTH AMERICA FAN MARKET, BY END USER, 2021-2031 ($MILLION)
    TABLE 20. NORTH AMERICA FAN MARKET, BY DISTRIBUTION CHANNEL, 2021-2031 ($MILLION)
    TABLE 21. NORTH AMERICA FAN MARKET, BY COUNTRY, 2021-2031 ($MILLION)
    TABLE 22. U.S. FAN MARKET, BY PRODUCT TYPE, 2021-2031 ($MILLION)
    TABLE 23. U.S. FAN MARKET, BY END USER, 2021-2031 ($MILLION)
    TABLE 24. U.S. FAN MARKET, BY DISTRIBUTION CHANNEL, 2021-2031 ($MILLION)
    TABLE 25. CANADA FAN MARKET, BY PRODUCT TYPE, 2021-2031 ($MILLION)
    TABLE 26. CANADA FAN MARKET, BY END USER, 2021-2031 ($MILLION)
    TABLE 27. CANADA FAN MARKET, BY DISTRIBUTION CHANNEL, 2021-2031 ($MILLION)
    TABLE 28. MEXICO FAN MARKET, BY PRODUCT TYPE, 2021-2031 ($MILLION)
    TABLE 29. MEXICO FAN MARKET, BY END USER, 2021-2031 ($MILLION)
    TABLE 30. MEXICO FAN MARKET, BY DISTRIBUTION CHANNEL, 2021-2031 ($MILLION)
    TABLE 31. EUROPE FAN MARKET, BY PRODUCT TYPE, 2021-2031 ($MILLION)
    TABLE 32. EUROPE FAN MARKET, BY END USER, 2021-2031 ($MILLION)
    TABLE 33. EUROPE FAN MARKET, BY DISTRIBUTION CHANNEL, 2021-2031 ($MILLION)
    TABLE 34. EUROPE FAN MARKET, BY COUNTRY, 2021-2031 ($MILLION)
    TABLE 35. GERMANY FAN MARKET, BY PRODUCT TYPE, 2021-2031 ($MILLION)
    TABLE 36. GERMANY FAN MARKET, BY END USER, 2021-2031 ($MILLION)
    TABLE 37. GERMANY FAN MARKET, BY DISTRIBUTION CHANNEL, 2021-2031 ($MILLION)
    TABLE 38. FRANCE FAN MARKET, BY PRODUCT TYPE, 2021-2031 ($MILLION)
    TABLE 39. FRANCE FAN MARKET, BY END USER, 2021-2031 ($MILLION)
    TABLE 40. FRANCE FAN MARKET, BY DISTRIBUTION CHANNEL, 2021-2031 ($MILLION)
    TABLE 41. ITALY FAN MARKET, BY PRODUCT TYPE, 2021-2031 ($MILLION)
    TABLE 42. ITALY FAN MARKET, BY END USER, 2021-2031 ($MILLION)
    TABLE 43. ITALY FAN MARKET, BY DISTRIBUTION CHANNEL, 2021-2031 ($MILLION)
    TABLE 44. SPAIN FAN MARKET, BY PRODUCT TYPE, 2021-2031 ($MILLION)
    TABLE 45. SPAIN FAN MARKET, BY END USER, 2021-2031 ($MILLION)
    TABLE 46. SPAIN FAN MARKET, BY DISTRIBUTION CHANNEL, 2021-2031 ($MILLION)
    TABLE 47. UK FAN MARKET, BY PRODUCT TYPE, 2021-2031 ($MILLION)
    TABLE 48. UK FAN MARKET, BY END USER, 2021-2031 ($MILLION)
    TABLE 49. UK FAN MARKET, BY DISTRIBUTION CHANNEL, 2021-2031 ($MILLION)
    TABLE 50. RUSSIA FAN MARKET, BY PRODUCT TYPE, 2021-2031 ($MILLION)
    TABLE 51. RUSSIA FAN MARKET, BY END USER, 2021-2031 ($MILLION)
    TABLE 52. RUSSIA FAN MARKET, BY DISTRIBUTION CHANNEL, 2021-2031 ($MILLION)
    TABLE 53. REST OF EUROPE FAN MARKET, BY PRODUCT TYPE, 2021-2031 ($MILLION)
    TABLE 54. REST OF EUROPE FAN MARKET, BY END USER, 2021-2031 ($MILLION)
    TABLE 55. REST OF EUROPE FAN MARKET, BY DISTRIBUTION CHANNEL, 2021-2031 ($MILLION)
    TABLE 56. ASIA-PACIFIC FAN MARKET, BY PRODUCT TYPE, 2021-2031 ($MILLION)
    TABLE 57. ASIA-PACIFIC FAN MARKET, BY END USER, 2021-2031 ($MILLION)
    TABLE 58. ASIA-PACIFIC FAN MARKET, BY DISTRIBUTION CHANNEL, 2021-2031 ($MILLION)
    TABLE 59. ASIA-PACIFIC FAN MARKET, BY COUNTRY, 2021-2031 ($MILLION)
    TABLE 60. CHINA FAN MARKET, BY PRODUCT TYPE, 2021-2031 ($MILLION)
    TABLE 61. CHINA FAN MARKET, BY END USER, 2021-2031 ($MILLION)
    TABLE 62. CHINA FAN MARKET, BY DISTRIBUTION CHANNEL, 2021-2031 ($MILLION)
    TABLE 63. JAPAN FAN MARKET, BY PRODUCT TYPE, 2021-2031 ($MILLION)
    TABLE 64. JAPAN FAN MARKET, BY END USER, 2021-2031 ($MILLION)
    TABLE 65. JAPAN FAN MARKET, BY DISTRIBUTION CHANNEL, 2021-2031 ($MILLION)
    TABLE 66. INDIA FAN MARKET, BY PRODUCT TYPE, 2021-2031 ($MILLION)
    TABLE 67. INDIA FAN MARKET, BY END USER, 2021-2031 ($MILLION)
    TABLE 68. INDIA FAN MARKET, BY DISTRIBUTION CHANNEL, 2021-2031 ($MILLION)
    TABLE 69. SOUTH KOREA FAN MARKET, BY PRODUCT TYPE, 2021-2031 ($MILLION)
    TABLE 70. SOUTH KOREA FAN MARKET, BY END USER, 2021-2031 ($MILLION)
    TABLE 71. SOUTH KOREA FAN MARKET, BY DISTRIBUTION CHANNEL, 2021-2031 ($MILLION)
    TABLE 72. AUSTRALIA FAN MARKET, BY PRODUCT TYPE, 2021-2031 ($MILLION)
    TABLE 73. AUSTRALIA FAN MARKET, BY END USER, 2021-2031 ($MILLION)
    TABLE 74. AUSTRALIA FAN MARKET, BY DISTRIBUTION CHANNEL, 2021-2031 ($MILLION)
    TABLE 75. THAILAND FAN MARKET, BY PRODUCT TYPE, 2021-2031 ($MILLION)
    TABLE 76. THAILAND FAN MARKET, BY END USER, 2021-2031 ($MILLION)
    TABLE 77. THAILAND FAN MARKET, BY DISTRIBUTION CHANNEL, 2021-2031 ($MILLION)
    TABLE 78. MALAYSIA FAN MARKET, BY PRODUCT TYPE, 2021-2031 ($MILLION)
    TABLE 79. MALAYSIA FAN MARKET, BY END USER, 2021-2031 ($MILLION)
    TABLE 80. MALAYSIA FAN MARKET, BY DISTRIBUTION CHANNEL, 2021-2031 ($MILLION)
    TABLE 81. INDONESIA FAN MARKET, BY PRODUCT TYPE, 2021-2031 ($MILLION)
    TABLE 82. INDONESIA FAN MARKET, BY END USER, 2021-2031 ($MILLION)
    TABLE 83. INDONESIA FAN MARKET, BY DISTRIBUTION CHANNEL, 2021-2031 ($MILLION)
    TABLE 84. REST OF ASIA-PACIFIC FAN MARKET, BY PRODUCT TYPE, 2021-2031 ($MILLION)
    TABLE 85. REST OF ASIA-PACIFIC FAN MARKET, BY END USER, 2021-2031 ($MILLION)
    TABLE 86. REST OF ASIA-PACIFIC FAN MARKET, BY DISTRIBUTION CHANNEL, 2021-2031 ($MILLION)
    TABLE 87. LAMEA FAN MARKET, BY PRODUCT TYPE, 2021-2031 ($MILLION)
    TABLE 88. LAMEA FAN MARKET, BY END USER, 2021-2031 ($MILLION)
    TABLE 89. LAMEA FAN MARKET, BY DISTRIBUTION CHANNEL, 2021-2031 ($MILLION)
    TABLE 90. LAMEA FAN MARKET, BY COUNTRY, 2021-2031 ($MILLION)
    TABLE 91. BRAZIL FAN MARKET, BY PRODUCT TYPE, 2021-2031 ($MILLION)
    TABLE 92. BRAZIL FAN MARKET, BY END USER, 2021-2031 ($MILLION)
    TABLE 93. BRAZIL FAN MARKET, BY DISTRIBUTION CHANNEL, 2021-2031 ($MILLION)
    TABLE 94. SOUTH AFRICA, FAN MARKET, BY PRODUCT TYPE, 2021-2031 ($MILLION)
    TABLE 95. SOUTH AFRICA, FAN MARKET, BY END USER, 2021-2031 ($MILLION)
    TABLE 96. SOUTH AFRICA, FAN MARKET, BY DISTRIBUTION CHANNEL, 2021-2031 ($MILLION)
    TABLE 97. SAUDI ARABIA FAN MARKET, BY PRODUCT TYPE, 2021-2031 ($MILLION)
    TABLE 98. SAUDI ARABIA FAN MARKET, BY END USER, 2021-2031 ($MILLION)
    TABLE 99. SAUDI ARABIA FAN MARKET, BY DISTRIBUTION CHANNEL, 2021-2031 ($MILLION)
    TABLE 100. UAE FAN MARKET, BY PRODUCT TYPE, 2021-2031 ($MILLION)
    TABLE 101. UAE FAN MARKET, BY END USER, 2021-2031 ($MILLION)
    TABLE 102. UAE FAN MARKET, BY DISTRIBUTION CHANNEL, 2021-2031 ($MILLION)
    TABLE 103. ARGENTINA FAN MARKET, BY PRODUCT TYPE, 2021-2031 ($MILLION)
    TABLE 104. ARGENTINA FAN MARKET, BY END USER, 2021-2031 ($MILLION)
    TABLE 105. ARGENTINA FAN MARKET, BY DISTRIBUTION CHANNEL, 2021-2031 ($MILLION)
    TABLE 106. REST OF LAMEA FAN MARKET, BY PRODUCT TYPE, 2021-2031 ($MILLION)
    TABLE 107. REST OF LAMEA FAN MARKET, BY END USER, 2021-2031 ($MILLION)
    TABLE 108. REST OF LAMEA FAN MARKET, BY DISTRIBUTION CHANNEL, 2021-2031 ($MILLION)
    TABLE 109. EMERSON ELECTRIC CO.: KEY EXECUTIVES
    TABLE 110. EMERSON ELECTRIC CO.: COMPANY SNAPSHOT
    TABLE 111. EMERSON ELECTRIC CO.: PRODUCT SEGMENTS
    TABLE 112. EMERSON ELECTRIC CO.: PRODUCT PORTFOLIO
    TABLE 113. CROMPTON GREAVES CONSUMER ELECTRICALS LIMITED: KEY EXECUTIVES
    TABLE 114. CROMPTON GREAVES CONSUMER ELECTRICALS LIMITED: COMPANY SNAPSHOT
    TABLE 115. CROMPTON GREAVES CONSUMER ELECTRICALS LIMITED: PRODUCT SEGMENTS
    TABLE 116. CROMPTON GREAVES CONSUMER ELECTRICALS LIMITED: PRODUCT PORTFOLIO
    TABLE 117. CROMPTON GREAVES CONSUMER ELECTRICALS LIMITED: KEY STRATERGIES
    TABLE 118. HUNTER FAN COMPANY: KEY EXECUTIVES
    TABLE 119. HUNTER FAN COMPANY: COMPANY SNAPSHOT
    TABLE 120. HUNTER FAN COMPANY: PRODUCT SEGMENTS
    TABLE 121. HUNTER FAN COMPANY: PRODUCT PORTFOLIO
    TABLE 122. AJANTA ELECTRICALS: KEY EXECUTIVES
    TABLE 123. AJANTA ELECTRICALS: COMPANY SNAPSHOT
    TABLE 124. AJANTA ELECTRICALS: PRODUCT SEGMENTS
    TABLE 125. AJANTA ELECTRICALS: PRODUCT PORTFOLIO
    TABLE 126. WESTINGHOUSE ELECTRIC CORPORATION: KEY EXECUTIVES
    TABLE 127. WESTINGHOUSE ELECTRIC CORPORATION: COMPANY SNAPSHOT
    TABLE 128. WESTINGHOUSE ELECTRIC CORPORATION: PRODUCT SEGMENTS
    TABLE 129. WESTINGHOUSE ELECTRIC CORPORATION: PRODUCT PORTFOLIO
    TABLE 130. MINKA LIGHTING INC: KEY EXECUTIVES
    TABLE 131. MINKA LIGHTING INC: COMPANY SNAPSHOT
    TABLE 132. MINKA LIGHTING INC: PRODUCT SEGMENTS
    TABLE 133. MINKA LIGHTING INC: PRODUCT PORTFOLIO
    TABLE 134. PANASONIC HOLDINGS CORPORATION: KEY EXECUTIVES
    TABLE 135. PANASONIC HOLDINGS CORPORATION: COMPANY SNAPSHOT
    TABLE 136. PANASONIC HOLDINGS CORPORATION: PRODUCT SEGMENTS
    TABLE 137. PANASONIC HOLDINGS CORPORATION: PRODUCT PORTFOLIO
    TABLE 138. PANASONIC HOLDINGS CORPORATION: KEY STRATERGIES
    TABLE 139. THE HENLEY FAN COMPANY: KEY EXECUTIVES
    TABLE 140. THE HENLEY FAN COMPANY: COMPANY SNAPSHOT
    TABLE 141. THE HENLEY FAN COMPANY: PRODUCT SEGMENTS
    TABLE 142. THE HENLEY FAN COMPANY: PRODUCT PORTFOLIO
    TABLE 143. BROAN-NUTONE, LLC: KEY EXECUTIVES
    TABLE 144. BROAN-NUTONE, LLC: COMPANY SNAPSHOT
    TABLE 145. BROAN-NUTONE, LLC: PRODUCT SEGMENTS
    TABLE 146. BROAN-NUTONE, LLC: PRODUCT PORTFOLIO
    TABLE 147. BROAN-NUTONE, LLC: KEY STRATERGIES
    TABLE 148. FANIMATION: KEY EXECUTIVES
    TABLE 149. FANIMATION: COMPANY SNAPSHOT
    TABLE 150. FANIMATION: PRODUCT SEGMENTS
    TABLE 151. FANIMATION: PRODUCT PORTFOLIO
  • LIST OF FIGURES

  • FIGURE 01. FAN MARKET, 2021-2031
    FIGURE 02. SEGMENTATION OF FAN MARKET, 2021-2031
    FIGURE 03. TOP INVESTMENT POCKETS IN FAN MARKET (2022-2031)
    FIGURE 04. MODERATE BARGAINING POWER OF SUPPLIERS
    FIGURE 05. MODERATE BARGAINING POWER OF BUYERS
    FIGURE 06. LOW THREAT OF SUBSTITUTES
    FIGURE 07. MODERATE THREAT OF NEW ENTRANTS
    FIGURE 08. HIGH INTENSITY OF RIVALRY
    FIGURE 09. DRIVERS, RESTRAINTS AND OPPORTUNITIES: GLOBALFAN MARKET
    FIGURE 10. FAN MARKET, BY PRODUCT TYPE, 2021(%)
    FIGURE 11. COMPARATIVE SHARE ANALYSIS OF FAN MARKET FOR CEILING FAN, BY COUNTRY 2021 AND 2031(%)
    FIGURE 12. COMPARATIVE SHARE ANALYSIS OF FAN MARKET FOR PEDESTAL FAN, BY COUNTRY 2021 AND 2031(%)
    FIGURE 13. COMPARATIVE SHARE ANALYSIS OF FAN MARKET FOR TABLE FAN, BY COUNTRY 2021 AND 2031(%)
    FIGURE 14. COMPARATIVE SHARE ANALYSIS OF FAN MARKET FOR EXHAUST FAN, BY COUNTRY 2021 AND 2031(%)
    FIGURE 15. COMPARATIVE SHARE ANALYSIS OF FAN MARKET FOR WALL FAN, BY COUNTRY 2021 AND 2031(%)
    FIGURE 16. COMPARATIVE SHARE ANALYSIS OF FAN MARKET FOR OTHERS, BY COUNTRY 2021 AND 2031(%)
    FIGURE 17. FAN MARKET, BY END USER, 2021(%)
    FIGURE 18. COMPARATIVE SHARE ANALYSIS OF FAN MARKET FOR RESIDENTIAL, BY COUNTRY 2021 AND 2031(%)
    FIGURE 19. COMPARATIVE SHARE ANALYSIS OF FAN MARKET FOR LIGHT COMMERCIAL, BY COUNTRY 2021 AND 2031(%)
    FIGURE 20. FAN MARKET, BY DISTRIBUTION CHANNEL, 2021(%)
    FIGURE 21. COMPARATIVE SHARE ANALYSIS OF FAN MARKET FOR MULTI BRAND STORE, BY COUNTRY 2021 AND 2031(%)
    FIGURE 22. COMPARATIVE SHARE ANALYSIS OF FAN MARKET FOR HYPERMARKETS, BY COUNTRY 2021 AND 2031(%)
    FIGURE 23. COMPARATIVE SHARE ANALYSIS OF FAN MARKET FOR EXCLUSIVE STORE, BY COUNTRY 2021 AND 2031(%)
    FIGURE 24. COMPARATIVE SHARE ANALYSIS OF FAN MARKET FOR ONLINE, BY COUNTRY 2021 AND 2031(%)
    FIGURE 25. COMPARATIVE SHARE ANALYSIS OF FAN MARKET FOR OTHERS, BY COUNTRY 2021 AND 2031(%)
    FIGURE 26. FAN MARKET BY REGION, 2021
    FIGURE 27. U.S. FAN MARKET, 2021-2031 ($MILLION)
    FIGURE 28. CANADA FAN MARKET, 2021-2031 ($MILLION)
    FIGURE 29. MEXICO FAN MARKET, 2021-2031 ($MILLION)
    FIGURE 30. GERMANY FAN MARKET, 2021-2031 ($MILLION)
    FIGURE 31. FRANCE FAN MARKET, 2021-2031 ($MILLION)
    FIGURE 32. ITALY FAN MARKET, 2021-2031 ($MILLION)
    FIGURE 33. SPAIN FAN MARKET, 2021-2031 ($MILLION)
    FIGURE 34. UK FAN MARKET, 2021-2031 ($MILLION)
    FIGURE 35. RUSSIA FAN MARKET, 2021-2031 ($MILLION)
    FIGURE 36. REST OF EUROPE FAN MARKET, 2021-2031 ($MILLION)
    FIGURE 37. CHINA FAN MARKET, 2021-2031 ($MILLION)
    FIGURE 38. JAPAN FAN MARKET, 2021-2031 ($MILLION)
    FIGURE 39. INDIA FAN MARKET, 2021-2031 ($MILLION)
    FIGURE 40. SOUTH KOREA FAN MARKET, 2021-2031 ($MILLION)
    FIGURE 41. AUSTRALIA FAN MARKET, 2021-2031 ($MILLION)
    FIGURE 42. THAILAND FAN MARKET, 2021-2031 ($MILLION)
    FIGURE 43. MALAYSIA FAN MARKET, 2021-2031 ($MILLION)
    FIGURE 44. INDONESIA FAN MARKET, 2021-2031 ($MILLION)
    FIGURE 45. REST OF ASIA-PACIFIC FAN MARKET, 2021-2031 ($MILLION)
    FIGURE 46. BRAZIL FAN MARKET, 2021-2031 ($MILLION)
    FIGURE 47. SOUTH AFRICA, FAN MARKET, 2021-2031 ($MILLION)
    FIGURE 48. SAUDI ARABIA FAN MARKET, 2021-2031 ($MILLION)
    FIGURE 49. UAE FAN MARKET, 2021-2031 ($MILLION)
    FIGURE 50. ARGENTINA FAN MARKET, 2021-2031 ($MILLION)
    FIGURE 51. REST OF LAMEA FAN MARKET, 2021-2031 ($MILLION)
    FIGURE 52. TOP WINNING STRATEGIES, BY YEAR
    FIGURE 53. TOP WINNING STRATEGIES, BY DEVELOPMENT
    FIGURE 54. TOP WINNING STRATEGIES, BY COMPANY
    FIGURE 55. PRODUCT MAPPING OF TOP 10 PLAYERS
    FIGURE 56. COMPETITIVE DASHBOARD
    FIGURE 57. COMPETITIVE HEATMAP: FAN MARKET
    FIGURE 58. TOP PLAYER POSITIONING, 2021
    FIGURE 59. EMERSON ELECTRIC CO.: NET SALES, 2020-2022 ($MILLION)
    FIGURE 60. EMERSON ELECTRIC CO.: RESEARCH & DEVELOPMENT EXPENDITURE, 2020-2022
    FIGURE 61. EMERSON ELECTRIC CO.: REVENUE SHARE BY SEGMENT, 2021 (%)
    FIGURE 62. EMERSON ELECTRIC CO.: REVENUE SHARE BY REGION, 2021 (%)
    FIGURE 63. CROMPTON GREAVES CONSUMER ELECTRICALS LIMITED: NET REVENUE, 2019-2021 ($MILLION)
    FIGURE 64. CROMPTON GREAVES CONSUMER ELECTRICALS LIMITED: RESEARCH & DEVELOPMENT EXPENDITURE, 2019-2021
    FIGURE 65. CROMPTON GREAVES CONSUMER ELECTRICALS LIMITED: REVENUE SHARE BY SEGMENT, 2021 (%)
    FIGURE 66. PANASONIC HOLDINGS CORPORATION: NET SALES, 2019-2021 ($MILLION)
    FIGURE 67. PANASONIC HOLDINGS CORPORATION: REVENUE SHARE BY SEGMENT, 2021 (%)
    FIGURE 68. PANASONIC HOLDINGS CORPORATION: REVENUE SHARE BY REGION, 2021 (%)


PURCHASE OPTIONS

Call or Email us

U.S.-Canada Toll-free: +1-800-792-5285
Int'l : +1-503-894-6022
Europe : +44-845-528-1300
Email : help@alliedmarketresearch.com
 
FREQUENTLY ASKED QUESTIONS?

A. The global fan market size was valued at $11,117.6 million in 2021 and is projected to reach $16,848.6 million by 2031, registering a CAGR of 4.3% from 2022 to 2031.

A. The fan market is segmented into product type, end user, distribution channel, and region. By product type, the market is divided into ceiling fan, pedestal fan, table fan, exhaust fan, wall fan, and others. By end user, the market is bifurcated into residential and light commercial. By distribution channel, the market is classified into multi brand store, hypermarkets, exclusive store, online, and others. Region-wise, the market is analyzed across North America (the U.S., Canada, and Mexico), Europe (Germany, France, Italy, Spain, UK, Russia, and rest of Europe), Asia-Pacific (China, Japan, India, South Korea, Australia, Thailand, Malaysia, Indonesia, and rest of Asia-Pacific), and LAMEA (Brazil, South Africa, Saudi Arabia, UAE, Argentina, and rest of LAMEA)

A. Asia-Pacific is the largest regional market for fan

A. The major players analyzed for the fan market are Ajanta Electricals, Broan-NuTone, LLC, Crompton Greaves Consumer Electricals Limited, Emerson Electric Co., Fanimation, Hunter Fan Company, Minka Lighting Inc, Panasonic Holdings Corporation, The Henley Fan Company, and Westinghouse Electric Corporation.

A. The global fan market report is available on request on the website of Allied Market Research.

A. The forecast period considered in the global fan market report is from 2022 to 2031. The report analyzes the market sizes from 2022 to 2031 along with the upcoming market trends and opportunities. The report also covers the key strategies adopted by the key players operating in the market.

A. The base year calculated in the fan market report is 2021.

Looking for Customization?

 Customization Request

Have a Question?

 Speak with Analyst

Any Confusion?

 Inquire Before Buying

Have a glance of the Report

  Request Sample
RELATED TAGS

Purchase Full Report of
Fan Market

Start reading instantly.
This Report and over 67,132+ more Reports, Available with Avenue Library. T&C*.

  • Online Only
  • $3,570
  • Online cloud access only
  • Restricted print, copy, paste & download
  • Read only
  • Free industry update
    (Within 180 days)
  • Free report update in next update cycle
    (May 2024 - May 2025)
  • Data Pack
  • $3,840
  • Restricted to one authorized user
  • One print only
  • Available in
    Excel
  • Free industry update
    (Within 180 days)
  •   Free report update in next update cycle
    (May 2024 - May 2025)
  • Single User
  • $5,730
  • Restricted to one authorized user
  • One print only
  • Available in
    PDF
  • Free industry update
    (Within 180 days)
  •   Free report update in next update cycle
    (May 2024 - May 2025)
  • Five Users
  • $6,450
  • Limited to five authorized users
  • Print upto five copies
  • Available in
    PDF
  • Free industry update
    (Within 180 days)
  •   Free report update in next update cycle
    (May 2024 - May 2025)
  • Enterprise
    License/PDF

  • $9,600
  • Unlimited
    within
    company/enterprise
  • Available in Excel & PDF
  • Free industry update
    (Within 180 days)
  •   Free report update in next update cycle
    (May 2024 - May 2025)
  • Library
    Membership

  • $999 $ 1,175
    Per User/ Per month/ Billed annually
  • Published Content
    E-access
  • Company Profiles
    E-access
  • Newly Added Content Access
  • 10 PDF
    Downloads
  • 5 Excel Data
    Pack Downloads
  • 250 Company Profiles PDF Downloads
  • Buy Now

*Taxes/Fees, if applicable will be added during checkout. All prices in USD

RELATED REPORTS
 

Why Allied Market Research?


Infallible Methodology

To ensure high-level data integrity, accurate analysis, and impeccable forecasts

Analyst Support

For complete satisfaction

Customization

On-demand customization of scope of the report to exactly meet your needs

TARGETED MARKET VIEW

Targeted market view to provide pertinent information and save time of readers

Get fresh content delivered

Get insights on topics that are crucial for your business. Stay abreast of your interest areas.

Get Industry Data Alerts

Why Allied Market Research?

Infallible Methodology

To ensure high-level data integrity, accurate analysis, and impeccable forecasts

Analyst Support

For complete satisfaction

Customization

On-demand customization of scope of the report to exactly meet your needs

TARGETED MARKET VIEW

Targeted market view to provide pertinent information and save time of readers