0
2019
Fermenters Market

Fermenters Market

by Process (Batch Fermentation, Continuous Fermentation, and Others), Application (Food, Beverage, Healthcare & Personal Care, and Others), and Mode of Operation (Semi-automatic and Automatic): Global Opportunity Analysis and Industry Forecast, 2018 - 2025

Report Code: A04850
Mar 2019 | Pages: 211
Tables: 110
Charts: 57
  • Formats*:

  • pdf

    Single User License, Five User
    License & Enterprise User License

  • xls

    Data Pack Excel License

  • ppt

    It comes with the additional cost
    of $2500.00 contact sales.


COVID-19

Pandemic disrupted the entire world and affected many industries.

Get detailed COVID-19 impact analysis on the Fermenters Market

Request Now !

Fermenters Market Outlook - 2025

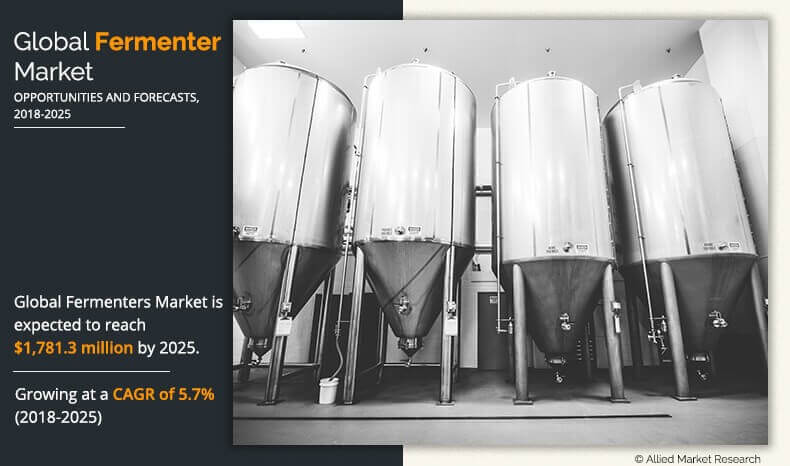
The global fermenters market size was valued at $1,135.5 million in 2017, and is projected to reach $1,781.3 million by 2025, growing at a CAGR of 5.7% from 2018 to 2025.

Fermenters are complex vessels designed to maintain optimum environmental conditions for the growth of microorganisms. Fermenters are cylinder-shaped structures in which biological processes are carried out under a controlled environment. Agitation speed, aeration rate, heating intensity or cooling rate, and nutrients feeding rate play a vital role in fermenters and hence are closely monitored and controlled. The fermenters should be strong and robust enough to withstand the diversified treatment requirements such as exposure to high pressure and heat, withstanding strong chemicals, and washing & cleaning processes.

Stakeholders in the fermenters industry are now massively focusing on customization. In the past few years, upsurge in customization offered to customers have been witnessed. While customization in fermenters helps manufacturers to capture white space opportunities in the market, novel innovations in sensors and actuators technologies have resulted in scale downsize of fermenters, opening new growth avenues for fermenters market. However, factors such as high cost of fermenters and commercial viability of very large-scale fermenters are expected to restrain the global fermenters market growth. In addition, large scale fermenters are often prone to problems in heating, mixing, and essential parameter control such as pH, temperature, humidity, and handling of large volume of liquids and gases. Moreover, designing of large-scale fermenters becomes extremely complicated due to high maintenance costs, initial set up cost, and high lead times, which in turn are anticipated to restrain the market growth.

Due to rise in competition and increase in challenges for organic growth, the fermenters market is expected to witness significant growth with mergers, acquisitions, and partnerships with companies seeking to expand into new markets and differentiate themselves. For examples, Thermo Fisher has acquired bioprocessing equipment maker ASI for $300 million, Pall acquisition of ATMI LifeSciences to name few. Mergers and acquisitions provide opportunities to meet customer demand for quality and productivity along with leveraging global reach to bring innovative products to a larger customer base.

To better understand the fermenters market forecast and opportunities, a comprehensive global analysis based on process, application, and mode of operation has been presented in this report.

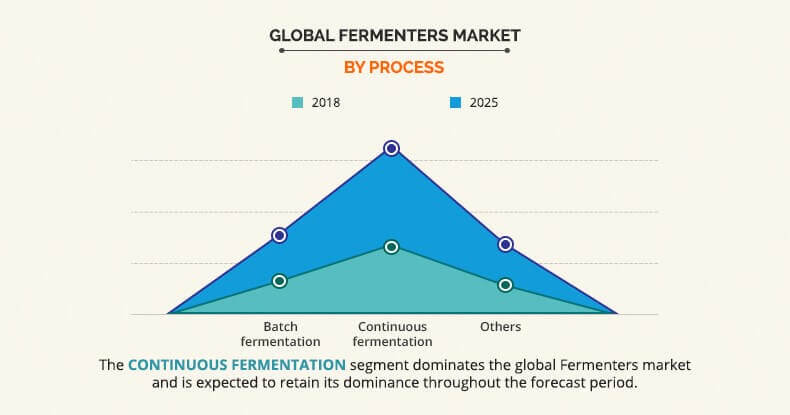
Based on process, the market is segmented into batch fermentation, continuous fermentation, and others. Continues fermentation segment is expected to grow with highest CAGR and is expected to retain its dominance throughout the forecast period due to higher efficacy in growth and production of microbes. Furthermore, turnover rate that is conversion of the substance into desired products is high as compared to its counterparts. In addition, continuous fermenters provide high yield as a result of faster nutrients consumption rate.

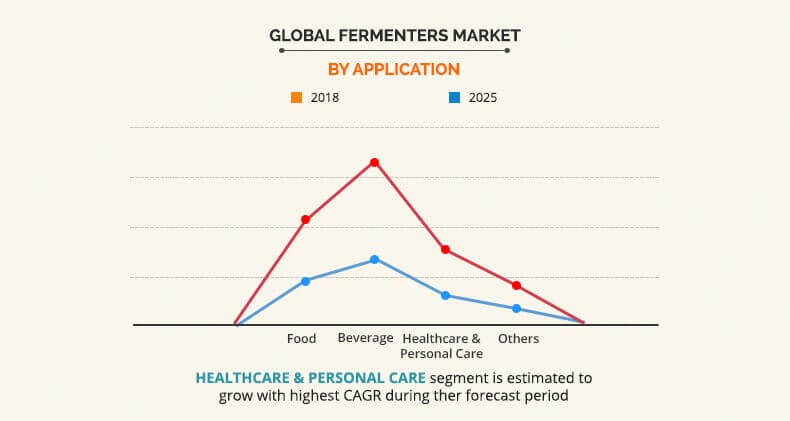
Based on application, the market is divided into food, beverage, healthcare & personal care, and others. The healthcare & personal care segment is expected to witness rapid growth during the forecast period due to increase in demand for active pharmaceutical ingredients and vaccines around the world. Furthermore, rise in demand for antibiotics fuel the demand for fermenters around the world. Increased demand for antibiotics can be attributed to increased consumption of antibiotics in low- & middle-income countries, major investments in R&D activities by pharmaceutical companies, and rise in prevalence of infectious diseases. However, the beverage segment is expected to dominate the global fermenters market share throughout the forecast period.

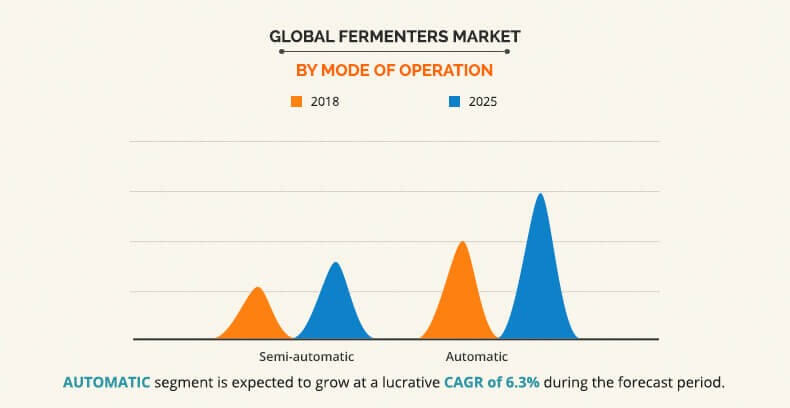
Based on mode of operation, the global fermenters market is bifurcated into semi-automatic and automatic. The automatic segment is poised to grow with higher CAGR during the forecast period, owing to wide acceptance from commercial and industrial application. Furthermore, the automatic fermenters are highly preferred in medium- to high-scale production. In addition, they also allow cost efficacy of batch processing and commercial scalability.

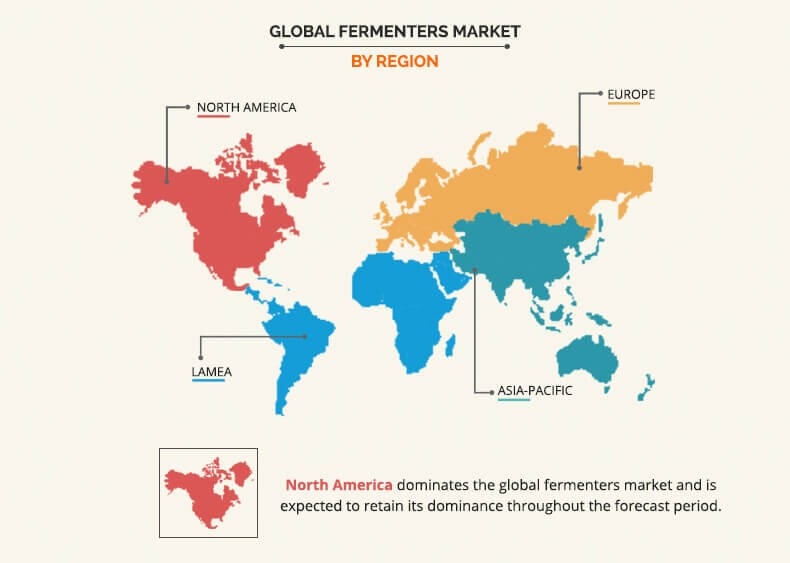
The fermenters market is analyzed across North America, Europe, Asia-Pacific, and LAMEA. North America accounts for the highest market share due to the presence of leading market players in this region. The European market to witnesses sluggish growth, as fermenters market have reached maturity stage in product life cycle. The Asia-Pacific fermenters market is anticipated to witness significant growth in the near future, owing to increase in research and development centers leading to establishment of advanced laboratories, rise in investment of pharmaceutical industry, and increase in demand for alcohol such as beer and wine in the region.

Key players profiled in the report include Eppendorf AG, Sartorius AG, Thermo Fisher Scientific Inc., GEA Group Aktiengesellschaft, General Electric Company, PIERRE GUERIN SAS, CerCell ApS, Electrolab Biotech Ltd, Applikon Biotechnology BV, Bioengineering AG, ZETA Holding GmbH, and BBI-Biotech GmbH

Technological advancements have led to the development of advanced fermenters capable of controlling environment inside fermenter much efficiently and accurately. Furthermore, increase in demand for alcohol in both developing and developed regions is expected to fuel the growth of the fermenters market.

Key Benefits for fermenters market:

  • The report provides an extensive analysis of the current and emerging fermenters market trends and opportunities.
  • The report provides detailed qualitative and quantitative analysis of the current trends and future estimations that help evaluate the prevailing market opportunities.
  • A comprehensive analysis of the factors that drive and restrict the growth of the market is provided in this study.
  • Global fermenters market analysis is conducted by following key product positioning and monitoring the top competitors within the market framework.
  • The report provides extensive qualitative insights on the potential and niche segments or regions exhibiting favorable growth.

Fermenters Market Report Highlights

Aspects Details
By Process
  • Batch Fermentation
  • Continuous Fermentation
  • Others
By Application
  • Food
  • Beverage
  • Healthcare & Personal Care
  • Others
By Mode Of Operation
  • Semi-automatic
  • Automatic
By Region
  • North America  (U.S., Canada, Mexico)
  • Europe  (UK, Germany, France, Spain, Italy, Rest of Europe)
  • Asia-Pacific  (China, Japan, India, Australia, South Korea, Rest of Asia-Pacific)
  • LAMEA  (Latin America, Middle East, Africa)
Key Market Players APPLIKON BIOTECHNOLOGY BV, GENERAL ELECTRIC COMPANY, ELECTROLAB BIOTECH LTD, BBI-BIOTECH GMBH, GEA GROUP AKTIENGESELLSCHAFT, CERCELL APS, EPPENDORF AG, BIOENGINEERING AG, PIERRE GUERIN SAS, SARTORIUS AG, Thermo Fisher Scientific Inc., ZETA Holding GmbH
 

CHAPTER 1:  INTRODUCTION

1.1.REPORT DESCRIPTION
1.2.KEY MARKET SEGMENTS
1.3.KEY BENEFITS
1.4.RESEARCH METHODOLOGY

 1.4.1.Primary research
 1.4.2.Secondary research
 1.4.3.Analyst tools and models

CHAPTER 2:    EXECUTIVE SUMMARY

2.1.CXO PERSPECTIVE

CHAPTER 3:    MARKET LANDSCAPE

3.1.MARKET DEFINITION AND SCOPE
3.2.KEY FINDINGS

 3.2.1.Top investment pockets
 3.2.2.Top winning strategies

3.3.PORTER'S FIVE FORCES ANALYSIS

 3.3.1.Bargaining power of suppliers
 3.3.2.Threat of new entrants
 3.3.3.Threat of substitutes
 3.3.4.Competitive rivalry
 3.3.5.Bargaining power among buyers

3.4.MARKET SHARE ANALYSIS/TOP PLAYER POSITIONING
3.5.MARKET DYNAMICS

3.5.1. Drivers
3.5.2. Restraints
3.5.3. Opportunities

CHAPTER 4:FERMENTERS MARKET BY PROCESS

4.1.OVERVIEW
4.2. BATCH FERMENTATION

 4.2.1.Key market trends, Growth factors and opportunities
 4.2.2.Market size and forecast by region
 4.2.3.Market analysis by country

4.3. CONTINUOUS FERMENTATION

 4.3.1.Key market trends, Growth factors and opportunities
 4.3.2.Market size and forecast by region
 4.3.3.Market analysis by country

4.4. OTHERS

 4.4.1.Key market trends, Growth factors and opportunities
 4.4.2.Market size and forecast by region
 4.4.3.Market analysis by country

CHAPTER 5:FERMENTERS MARKET BY APPLICATION

5.1.OVERVIEW
5.2. FOOD

 5.2.1.Key market trends, Growth factors and opportunities
 5.2.2.Market size and forecast by region
 5.2.3.Market analysis by country

5.3. BEVERAGE

 5.3.1.Key market trends, Growth factors and opportunities
 5.3.2.Market size and forecast by region
 5.3.3.Market analysis by country

5.4. HEALTHCARE AND PERSONAL CARE

 5.4.1.Key market trends, Growth factors and opportunities
 5.4.2.Market size and forecast by region
 5.4.3.Market analysis by country

5.5. OTHERS

 5.5.1.Key market trends, Growth factors and opportunities
 5.5.2.Market size and forecast by region
 5.5.3.Market analysis by country

CHAPTER 6:FERMENTERS MARKET BY MODE OF OPERATION

6.1.OVERVIEW
6.2. SEMI-AUTOMATIC

 6.2.1.Key market trends, Growth factors and opportunities
 6.2.2.Market size and forecast by region
 6.2.3.Market analysis by country

6.3. AUTOMATIC

 6.3.1.Key market trends, Growth factors and opportunities
 6.3.2.Market size and forecast by region
 6.3.3.Market analysis by country

CHAPTER 7:    FERMENTERS MARKET BY REGION

7.1.OVERVIEW
7.2.NORTH AMERICA

7.2.1.Key market trends and opportunities
7.2.2.Market size and forecast by Process
7.2.3.Market size and forecast by Application
7.2.4.Market size and forecast by Mode of operation
7.2.5.Market size and forecast by Country
7.2.6.US FERMENTERS MARKET

7.2.6.1.Market size and forecast by Process
7.2.6.2.Market size and forecast by Application
7.2.6.3.Market size and forecast by Mode of operation

7.2.7.CANADA FERMENTERS MARKET

7.2.7.1.Market size and forecast by Process
7.2.7.2.Market size and forecast by Application
7.2.7.3.Market size and forecast by Mode of operation

7.2.8.MEXICO FERMENTERS MARKET

7.2.8.1.Market size and forecast by Process
7.2.8.2.Market size and forecast by Application
7.2.8.3.Market size and forecast by Mode of operation

7.3.EUROPE

7.3.1.Key market trends and opportunities
7.3.2.Market size and forecast by Process
7.3.3.Market size and forecast by Application
7.3.4.Market size and forecast by Mode of operation
7.3.5.Market size and forecast by Country
7.3.6.UK FERMENTERS MARKET

7.3.6.1.Market size and forecast by Process
7.3.6.2.Market size and forecast by Application
7.3.6.3.Market size and forecast by Mode of operation

7.3.7.GERMANY FERMENTERS MARKET

7.3.7.1.Market size and forecast by Process
7.3.7.2.Market size and forecast by Application
7.3.7.3.Market size and forecast by Mode of operation

7.3.8.FRANCE FERMENTERS MARKET

7.3.8.1.Market size and forecast by Process
7.3.8.2.Market size and forecast by Application
7.3.8.3.Market size and forecast by Mode of operation

7.3.9.SPAIN FERMENTERS MARKET

7.3.9.1.Market size and forecast by Process
7.3.9.2.Market size and forecast by Application
7.3.9.3.Market size and forecast by Mode of operation

7.3.10.ITALY FERMENTERS MARKET

7.3.10.1.Market size and forecast by Process
7.3.10.2.Market size and forecast by Application
7.3.10.3.Market size and forecast by Mode of operation

7.3.11.REST OF EUROPE FERMENTERS MARKET

7.3.11.1.Market size and forecast by Process
7.3.11.2.Market size and forecast by Application
7.3.11.3.Market size and forecast by Mode of operation

7.4.ASIA PACIFIC

7.4.1.Key market trends and opportunities
7.4.2.Market size and forecast by Process
7.4.3.Market size and forecast by Application
7.4.4.Market size and forecast by Mode of operation
7.4.5.Market size and forecast by Country
7.4.6.CHINA FERMENTERS MARKET

7.4.6.1.Market size and forecast by Process
7.4.6.2.Market size and forecast by Application
7.4.6.3.Market size and forecast by Mode of operation

7.4.7.JAPAN FERMENTERS MARKET

7.4.7.1.Market size and forecast by Process
7.4.7.2.Market size and forecast by Application
7.4.7.3.Market size and forecast by Mode of operation

7.4.8.INDIA FERMENTERS MARKET

7.4.8.1.Market size and forecast by Process
7.4.8.2.Market size and forecast by Application
7.4.8.3.Market size and forecast by Mode of operation

7.4.9.AUSTRALIA FERMENTERS MARKET

7.4.9.1.Market size and forecast by Process
7.4.9.2.Market size and forecast by Application
7.4.9.3.Market size and forecast by Mode of operation

7.4.10.SOUTH KOREA FERMENTERS MARKET

7.4.10.1.Market size and forecast by Process
7.4.10.2.Market size and forecast by Application
7.4.10.3.Market size and forecast by Mode of operation

7.4.11.REST OF ASIA PACIFIC FERMENTERS MARKET

7.4.11.1.Market size and forecast by Process
7.4.11.2.Market size and forecast by Application
7.4.11.3.Market size and forecast by Mode of operation

7.5.LAMEA

7.5.1.Key market trends and opportunities
7.5.2.Market size and forecast by Process
7.5.3.Market size and forecast by Application
7.5.4.Market size and forecast by Mode of operation
7.5.5.Market size and forecast by Country
7.5.6.LATIN AMERICA FERMENTERS MARKET

7.5.6.1.Market size and forecast by Process
7.5.6.2.Market size and forecast by Application
7.5.6.3.Market size and forecast by Mode of operation

7.5.7.MIDDLE EAST FERMENTERS MARKET

7.5.7.1.Market size and forecast by Process
7.5.7.2.Market size and forecast by Application
7.5.7.3.Market size and forecast by Mode of operation

7.5.8.AFRICA FERMENTERS MARKET

7.5.8.1.Market size and forecast by Process
7.5.8.2.Market size and forecast by Application
7.5.8.3.Market size and forecast by Mode of operation

CHAPTER 8:    COMPANY PROFILES

8.1. APPLIKON BIOTECHNOLOGY BV

8.1.1.Company overview
8.1.2.Business performance
8.1.3.Key strategic moves and developments

8.2. BBI-BIOTECH GMBH

8.2.1.Company overview
8.2.2.Business performance
8.2.3.Key strategic moves and developments

8.3. BIOENGINEERING AG

8.3.1.Company overview
8.3.2.Business performance
8.3.3.Key strategic moves and developments

8.4. CERCELL APS

8.4.1.Company overview
8.4.2.Business performance
8.4.3.Key strategic moves and developments

8.5. ELECTROLAB BIOTECH LTD

8.5.1.Company overview
8.5.2.Business performance
8.5.3.Key strategic moves and developments

8.6. EPPENDORF AG

8.6.1.Company overview
8.6.2.Business performance
8.6.3.Key strategic moves and developments

8.7. GEA GROUP AKTIENGESELLSCHAFT

8.7.1.Company overview
8.7.2.Business performance
8.7.3.Key strategic moves and developments

8.8. GENERAL ELECTRIC COMPANY

8.8.1.Company overview
8.8.2.Business performance
8.8.3.Key strategic moves and developments

8.9. PIERRE GUERIN SAS

8.9.1.Company overview
8.9.2.Business performance
8.9.3.Key strategic moves and developments

8.10. SARTORIUS AG

8.10.1.Company overview
8.10.2.Business performance
8.10.3.Key strategic moves and developments

8.11. Thermo Fisher Scientific Inc.

8.9.1.Company overview
8.9.2.Business performance
8.9.3.Key strategic moves and developments

8.12. ZETA Holding GmbH

8.10.1.Company overview
8.10.2.Business performance
8.10.3.Key strategic moves and developments

LIST OF TABLES

TABLE 01. GLOBAL FERMENTERS MARKET, BY PROCESS, 2017–2025 ($MILLION)
TABLE 02. BATCH FERMENTERS MARKET, BY REGION, 2017–2025 ($MILLION)
TABLE 03. CONTINUOUS FERMENTERS MARKET, BY REGION, 2017–2025 ($MILLION)
TABLE 04. OTHER FERMENTERS MARKET, BY REGION, 2017–2025 ($MILLION)
TABLE 05. GLOBAL FERMENTERS MARKET, BY APPLICATION, 2017–2025 ($MILLION)
TABLE 06. FERMENTERS MARKET FOR FOOD SEGMENT, BY REGION, 2017–2025 ($MILLION)
TABLE 07. FERMENTERS MARKET FOR BEVERAGE SEGMENT, BY REGION, 2017–2025 ($MILLION)
TABLE 08. FERMENTERS MARKET FOR HEALTHCARE & PERSONAL CARE SEGMENT, BY REGION, 2017–2025 ($MILLION)
TABLE 09. FERMENTERS MARKET FOR OTHERS SEGMENT, BY REGION, 2017–2025 ($MILLION)
TABLE 10. GLOBAL FERMENTERS MARKET, BY MODE OF OPERATION, 2017–2025 ($MILLION)
TABLE 11. SEMI-AUTOMATIC FERMENTERS MARKET, BY REGION, 2017–2025 ($MILLION)
TABLE 12. AUTOMATIC FERMENTERS MARKET, BY REGION, 2017–2025 ($MILLION)
TABLE 13. FERMENTERS MARKET, BY REGION, 2017–2025 ($MILLION)
TABLE 14. NORTH AMERICA FERMENTERS MARKET, BY PROCESS, 2017–2025 ($MILLION)
TABLE 15. NORTH AMERICA FERMENTERS MARKET, BY APPLICATION, 2017–2025 ($MILLION)
TABLE 16. NORTH AMERICA FERMENTERS MARKET, BY APPLICATION, 2017–2025 ($MILLION)
TABLE 17. NORTH AMERICA FERMENTERS MARKET, BY COUNTRY, 2017–2025 ($MILLION)
TABLE 18. U.S. FERMENTERS MARKET, BY PROCESS, 2017–2025 ($MILLION)
TABLE 19. U.S. FERMENTERS MARKET, BY APPLICATION, 2017–2025 ($MILLION)
TABLE 20. U.S. FERMENTERS MARKET, BY MODE OF OPERATION, 2017–2025 ($MILLION)
TABLE 21. CANADA FERMENTERS MARKET, BY PROCESS, 2017–2025 ($MILLION)
TABLE 22. CANADA FERMENTERS MARKET, BY APPLICATION, 2017–2025 ($MILLION)
TABLE 23. CANADA FERMENTERS MARKET, BY MODE OF OPERATION, 2017–2025 ($MILLION)
TABLE 24. MEXICO FERMENTERS MARKET, BY PROCESS, 2017–2025 ($MILLION)
TABLE 25. MEXICO FERMENTERS MARKET, BY APPLICATION, 2017–2025 ($MILLION)
TABLE 26. MEXICO FERMENTERS MARKET, BY MODE OF OPERATION, 2017–2025 ($MILLION)
TABLE 27. EUROPE FERMENTERS MARKET, BY PROCESS, 2017–2025 ($MILLION)
TABLE 28. EUROPE FERMENTERS MARKET, BY APPLICATION, 2017–2025 ($MILLION)
TABLE 29. EUROPE FERMENTERS MARKET, BY MODE OF OPERATION, 2017–2025 ($MILLION)
TABLE 30. EUROPE FERMENTERS MARKET, BY MODE OF OPERATION, 2017–2025 ($MILLION)
TABLE 31. EUROPE FERMENTERS MARKET, BY COUNTRY, 2017–2025 ($MILLION)
TABLE 32. UK FERMENTERS MARKET, BY PROCESS, 2017–2025 ($MILLION)
TABLE 33. UK FERMENTERS MARKET, BY APPLICATION, 2017–2025 ($MILLION)
TABLE 34. UK FERMENTERS MARKET, BY MODE OF OPERATION, 2017–2025 ($MILLION)
TABLE 35. GERMANY FERMENTERS MARKET, BY PROCESS, 2017–2025 ($MILLION)
TABLE 36. GERMANY FERMENTERS MARKET, BY APPLICATION, 2017–2025 ($MILLION)
TABLE 37. GERMANY FERMENTERS MARKET, BY MODE OF OPERATION, 2017–2025 ($MILLION)
TABLE 38. FRANCE FERMENTERS MARKET, BY PROCESS, 2017–2025 ($MILLION)
TABLE 39. FRANCE FERMENTERS MARKET, BY APPLICATION, 2017–2025 ($MILLION)
TABLE 40. FRANCE FERMENTERS MARKET, BY MODE OF OPERATION, 2017–2025 ($MILLION)
TABLE 41. SPAIN FERMENTERS MARKET, BY PROCESS, 2017–2025 ($MILLION)
TABLE 42. SPAIN FERMENTERS MARKET, BY APPLICATION, 2017–2025 ($MILLION)
TABLE 43. SPAIN FERMENTERS MARKET, BY MODE OF OPERATION, 2017–2025 ($MILLION)
TABLE 44. ITALY FERMENTERS MARKET, BY PROCESS, 2017–2025 ($MILLION)
TABLE 45. ITALY FERMENTERS MARKET, BY APPLICATION, 2017–2025 ($MILLION)
TABLE 46. ITALY FERMENTERS MARKET, BY MODE OF OPERATION, 2017–2025 ($MILLION)
TABLE 47. REST OF EUROPE FERMENTERS MARKET, BY PROCESS, 2017–2025 ($MILLION)
TABLE 48. REST OF EUROPE FERMENTERS MARKET, BY APPLICATION, 2017–2025 ($MILLION)
TABLE 49. REST OF EUROPE FERMENTERS MARKET, BY MODE OF OPERATION, 2017–2025 ($MILLION)
TABLE 50. ASIA PACIFIC FERMENTERS MARKET, BY PROCESS, 2017–2025 ($MILLION)
TABLE 51. ASIA PACIFIC FERMENTERS MARKET, BY APPLICATION, 2017–2025 ($MILLION)
TABLE 52. ASIA PACIFIC FERMENTERS MARKET, BY MODE OF OPERATION, 2017–2025 ($MILLION)
TABLE 53. ASIA PACIFIC FERMENTERS MARKET, BY COUNTRY, 2017–2025 ($MILLION)
TABLE 54. CHINA FERMENTERS MARKET, BY PROCESS, 2017–2025 ($MILLION)
TABLE 55. CHINA FERMENTERS MARKET, BY APPLICATION, 2017–2025 ($MILLION)
TABLE 56. CHINA FERMENTERS MARKET, BY MODE OF OPERATION, 2017–2025 ($MILLION)
TABLE 57. JAPAN FERMENTERS MARKET, BY PROCESS, 2017–2025 ($MILLION)
TABLE 58. JAPAN FERMENTERS MARKET, BY APPLICATION, 2017–2025 ($MILLION)
TABLE 59. JAPAN FERMENTERS MARKET, BY MODE OF OPERATION, 2017–2025 ($MILLION)
TABLE 60. INDIA FERMENTERS MARKET, BY PROCESS, 2017–2025 ($MILLION)
TABLE 61. INDIA FERMENTERS MARKET, BY APPLICATION, 2017–2025 ($MILLION)
TABLE 62. INDIA FERMENTERS MARKET, BY MODE OF OPERATION, 2017–2025 ($MILLION)
TABLE 63. AUSTRALIA FERMENTERS MARKET, BY PROCESS, 2017–2025 ($MILLION)
TABLE 64. AUSTRALIA FERMENTERS MARKET, BY APPLICATION, 2017–2025 ($MILLION)
TABLE 65. AUSTRALIA FERMENTERS MARKET, BY MODE OF OPERATION, 2017–2025 ($MILLION)
TABLE 66. SOUTH KOREA FERMENTERS MARKET, BY PROCESS, 2017–2025 ($MILLION)
TABLE 67. SOUTH KOREA FERMENTERS MARKET, BY APPLICATION, 2017–2025 ($MILLION)
TABLE 68. SOUTH KOREA FERMENTERS MARKET, BY MODE OF OPERATION, 2017–2025 ($MILLION)
TABLE 69. REST OF ASIA-PACIFIC FERMENTERS MARKET, BY PROCESS, 2017–2025 ($MILLION)
TABLE 70. REST OF ASIA-PACIFIC FERMENTERS MARKET, BY APPLICATION, 2017–2025 ($MILLION)
TABLE 71. REST OF ASIA-PACIFIC FERMENTERS MARKET, BY MODE OF OPERATION, 2017–2025 ($MILLION)
TABLE 72. LAMEA FERMENTERS MARKET, BY PROCESS, 2017–2025 ($MILLION)
TABLE 73. LAMEA FERMENTERS MARKET, BY APPLICATION, 2017–2025 ($MILLION)
TABLE 74. LAMEA FERMENTERS MARKET, BY MODE OF OPERATION, 2017–2025 ($MILLION)
TABLE 75. LAMEA FERMENTERS MARKET, BY COUNTRY, 2017–2025 ($MILLION)
TABLE 76. LATIN AMERICA FERMENTERS MARKET, BY PROCESS, 2017–2025 ($MILLION)
TABLE 77. LATIN AMERICA FERMENTERS MARKET, BY APPLICATION, 2017–2025 ($MILLION)
TABLE 78. LATIN AMERICA FERMENTERS MARKET, BY MODE OF OPERATION, 2017–2025 ($MILLION)
TABLE 79. MIDDLE EAST FERMENTERS MARKET, BY PROCESS, 2017–2025 ($MILLION)
TABLE 80. MIDDLE EAST FERMENTERS MARKET, BY APPLICATION, 2017–2025 ($MILLION)
TABLE 81. MIDDLE EAST FERMENTERS MARKET, BY MODE OF OPERATION, 2017–2025 ($MILLION)
TABLE 82. AFRICA FERMENTERS MARKET, BY PROCESS, 2017–2025 ($MILLION)
TABLE 83. AFRICA FERMENTERS MARKET, BY APPLICATION, 2017–2025 ($MILLION)
TABLE 84. AFRICA FERMENTERS MARKET, BY MODE OF OPERATION, 2017–2025 ($MILLION)
TABLE 85. APPLIKON BIOTECHNOLOGY BV: COMPANY SNAPSHOT
TABLE 86. APPLIKON BIOTECHNOLOGY BV: PRODUCT PORTFOLIO
TABLE 87. BBI-BIOTECH GMBH: COMPANY SNAPSHOT
TABLE 88. BBI-BIOTECH GMBH: PRODUCT PORTFOLIO
TABLE 89. BIOENGINEERING AG: COMPANY SNAPSHOT
TABLE 90. CERCELL APS: COMPANY SNAPSHOT
TABLE 91. CERCELL APS: PRODUCT PORTFOLIO
TABLE 92. ELECTROLAB BIOTECH LTD.: COMPANY SNAPSHOT
TABLE 93. ELECTROLAB BIOTECH LTD.: PRODUCT PORTFOLIO
TABLE 94. EPPENDORF AG: COMPANY SNAPSHOT
TABLE 95. EPPENDORF AG: PRODUCT PORTFOLIO
TABLE 96. GEA GROUP AKTIENGESELLSCHAFT: COMPANY SNAPSHOT
TABLE 97. GEA GROUP AKTIENGESELLSCHAFT: OPERATING SEGMENTS
TABLE 98. GEA GROUP AKTIENGESELLSCHAFT: PRODUCT PORTFOLIO
TABLE 99. GENERAL ELECTRIC COMPANY: COMPANY SNAPSHOT
TABLE 100. GENERAL ELECTRIC COMPANY: OPERATING SEGMENTS
TABLE 101. GEA GROUP AKTIENGESELLSCHAFT: PRODUCT PORTFOLIO
TABLE 102. PIERRE GUERIN SAS: COMPANY SNAPSHOT
TABLE 103. PIERRE GUERIN SAS: PRODUCT PORTFOLIO
TABLE 104. SARTORIUS AG: COMPANY SNAPSHOT
TABLE 105. SARTORIUS AG: OPERATING SEGMENTS
TABLE 106. SARTORIUS AG: PRODUCT PORTFOLIO
TABLE 107. THERMO FISHER SCIENTIFIC INC.: COMPANY SNAPSHOT
TABLE 108. THERMO FISHER SCIENTIFIC INC.: PRODUCT PORTFOLIO
TABLE 109. ZETA HOLDING GMBH: COMPANY SNAPSHOT
TABLE 110. ZETA HOLDING GMBH: PRODUCT PORTFOLIO

LIST OF FIGURES

FIGURE 01. KEY MARKET SEGMENTS
FIGURE 02. GLOBAL FERMENTERS MARKET SNAPSHOT
FIGURE 03. TOP INVESTMENT POCKETS
FIGURE 04. TOP WINNING STRATEGIES, BY YEAR, 2015–2018*
FIGURE 05. TOP WINNING STRATEGIES, BY DEVELOPMENT, 2015–2018* (%)
FIGURE 06. TOP WINNING STRATEGIES, BY COMPANY, 2015–2018*
FIGURE 07. MODERATE BARGAINING POWER OF SUPPLIERS
FIGURE 08. MODERATE BARGAINING POWER OF BUYERS
FIGURE 09. LOW THREAT OF SUBSTITUTION
FIGURE 10. MODERATE THREAT OF NEW ENTRANTS
FIGURE 11. HIGH INTENSITY OF COMPETITIVE RIVALRY
FIGURE 12. TOP PLAYER POSITIONING
FIGURE 13. GLOBAL FERMENTERS MARKET SHARE, BY PROCESS, 2017(%)
FIGURE 14. COMPARATIVE SHARE ANALYSIS OF BATCH FERMENTERS MARKET, BY COUNTRY, 2017 & 2025 (%)
FIGURE 15. COMPARATIVE SHARE ANALYSIS OF CONTINUOUS FERMENTERS MARKET, BY COUNTRY, 2017 & 2025 (%)
FIGURE 16. COMPARATIVE SHARE ANALYSIS OF OTHER FERMENTERS MARKET, BY COUNTRY, 2017 & 2025 (%)
FIGURE 17. GLOBAL FERMENTERS MARKET SHARE, BY APPLICATION, 2017(%)
FIGURE 18. COMPARATIVE SHARE ANALYSIS OF FERMENTERS MARKET FOR FOOD SEGMENT, BY COUNTRY, 2017 & 2025 (%)
FIGURE 19. COMPARATIVE SHARE ANALYSIS OF FERMENTERS MARKET FOR BEVERAGE SEGMENT, BY COUNTRY, 2017 & 2025 (%)
FIGURE 20. COMPARATIVE SHARE ANALYSIS OF FERMENTERS MARKET FOR HEALTHCARE & PERSONAL CARE, BY COUNTRY, 2017 & 2025 (%)
FIGURE 21. COMPARATIVE SHARE ANALYSIS OF FERMENTERS MARKET FOR OTHERS SEGMENT, BY COUNTRY, 2017 & 2025 (%)
FIGURE 22. GLOBAL FERMENTERS MARKET SHARE, BY MODE OF OPERATION, 2017(%)
FIGURE 23. COMPARATIVE SHARE ANALYSIS OF SEMI-AUTOMATIC FERMENTERS MARKET, BY COUNTRY, 2017 & 2025 (%)
FIGURE 24. COMPARATIVE SHARE ANALYSIS OF AUTOMATIC FERMENTERS MARKET, BY COUNTRY, 2017 & 2025 (%)
FIGURE 25. FERMENTERS MARKET SHARE, BY REGION, 2017(%)
FIGURE 26. U.S. FERMENTERS MARKET, 2017–2025 ($MILLION)
FIGURE 27. CANADA FERMENTERS MARKET, 2017–2025 ($MILLION)
FIGURE 28. MEXICO FERMENTERS MARKET, 2017–2025 ($MILLION)
FIGURE 29. UK FERMENTERS MARKET, 2017–2025 ($MILLION)
FIGURE 30. GERMANY FERMENTERS MARKET, 2017–2025 ($MILLION)
FIGURE 31. FRANCE FERMENTERS MARKET, 2017–2025 ($MILLION)
FIGURE 32. SPAIN FERMENTERS MARKET, 2017–2025 ($MILLION)
FIGURE 33. ITALY FERMENTERS MARKET, 2017–2025 ($MILLION)
FIGURE 34. REST OF EUROPE FERMENTERS MARKET, 2017–2025 ($MILLION)
FIGURE 35. CHINA FERMENTERS MARKET, 2017–2025 ($MILLION)
FIGURE 36. JAPAN FERMENTERS MARKET, 2017–2025 ($MILLION)
FIGURE 37. INDIA FERMENTERS MARKET, 2017–2025 ($MILLION)
FIGURE 38. AUSTRALIA FERMENTERS MARKET, 2017–2025 ($MILLION)
FIGURE 39. SOUTH KOREA FERMENTERS MARKET, 2017–2025 ($MILLION)
FIGURE 40. REST OF ASIA-PACIFIC FERMENTERS MARKET, 2017–2025 ($MILLION)
FIGURE 41. LATIN AMERICA FERMENTERS MARKET, 2017–2025 ($MILLION)
FIGURE 42. MIDDLE EAST FERMENTERS MARKET, 2017–2025 ($MILLION)
FIGURE 43. AFRICA FERMENTERS MARKET, 2017–2025 ($MILLION)
FIGURE 44. EPPENDORF AG: NET SALES, 2015–2017 ($MILLION)
FIGURE 45. EPPENDORF AG: REVENUE SHARE BY REGION, 2017 (%)
FIGURE 46. GEA GROUP AKTIENGESELLSCHAFT: NET SALES, 2015–2017 ($MILLION)
FIGURE 47. GEA GROUP AKTIENGESELLSCHAFT: REVENUE SHARE BY SEGMENT, 2017 (%)
FIGURE 48. GEA GROUP AKTIENGESELLSCHAFT: REVENUE SHARE BY REGION, 2017 (%)
FIGURE 49. GENERAL ELECTRIC COMPANY: NET SALES, 2015–2017 ($MILLION)
FIGURE 50. GENERAL ELECTRIC COMPANY: REVENUE SHARE BY SEGMENT, 2017 (%)
FIGURE 51. GENERAL ELECTRIC COMPANY: REVENUE SHARE BY REGION, 2017 (%)
FIGURE 52. EPPENDORF AG: NET SALES, 2015–2017 ($MILLION)
FIGURE 53. SARTORIUS AG: REVENUE SHARE BY SEGMENT, 2017 (%)
FIGURE 54. SARTORIUS AG: REVENUE SHARE BY REGION, 2017 (%)
FIGURE 55. THERMO FISHER SCIENTIFIC INC.: NET SALES, 2015–2017 ($MILLION)
FIGURE 56. THERMO FISHER SCIENTIFIC INC.: REVENUE SHARE BY SEGMENT, 2017 (%)
FIGURE 57. THERMO FISHER SCIENTIFIC INC.: REVENUE SHARE BY REGION, 2017 (%)


Fermenters are complex vessels designed to maintain optimum environmental conditions for the growth of microorganisms. Fermenters are used for supporting microorganisms during fermentation process. The size of fermenters ranges from milliliters to cubic meters and are generally made up of stainless steel or glass. The operation and design of fermenter mainly depend on the organism used for fermentation and optimum conditions required for the desired product formation. The fermenters market is still in growth stage in developing regions, and is expected to witness significant growth in the coming years, owing to the fact that the developing regions are now shifting their focus toward more sustainable solutions like biofuels. In addition, increased R&D in the said the developing regions is further expected to increase the demand for fermenters.

Moreover, LAMEA and Asia-Pacific are anticipated to register significant growth as compared to the saturated markets of Europe and North America due to growth in the pharmaceutical industry in the region, easing regulations and increased foreign direct investment in the region.

Furthermore, in order to strengthen global as well as regional market position leading stakeholders in the global market are venture in acquisition and partnerships. Acquisition opens up a great opportunity to meet customer demand for quality and productivity along with leveraging global reach to bring innovative products to a larger customer base.

PURCHASE OPTIONS

Call or Email us

U.S.-Canada Toll-free: +1-800-792-5285
Int'l : +1-503-894-6022
Europe : +44-845-528-1300
Email : help@alliedmarketresearch.com

Looking for Customization?

 Customization Request

Have a Question?

 Speak with Analyst

Any Confusion?

 Inquire Before Buying

Have a glance of the Report

  Request Sample

Purchase Full Report of
Fermenters Market

Start reading instantly.
This Report and over 66,944+ more Reports, Available with Avenue Library. T&C*.

  • Online Only
  • $3,456
  • Online cloud access only
  • Restricted print, copy, paste & download
  • Read only
  • Free industry update
    (Within 180 days)
  • Free report update in next update cycle
    (Mar 2020 - Mar 2021)
  • Data Pack
  • $3,840
  • Restricted to one authorized user
  • One print only
  • Available in
    Excel
  • Free industry update
    (Within 180 days)
  •   Free report update in next update cycle
    (Mar 2020 - Mar 2021)
  • Single User
  • $5,769
  • Restricted to one authorized user
  • One print only
  • Available in
    PDF
  • Free industry update
    (Within 180 days)
  •   Free report update in next update cycle
    (Mar 2020 - Mar 2021)
  • Five Users
  • $6,450
  • Limited to five authorized users
  • Print upto five copies
  • Available in
    PDF
  • Free industry update
    (Within 180 days)
  •   Free report update in next update cycle
    (Mar 2020 - Mar 2021)
  • Enterprise
    License/PDF

  • $10,995
  • Unlimited
    within
    company/enterprise
  • Available in Excel & PDF
  • Free industry update
    (Within 180 days)
  •   Free report update in next update cycle
    (Mar 2020 - Mar 2021)
  • Library
    Membership

  • $999 $ 1,175
    Per User/ Per month/ Billed annually
  • Published Content
    E-access
  • Company Profiles
    E-access
  • Newly Added Content Access
  • 10 PDF
    Downloads
  • 5 Excel Data
    Pack Downloads
  • 250 Company Profiles PDF Downloads
  • Buy Now

*Taxes/Fees, if applicable will be added during checkout. All prices in USD

RELATED REPORTS
 

Why Allied Market Research?


Infallible Methodology

To ensure high-level data integrity, accurate analysis, and impeccable forecasts

Analyst Support

For complete satisfaction

Customization

On-demand customization of scope of the report to exactly meet your needs

TARGETED MARKET VIEW

Targeted market view to provide pertinent information and save time of readers

Get fresh content delivered

Get insights on topics that are crucial for your business. Stay abreast of your interest areas.

Get Industry Data Alerts

Why Allied Market Research?

Infallible Methodology

To ensure high-level data integrity, accurate analysis, and impeccable forecasts

Analyst Support

For complete satisfaction

Customization

On-demand customization of scope of the report to exactly meet your needs

TARGETED MARKET VIEW

Targeted market view to provide pertinent information and save time of readers