0
2022
Fingerprint Payment Market

Fingerprint Payment Market

by Component (Hardware, Software, Services), by Type of Fingerprint Scanners (Optical Fingerprint Scanner, Capacitive Fingerprint Scanner, Ultrasonic Fingerprint Scanner, Thermal Fingerprint Scanner), by End User (Retail, Government, Transportation, Healthcare, Hospitality, Others): Global Opportunity Analysis and Industry Forecast, 2021-2031

Report Code: A12966
Dec 2022 | Pages: 230
Tables: 147
Charts: 61
  • Formats*:

  • pdf

    Single User License, Five User
    License & Enterprise User License

  • xls

    Data Pack Excel License

  • ppt

    It comes with the additional cost
    of $2500.00 contact sales.


Fingerprint Payment Market Research, 2031

The global fingerprint payment market was valued at $9 billion in 2021, and is projected to reach $36.2 billion by 2031, growing at a CAGR of 15.3% from 2022 to 2031.

The COVID-19 pandemic had a moderate impact on the fingerprint payment market size since many biometric devices such as finger print scanners, vein recognition and others involve touching of surfaces.

The fingerprint payment uses chip technology in conjunction with fingerprint identification to quickly and securely confirm the payer's identity for in-store purchases. It can be used at EMV terminals all around the world. An inbuilt sensor operated by the chip authenticates identity using a fingerprint. Further, fingerprint payment method uses passive and active biometrics to create the best possible experience for the customers, and layers of security for merchants.

Businesses are increasingly using fingerprint payment to function more quickly, cut down on transaction time, and enhance security. In addition, to make sure the business runs securely, they are entailed with complex security authentication features to increases the security of fingerprint payment systems. This factor notably drives the fingerprint payment market growth. However, high acquisition costs and security risks of the payment terminals hinder the growth of the fingerprint payment market. On the contrary, technological advancements in the fingerprint payment such as inclusion of machine learning (ML) and automations is expected to fuel the growth of the fingerprint payment market in upcoming years. Moreover, increase in adoption of wireless handheld POS terminal by restaurants and healthcare industry for streamlining the transactions through biometrics is expected to provide lucrative opportunities for the market to grow in upcoming years.

The report focuses on growth prospects, restraints, and trends of the fingerprint payment market. The study provides Porter’s five forces analysis to understand the impact of various factors, such as bargaining power of suppliers; competitive intensity of competitors; threat of new entrants; threat of substitutes; and bargaining power of buyers on the fingerprint payment market outlook.

Fingerprint Payment Market

The fingerprint payment market is segmented into Component, Type of Fingerprint Scanners and End User.

The fingerprint payment market is segmented on the basis of component, type of fingerprint scanner, end user and region. On the basis of component, it is classified into hardware, software and services. By type of fingerprint scanner, it is categorized into optical fingerprint scanners, capacitive fingerprint scanners, ultrasonic fingerprint scanners, and thermal fingerprint scanners. By end user, it is divided into retail, government, transportation, healthcare, hospitality, government, and others. By region, it is analyzed across North America, Europe, Asia-Pacific, and LAMEA.
Fingerprint Payment Market

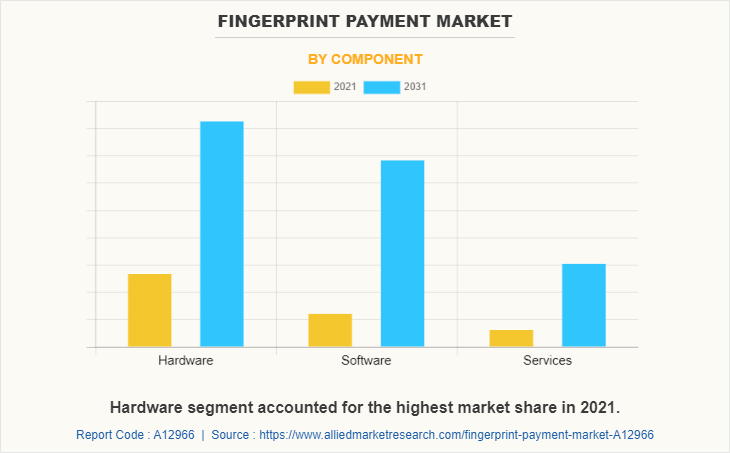
By component, the hardware segment acquired major fingerprint payment market size in 2021. This is attributed to factors such as increase in competition in retail businesses, user needs, customers preference for quicker checkout/transaction times and a secure system transmits transactions.
Fingerprint Payment Market

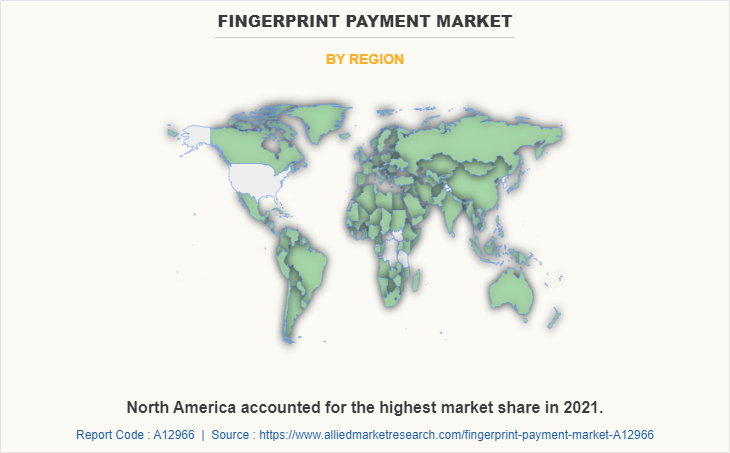
By region, the fingerprint payment market share is being dominated by North America in 2021, and is expected to maintain this trend during the forecast period. Attributed to the growing use of web applications and internet has increased the demand for security and verification on account of the increased threat of cyber-attacks and data pilfering. The most vulnerable data is found to be in government databases, large organizations, and the defense sector, where the need for higher security which act as factors that boost the growth of the fingerprint payment industry in the region.

The report fingerprint payment market analysis includes the profiles of key players operating in the fingerprint payment market such as Apple Inc., Anviz Global Inc., Fingerprint Cards AB, IDEX Biometrics, IDEMIA, Infineon Technologies AG, NEC Corporation, Precise Biometrics, Synaptics Incorporated and Thales. These players have adopted various strategies to increase their market penetration and strengthen their position in the fingerprint payment market.   

Country Specific Statistics & Information

Developing countries such as India and South Korea are increasingly targeted by the key players to develop and launch the fingerprint payment features into the existing range of products. For instance, in August 2022, Samsung Electronics and MasterCard have signed MoU as a part of which the two companies will be launching payment cards with built-in fingerprint sensors. Hence, the two companies will be launching payment experiences while reducing physical contact with payments terminal.

Furthermore, according to an article published in October 2022, merchants across the U.S. will soon be able to accept biometric payments authenticated by a customer’s fingerprint using a point-of-sale (POS) solution launched by payment processing provider Green Payments. The solution will allow users to link different payment options stored in a digital wallet including credit cards, bank accounts and cryptocurrencies to individual fingers and then make in-store purchases at the POS by tapping the relevant finger on a biometric sensor.

The COVID-19 pandemic had a moderate impact on the fingerprint payment market size since many biometric devices such as finger print scanners, vein recognition and others involve touching of surfaces. Furthermore, people started wearing face masks during the pandemic which was challenging for fingerprint payment devices to recognize the person.

Key Developments/ Strategies

  • On May 2022, Fingerprint Cards collaborated with Transcorp and Mswipe to bring contactless biometric payment cards to India and published its financial results for 2021 and future outlook that anticipates success with diversification and the biometric payment card market.
  • On September 2022, World-leading biometrics company, Fingerprint Cards AB (Fingerprints) and leading financial and banking solution provider, Technical Equipment & Supplies Company (Tesco), collaborated to promote and support the adoption of contactless biometric payment cards in the Middle East.
  • In August 2021, Swedish biometrics company, Fingerprint Cards and Seshaasai, a smart card manufacturer in India with a commanding APAC presence, have entered into an agreement to develop, launch, market, and sell contactless biometric payment cards in India and Asia-Pacific. The card will feature Fingerprints’ T-Shape module and software platform, which has ultra-low power consumption and is tailored to be integrated in payment cards using standard automated manufacturing processes.

Key benefits for stakeholders

  • This report provides a quantitative analysis of the market segments, current trends, estimations, and dynamics of the fingerprint payment market forecast from 2021 to 2031 to identify the prevailing market opportunities.
  • The market research is offered along with information related to key drivers, restraints, and opportunities of fingerprint payment market overview.
  • Porter's five forces analysis highlights the potency of buyers and suppliers to enable stakeholders to make profit-oriented business decisions and strengthen their supplier-buyer network.
  • In-depth analysis of the fingerprint payment market segmentation assists in determining the prevailing fingerprint payment market opportunity.
  • Major countries in each region are mapped according to their revenue contribution to the global market.
  • Market player positioning facilitates benchmarking and provides a clear understanding of the present position of the market players.
  • The report includes an analysis of the regional as well as global fingerprint payment market trends, key players, market segments, application areas, and market growth strategies.

Fingerprint Payment Market Report Highlights

Aspects Details
Market Size By 2031 USD 36.2 billion
Growth Rate CAGR of 15.3%
Forecast period 2021 - 2031
Report Pages 230
By Component
  • Software
  • Services
  • Hardware
By Type of Fingerprint Scanners
  • Optical Fingerprint Scanner
  • Capacitive Fingerprint Scanner
  • Ultrasonic Fingerprint Scanner
  • Thermal Fingerprint Scanner
By End User
  • Retail
  • Government
  • Transportation
  • Healthcare
  • Hospitality
  • Others
By Region
  • North America  (U.S., Canada)
  • Europe  (UK, Germany, France, Italy, Spain, Rest of Europe)
  • Asia-Pacific  (China, Japan, India, Australia, South Korea, Rest of Asia-Pacific)
  • LAMEA  (Latin America, Middle East, Africa)
Key Market Players Infineon Technologies AG, IDEMIA, NEC Corporation, Synaptics Incorporated, Apple Inc., IDEX Biometrics, Anviz Global Inc., Fingerprint Cards AB, Precise Biometrics, Thales
 
  • CHAPTER 1:INTRODUCTION

    • 1.1.Report description

    • 1.2.Key market segments

    • 1.3.Key benefits to the stakeholders

    • 1.4.Research Methodology

      • 1.4.1.Secondary research

      • 1.4.2.Primary research

      • 1.4.3.Analyst tools and models

  • CHAPTER 2:EXECUTIVE SUMMARY

    • 2.1.Key findings of the study

    • 2.2.CXO Perspective

  • CHAPTER 3:MARKET OVERVIEW

    • 3.1.Market definition and scope

    • 3.2.Key findings

      • 3.2.1.Top investment pockets

    • 3.3.Porter’s five forces analysis

    • 3.4.Top player positioning

    • 3.5.Market dynamics

      • 3.5.1.Drivers

      • 3.5.2.Restraints

      • 3.5.3.Opportunities

    • 3.6.COVID-19 Impact Analysis on the market

  • CHAPTER 4: FINGERPRINT PAYMENT MARKET, BY COMPONENT

    • 4.1 Overview

      • 4.1.1 Market size and forecast

    • 4.2 Hardware

      • 4.2.1 Key market trends, growth factors and opportunities

      • 4.2.2 Market size and forecast, by region

      • 4.2.3 Market share analysis by country

    • 4.3 Software

      • 4.3.1 Key market trends, growth factors and opportunities

      • 4.3.2 Market size and forecast, by region

      • 4.3.3 Market share analysis by country

    • 4.4 Services

      • 4.4.1 Key market trends, growth factors and opportunities

      • 4.4.2 Market size and forecast, by region

      • 4.4.3 Market share analysis by country

  • CHAPTER 5: FINGERPRINT PAYMENT MARKET, BY TYPE OF FINGERPRINT SCANNERS

    • 5.1 Overview

      • 5.1.1 Market size and forecast

    • 5.2 Optical Fingerprint Scanner

      • 5.2.1 Key market trends, growth factors and opportunities

      • 5.2.2 Market size and forecast, by region

      • 5.2.3 Market share analysis by country

    • 5.3 Capacitive Fingerprint Scanner

      • 5.3.1 Key market trends, growth factors and opportunities

      • 5.3.2 Market size and forecast, by region

      • 5.3.3 Market share analysis by country

    • 5.4 Ultrasonic Fingerprint Scanner

      • 5.4.1 Key market trends, growth factors and opportunities

      • 5.4.2 Market size and forecast, by region

      • 5.4.3 Market share analysis by country

    • 5.5 Thermal Fingerprint Scanner

      • 5.5.1 Key market trends, growth factors and opportunities

      • 5.5.2 Market size and forecast, by region

      • 5.5.3 Market share analysis by country

  • CHAPTER 6: FINGERPRINT PAYMENT MARKET, BY END USER

    • 6.1 Overview

      • 6.1.1 Market size and forecast

    • 6.2 Retail

      • 6.2.1 Key market trends, growth factors and opportunities

      • 6.2.2 Market size and forecast, by region

      • 6.2.3 Market share analysis by country

    • 6.3 Government

      • 6.3.1 Key market trends, growth factors and opportunities

      • 6.3.2 Market size and forecast, by region

      • 6.3.3 Market share analysis by country

    • 6.4 Transportation

      • 6.4.1 Key market trends, growth factors and opportunities

      • 6.4.2 Market size and forecast, by region

      • 6.4.3 Market share analysis by country

    • 6.5 Healthcare

      • 6.5.1 Key market trends, growth factors and opportunities

      • 6.5.2 Market size and forecast, by region

      • 6.5.3 Market share analysis by country

    • 6.6 Hospitality

      • 6.6.1 Key market trends, growth factors and opportunities

      • 6.6.2 Market size and forecast, by region

      • 6.6.3 Market share analysis by country

    • 6.7 Others

      • 6.7.1 Key market trends, growth factors and opportunities

      • 6.7.2 Market size and forecast, by region

      • 6.7.3 Market share analysis by country

  • CHAPTER 7: FINGERPRINT PAYMENT MARKET, BY REGION

    • 7.1 Overview

      • 7.1.1 Market size and forecast

    • 7.2 North America

      • 7.2.1 Key trends and opportunities

      • 7.2.2 North America Market size and forecast, by Component

      • 7.2.3 North America Market size and forecast, by Type of Fingerprint Scanners

      • 7.2.4 North America Market size and forecast, by End User

      • 7.2.5 North America Market size and forecast, by country

        • 7.2.5.1 U.S.
          • 7.2.5.1.1 Key market trends, growth factors and opportunities
          • 7.2.5.1.2 Market size and forecast, by Component
          • 7.2.5.1.3 Market size and forecast, by Type of Fingerprint Scanners
          • 7.2.5.1.4 Market size and forecast, by End User
        • 7.2.5.2 Canada
          • 7.2.5.2.1 Key market trends, growth factors and opportunities
          • 7.2.5.2.2 Market size and forecast, by Component
          • 7.2.5.2.3 Market size and forecast, by Type of Fingerprint Scanners
          • 7.2.5.2.4 Market size and forecast, by End User
    • 7.3 Europe

      • 7.3.1 Key trends and opportunities

      • 7.3.2 Europe Market size and forecast, by Component

      • 7.3.3 Europe Market size and forecast, by Type of Fingerprint Scanners

      • 7.3.4 Europe Market size and forecast, by End User

      • 7.3.5 Europe Market size and forecast, by country

        • 7.3.5.1 UK
          • 7.3.5.1.1 Key market trends, growth factors and opportunities
          • 7.3.5.1.2 Market size and forecast, by Component
          • 7.3.5.1.3 Market size and forecast, by Type of Fingerprint Scanners
          • 7.3.5.1.4 Market size and forecast, by End User
        • 7.3.5.2 Germany
          • 7.3.5.2.1 Key market trends, growth factors and opportunities
          • 7.3.5.2.2 Market size and forecast, by Component
          • 7.3.5.2.3 Market size and forecast, by Type of Fingerprint Scanners
          • 7.3.5.2.4 Market size and forecast, by End User
        • 7.3.5.3 France
          • 7.3.5.3.1 Key market trends, growth factors and opportunities
          • 7.3.5.3.2 Market size and forecast, by Component
          • 7.3.5.3.3 Market size and forecast, by Type of Fingerprint Scanners
          • 7.3.5.3.4 Market size and forecast, by End User
        • 7.3.5.4 Italy
          • 7.3.5.4.1 Key market trends, growth factors and opportunities
          • 7.3.5.4.2 Market size and forecast, by Component
          • 7.3.5.4.3 Market size and forecast, by Type of Fingerprint Scanners
          • 7.3.5.4.4 Market size and forecast, by End User
        • 7.3.5.5 Spain
          • 7.3.5.5.1 Key market trends, growth factors and opportunities
          • 7.3.5.5.2 Market size and forecast, by Component
          • 7.3.5.5.3 Market size and forecast, by Type of Fingerprint Scanners
          • 7.3.5.5.4 Market size and forecast, by End User
        • 7.3.5.6 Rest of Europe
          • 7.3.5.6.1 Key market trends, growth factors and opportunities
          • 7.3.5.6.2 Market size and forecast, by Component
          • 7.3.5.6.3 Market size and forecast, by Type of Fingerprint Scanners
          • 7.3.5.6.4 Market size and forecast, by End User
    • 7.4 Asia-Pacific

      • 7.4.1 Key trends and opportunities

      • 7.4.2 Asia-Pacific Market size and forecast, by Component

      • 7.4.3 Asia-Pacific Market size and forecast, by Type of Fingerprint Scanners

      • 7.4.4 Asia-Pacific Market size and forecast, by End User

      • 7.4.5 Asia-Pacific Market size and forecast, by country

        • 7.4.5.1 China
          • 7.4.5.1.1 Key market trends, growth factors and opportunities
          • 7.4.5.1.2 Market size and forecast, by Component
          • 7.4.5.1.3 Market size and forecast, by Type of Fingerprint Scanners
          • 7.4.5.1.4 Market size and forecast, by End User
        • 7.4.5.2 Japan
          • 7.4.5.2.1 Key market trends, growth factors and opportunities
          • 7.4.5.2.2 Market size and forecast, by Component
          • 7.4.5.2.3 Market size and forecast, by Type of Fingerprint Scanners
          • 7.4.5.2.4 Market size and forecast, by End User
        • 7.4.5.3 India
          • 7.4.5.3.1 Key market trends, growth factors and opportunities
          • 7.4.5.3.2 Market size and forecast, by Component
          • 7.4.5.3.3 Market size and forecast, by Type of Fingerprint Scanners
          • 7.4.5.3.4 Market size and forecast, by End User
        • 7.4.5.4 Australia
          • 7.4.5.4.1 Key market trends, growth factors and opportunities
          • 7.4.5.4.2 Market size and forecast, by Component
          • 7.4.5.4.3 Market size and forecast, by Type of Fingerprint Scanners
          • 7.4.5.4.4 Market size and forecast, by End User
        • 7.4.5.5 South Korea
          • 7.4.5.5.1 Key market trends, growth factors and opportunities
          • 7.4.5.5.2 Market size and forecast, by Component
          • 7.4.5.5.3 Market size and forecast, by Type of Fingerprint Scanners
          • 7.4.5.5.4 Market size and forecast, by End User
        • 7.4.5.6 Rest of Asia-Pacific
          • 7.4.5.6.1 Key market trends, growth factors and opportunities
          • 7.4.5.6.2 Market size and forecast, by Component
          • 7.4.5.6.3 Market size and forecast, by Type of Fingerprint Scanners
          • 7.4.5.6.4 Market size and forecast, by End User
    • 7.5 LAMEA

      • 7.5.1 Key trends and opportunities

      • 7.5.2 LAMEA Market size and forecast, by Component

      • 7.5.3 LAMEA Market size and forecast, by Type of Fingerprint Scanners

      • 7.5.4 LAMEA Market size and forecast, by End User

      • 7.5.5 LAMEA Market size and forecast, by country

        • 7.5.5.1 Latin America
          • 7.5.5.1.1 Key market trends, growth factors and opportunities
          • 7.5.5.1.2 Market size and forecast, by Component
          • 7.5.5.1.3 Market size and forecast, by Type of Fingerprint Scanners
          • 7.5.5.1.4 Market size and forecast, by End User
        • 7.5.5.2 Middle East
          • 7.5.5.2.1 Key market trends, growth factors and opportunities
          • 7.5.5.2.2 Market size and forecast, by Component
          • 7.5.5.2.3 Market size and forecast, by Type of Fingerprint Scanners
          • 7.5.5.2.4 Market size and forecast, by End User
        • 7.5.5.3 Africa
          • 7.5.5.3.1 Key market trends, growth factors and opportunities
          • 7.5.5.3.2 Market size and forecast, by Component
          • 7.5.5.3.3 Market size and forecast, by Type of Fingerprint Scanners
          • 7.5.5.3.4 Market size and forecast, by End User
  • CHAPTER 8: COMPANY LANDSCAPE

    • 8.1. Introduction

    • 8.2. Top winning strategies

    • 8.3. Product Mapping of Top 10 Player

    • 8.4. Competitive Dashboard

    • 8.5. Competitive Heatmap

    • 8.6. Key developments

  • CHAPTER 9: COMPANY PROFILES

    • 9.1 Apple Inc.

      • 9.1.1 Company overview

      • 9.1.2 Company snapshot

      • 9.1.3 Operating business segments

      • 9.1.4 Product portfolio

      • 9.1.5 Business performance

      • 9.1.6 Key strategic moves and developments

    • 9.2 Thales

      • 9.2.1 Company overview

      • 9.2.2 Company snapshot

      • 9.2.3 Operating business segments

      • 9.2.4 Product portfolio

      • 9.2.5 Business performance

      • 9.2.6 Key strategic moves and developments

    • 9.3 NEC Corporation

      • 9.3.1 Company overview

      • 9.3.2 Company snapshot

      • 9.3.3 Operating business segments

      • 9.3.4 Product portfolio

      • 9.3.5 Business performance

      • 9.3.6 Key strategic moves and developments

    • 9.4 Precise Biometrics

      • 9.4.1 Company overview

      • 9.4.2 Company snapshot

      • 9.4.3 Operating business segments

      • 9.4.4 Product portfolio

      • 9.4.5 Business performance

      • 9.4.6 Key strategic moves and developments

    • 9.5 IDEMIA

      • 9.5.1 Company overview

      • 9.5.2 Company snapshot

      • 9.5.3 Operating business segments

      • 9.5.4 Product portfolio

      • 9.5.5 Business performance

      • 9.5.6 Key strategic moves and developments

    • 9.6 Anviz Global Inc.

      • 9.6.1 Company overview

      • 9.6.2 Company snapshot

      • 9.6.3 Operating business segments

      • 9.6.4 Product portfolio

      • 9.6.5 Business performance

      • 9.6.6 Key strategic moves and developments

    • 9.7 Fingerprint Cards AB

      • 9.7.1 Company overview

      • 9.7.2 Company snapshot

      • 9.7.3 Operating business segments

      • 9.7.4 Product portfolio

      • 9.7.5 Business performance

      • 9.7.6 Key strategic moves and developments

    • 9.8 IDEX Biometrics

      • 9.8.1 Company overview

      • 9.8.2 Company snapshot

      • 9.8.3 Operating business segments

      • 9.8.4 Product portfolio

      • 9.8.5 Business performance

      • 9.8.6 Key strategic moves and developments

    • 9.9 Infineon Technologies AG

      • 9.9.1 Company overview

      • 9.9.2 Company snapshot

      • 9.9.3 Operating business segments

      • 9.9.4 Product portfolio

      • 9.9.5 Business performance

      • 9.9.6 Key strategic moves and developments

    • 9.10 Synaptics Incorporated

      • 9.10.1 Company overview

      • 9.10.2 Company snapshot

      • 9.10.3 Operating business segments

      • 9.10.4 Product portfolio

      • 9.10.5 Business performance

      • 9.10.6 Key strategic moves and developments

  • LIST OF TABLES

  • TABLE 1. GLOBAL FINGERPRINT PAYMENT MARKET, BY COMPONENT, 2021-2031 (REVENUE, $MILLION)
    TABLE 2. FINGERPRINT PAYMENT MARKET FOR HARDWARE, BY REGION, 2021-2031 (REVENUE, $MILLION)
    TABLE 3. FINGERPRINT PAYMENT MARKET FOR HARDWARE, BY COUNTRY, 2021-2031 (REVENUE, $MILLION)
    TABLE 4. FINGERPRINT PAYMENT MARKET FOR SOFTWARE, BY REGION, 2021-2031 (REVENUE, $MILLION)
    TABLE 5. FINGERPRINT PAYMENT MARKET FOR SOFTWARE, BY COUNTRY, 2021-2031 (REVENUE, $MILLION)
    TABLE 6. FINGERPRINT PAYMENT MARKET FOR SERVICES, BY REGION, 2021-2031 (REVENUE, $MILLION)
    TABLE 7. FINGERPRINT PAYMENT MARKET FOR SERVICES, BY COUNTRY, 2021-2031 (REVENUE, $MILLION)
    TABLE 8. GLOBAL FINGERPRINT PAYMENT MARKET, BY TYPE OF FINGERPRINT SCANNERS, 2021-2031 (REVENUE, $MILLION)
    TABLE 9. FINGERPRINT PAYMENT MARKET FOR OPTICAL FINGERPRINT SCANNER, BY REGION, 2021-2031 (REVENUE, $MILLION)
    TABLE 10. FINGERPRINT PAYMENT MARKET FOR OPTICAL FINGERPRINT SCANNER, BY COUNTRY, 2021-2031 (REVENUE, $MILLION)
    TABLE 11. FINGERPRINT PAYMENT MARKET FOR CAPACITIVE FINGERPRINT SCANNER, BY REGION, 2021-2031 (REVENUE, $MILLION)
    TABLE 12. FINGERPRINT PAYMENT MARKET FOR CAPACITIVE FINGERPRINT SCANNER, BY COUNTRY, 2021-2031 (REVENUE, $MILLION)
    TABLE 13. FINGERPRINT PAYMENT MARKET FOR ULTRASONIC FINGERPRINT SCANNER, BY REGION, 2021-2031 (REVENUE, $MILLION)
    TABLE 14. FINGERPRINT PAYMENT MARKET FOR ULTRASONIC FINGERPRINT SCANNER, BY COUNTRY, 2021-2031 (REVENUE, $MILLION)
    TABLE 15. FINGERPRINT PAYMENT MARKET FOR THERMAL FINGERPRINT SCANNER, BY REGION, 2021-2031 (REVENUE, $MILLION)
    TABLE 16. FINGERPRINT PAYMENT MARKET FOR THERMAL FINGERPRINT SCANNER, BY COUNTRY, 2021-2031 (REVENUE, $MILLION)
    TABLE 17. GLOBAL FINGERPRINT PAYMENT MARKET, BY END USER, 2021-2031 (REVENUE, $MILLION)
    TABLE 18. FINGERPRINT PAYMENT MARKET FOR RETAIL, BY REGION, 2021-2031 (REVENUE, $MILLION)
    TABLE 19. FINGERPRINT PAYMENT MARKET FOR RETAIL, BY COUNTRY, 2021-2031 (REVENUE, $MILLION)
    TABLE 20. FINGERPRINT PAYMENT MARKET FOR GOVERNMENT, BY REGION, 2021-2031 (REVENUE, $MILLION)
    TABLE 21. FINGERPRINT PAYMENT MARKET FOR GOVERNMENT, BY COUNTRY, 2021-2031 (REVENUE, $MILLION)
    TABLE 22. FINGERPRINT PAYMENT MARKET FOR TRANSPORTATION, BY REGION, 2021-2031 (REVENUE, $MILLION)
    TABLE 23. FINGERPRINT PAYMENT MARKET FOR TRANSPORTATION, BY COUNTRY, 2021-2031 (REVENUE, $MILLION)
    TABLE 24. FINGERPRINT PAYMENT MARKET FOR HEALTHCARE, BY REGION, 2021-2031 (REVENUE, $MILLION)
    TABLE 25. FINGERPRINT PAYMENT MARKET FOR HEALTHCARE, BY COUNTRY, 2021-2031 (REVENUE, $MILLION)
    TABLE 26. FINGERPRINT PAYMENT MARKET FOR HOSPITALITY, BY REGION, 2021-2031 (REVENUE, $MILLION)
    TABLE 27. FINGERPRINT PAYMENT MARKET FOR HOSPITALITY, BY COUNTRY, 2021-2031 (REVENUE, $MILLION)
    TABLE 28. FINGERPRINT PAYMENT MARKET FOR OTHERS, BY REGION, 2021-2031 (REVENUE, $MILLION)
    TABLE 29. FINGERPRINT PAYMENT MARKET FOR OTHERS, BY COUNTRY, 2021-2031 (REVENUE, $MILLION)
    TABLE 30. FINGERPRINT PAYMENT MARKET, BY REGION, 2021-2031 (REVENUE, $MILLION)
    TABLE 31. NORTH AMERICA FINGERPRINT PAYMENT MARKET, BY COMPONENT, 2021-2031 (REVENUE, $MILLION)
    TABLE 32. NORTH AMERICA FINGERPRINT PAYMENT MARKET, BY TYPE OF FINGERPRINT SCANNERS, 2021-2031 (REVENUE, $MILLION)
    TABLE 33. NORTH AMERICA FINGERPRINT PAYMENT MARKET, BY END USER, 2021-2031 (REVENUE, $MILLION)
    TABLE 34. NORTH AMERICA FINGERPRINT PAYMENT MARKET, BY COUNTRY, 2021-2031 (REVENUE, $MILLION)
    TABLE 35. U.S. FINGERPRINT PAYMENT MARKET, BY COMPONENT, 2021-2031 (REVENUE, $MILLION)
    TABLE 36. U.S. FINGERPRINT PAYMENT MARKET, BY TYPE OF FINGERPRINT SCANNERS, 2021-2031 (REVENUE, $MILLION)
    TABLE 37. U.S. FINGERPRINT PAYMENT MARKET, BY END USER, 2021-2031 (REVENUE, $MILLION)
    TABLE 38. CANADA FINGERPRINT PAYMENT MARKET, BY COMPONENT, 2021-2031 (REVENUE, $MILLION)
    TABLE 39. CANADA FINGERPRINT PAYMENT MARKET, BY TYPE OF FINGERPRINT SCANNERS, 2021-2031 (REVENUE, $MILLION)
    TABLE 40. CANADA FINGERPRINT PAYMENT MARKET, BY END USER, 2021-2031 (REVENUE, $MILLION)
    TABLE 41. EUROPE FINGERPRINT PAYMENT MARKET, BY COMPONENT, 2021-2031 (REVENUE, $MILLION)
    TABLE 42. EUROPE FINGERPRINT PAYMENT MARKET, BY TYPE OF FINGERPRINT SCANNERS, 2021-2031 (REVENUE, $MILLION)
    TABLE 43. EUROPE FINGERPRINT PAYMENT MARKET, BY END USER, 2021-2031 (REVENUE, $MILLION)
    TABLE 44. EUROPE FINGERPRINT PAYMENT MARKET, BY COUNTRY, 2021-2031 (REVENUE, $MILLION)
    TABLE 45. UK FINGERPRINT PAYMENT MARKET, BY COMPONENT, 2021-2031 (REVENUE, $MILLION)
    TABLE 46. UK FINGERPRINT PAYMENT MARKET, BY TYPE OF FINGERPRINT SCANNERS, 2021-2031 (REVENUE, $MILLION)
    TABLE 47. UK FINGERPRINT PAYMENT MARKET, BY END USER, 2021-2031 (REVENUE, $MILLION)
    TABLE 48. GERMANY FINGERPRINT PAYMENT MARKET, BY COMPONENT, 2021-2031 (REVENUE, $MILLION)
    TABLE 49. GERMANY FINGERPRINT PAYMENT MARKET, BY TYPE OF FINGERPRINT SCANNERS, 2021-2031 (REVENUE, $MILLION)
    TABLE 50. GERMANY FINGERPRINT PAYMENT MARKET, BY END USER, 2021-2031 (REVENUE, $MILLION)
    TABLE 51. FRANCE FINGERPRINT PAYMENT MARKET, BY COMPONENT, 2021-2031 (REVENUE, $MILLION)
    TABLE 52. FRANCE FINGERPRINT PAYMENT MARKET, BY TYPE OF FINGERPRINT SCANNERS, 2021-2031 (REVENUE, $MILLION)
    TABLE 53. FRANCE FINGERPRINT PAYMENT MARKET, BY END USER, 2021-2031 (REVENUE, $MILLION)
    TABLE 54. ITALY FINGERPRINT PAYMENT MARKET, BY COMPONENT, 2021-2031 (REVENUE, $MILLION)
    TABLE 55. ITALY FINGERPRINT PAYMENT MARKET, BY TYPE OF FINGERPRINT SCANNERS, 2021-2031 (REVENUE, $MILLION)
    TABLE 56. ITALY FINGERPRINT PAYMENT MARKET, BY END USER, 2021-2031 (REVENUE, $MILLION)
    TABLE 57. SPAIN FINGERPRINT PAYMENT MARKET, BY COMPONENT, 2021-2031 (REVENUE, $MILLION)
    TABLE 58. SPAIN FINGERPRINT PAYMENT MARKET, BY TYPE OF FINGERPRINT SCANNERS, 2021-2031 (REVENUE, $MILLION)
    TABLE 59. SPAIN FINGERPRINT PAYMENT MARKET, BY END USER, 2021-2031 (REVENUE, $MILLION)
    TABLE 60. REST OF EUROPE FINGERPRINT PAYMENT MARKET, BY COMPONENT, 2021-2031 (REVENUE, $MILLION)
    TABLE 61. REST OF EUROPE FINGERPRINT PAYMENT MARKET, BY TYPE OF FINGERPRINT SCANNERS, 2021-2031 (REVENUE, $MILLION)
    TABLE 62. REST OF EUROPE FINGERPRINT PAYMENT MARKET, BY END USER, 2021-2031 (REVENUE, $MILLION)
    TABLE 63. ASIA-PACIFIC FINGERPRINT PAYMENT MARKET, BY COMPONENT, 2021-2031 (REVENUE, $MILLION)
    TABLE 64. ASIA-PACIFIC FINGERPRINT PAYMENT MARKET, BY TYPE OF FINGERPRINT SCANNERS, 2021-2031 (REVENUE, $MILLION)
    TABLE 65. ASIA-PACIFIC FINGERPRINT PAYMENT MARKET, BY END USER, 2021-2031 (REVENUE, $MILLION)
    TABLE 66. ASIA-PACIFIC FINGERPRINT PAYMENT MARKET, BY COUNTRY, 2021-2031 (REVENUE, $MILLION)
    TABLE 67. CHINA FINGERPRINT PAYMENT MARKET, BY COMPONENT, 2021-2031 (REVENUE, $MILLION)
    TABLE 68. CHINA FINGERPRINT PAYMENT MARKET, BY TYPE OF FINGERPRINT SCANNERS, 2021-2031 (REVENUE, $MILLION)
    TABLE 69. CHINA FINGERPRINT PAYMENT MARKET, BY END USER, 2021-2031 (REVENUE, $MILLION)
    TABLE 70. JAPAN FINGERPRINT PAYMENT MARKET, BY COMPONENT, 2021-2031 (REVENUE, $MILLION)
    TABLE 71. JAPAN FINGERPRINT PAYMENT MARKET, BY TYPE OF FINGERPRINT SCANNERS, 2021-2031 (REVENUE, $MILLION)
    TABLE 72. JAPAN FINGERPRINT PAYMENT MARKET, BY END USER, 2021-2031 (REVENUE, $MILLION)
    TABLE 73. INDIA FINGERPRINT PAYMENT MARKET, BY COMPONENT, 2021-2031 (REVENUE, $MILLION)
    TABLE 74. INDIA FINGERPRINT PAYMENT MARKET, BY TYPE OF FINGERPRINT SCANNERS, 2021-2031 (REVENUE, $MILLION)
    TABLE 75. INDIA FINGERPRINT PAYMENT MARKET, BY END USER, 2021-2031 (REVENUE, $MILLION)
    TABLE 76. AUSTRALIA FINGERPRINT PAYMENT MARKET, BY COMPONENT, 2021-2031 (REVENUE, $MILLION)
    TABLE 77. AUSTRALIA FINGERPRINT PAYMENT MARKET, BY TYPE OF FINGERPRINT SCANNERS, 2021-2031 (REVENUE, $MILLION)
    TABLE 78. AUSTRALIA FINGERPRINT PAYMENT MARKET, BY END USER, 2021-2031 (REVENUE, $MILLION)
    TABLE 79. SOUTH KOREA FINGERPRINT PAYMENT MARKET, BY COMPONENT, 2021-2031 (REVENUE, $MILLION)
    TABLE 80. SOUTH KOREA FINGERPRINT PAYMENT MARKET, BY TYPE OF FINGERPRINT SCANNERS, 2021-2031 (REVENUE, $MILLION)
    TABLE 81. SOUTH KOREA FINGERPRINT PAYMENT MARKET, BY END USER, 2021-2031 (REVENUE, $MILLION)
    TABLE 82. REST OF ASIA-PACIFIC FINGERPRINT PAYMENT MARKET, BY COMPONENT, 2021-2031 (REVENUE, $MILLION)
    TABLE 83. REST OF ASIA-PACIFIC FINGERPRINT PAYMENT MARKET, BY TYPE OF FINGERPRINT SCANNERS, 2021-2031 (REVENUE, $MILLION)
    TABLE 84. REST OF ASIA-PACIFIC FINGERPRINT PAYMENT MARKET, BY END USER, 2021-2031 (REVENUE, $MILLION)
    TABLE 85. LAMEA FINGERPRINT PAYMENT MARKET, BY COMPONENT, 2021-2031 (REVENUE, $MILLION)
    TABLE 86. LAMEA FINGERPRINT PAYMENT MARKET, BY TYPE OF FINGERPRINT SCANNERS, 2021-2031 (REVENUE, $MILLION)
    TABLE 87. LAMEA FINGERPRINT PAYMENT MARKET, BY END USER, 2021-2031 (REVENUE, $MILLION)
    TABLE 88. LAMEA FINGERPRINT PAYMENT MARKET, BY COUNTRY, 2021-2031 (REVENUE, $MILLION)
    TABLE 89. LATIN AMERICA FINGERPRINT PAYMENT MARKET, BY COMPONENT, 2021-2031 (REVENUE, $MILLION)
    TABLE 90. LATIN AMERICA FINGERPRINT PAYMENT MARKET, BY TYPE OF FINGERPRINT SCANNERS, 2021-2031 (REVENUE, $MILLION)
    TABLE 91. LATIN AMERICA FINGERPRINT PAYMENT MARKET, BY END USER, 2021-2031 (REVENUE, $MILLION)
    TABLE 92. MIDDLE EAST FINGERPRINT PAYMENT MARKET, BY COMPONENT, 2021-2031 (REVENUE, $MILLION)
    TABLE 93. MIDDLE EAST FINGERPRINT PAYMENT MARKET, BY TYPE OF FINGERPRINT SCANNERS, 2021-2031 (REVENUE, $MILLION)
    TABLE 94. MIDDLE EAST FINGERPRINT PAYMENT MARKET, BY END USER, 2021-2031 (REVENUE, $MILLION)
    TABLE 95. AFRICA FINGERPRINT PAYMENT MARKET, BY COMPONENT, 2021-2031 (REVENUE, $MILLION)
    TABLE 96. AFRICA FINGERPRINT PAYMENT MARKET, BY TYPE OF FINGERPRINT SCANNERS, 2021-2031 (REVENUE, $MILLION)
    TABLE 97. AFRICA FINGERPRINT PAYMENT MARKET, BY END USER, 2021-2031 (REVENUE, $MILLION)
    TABLE 98.APPLE INC.: COMPANY SNAPSHOT
    TABLE 99.APPLE INC.: OPERATING SEGMENTS
    TABLE 100.APPLE INC.: PRODUCT PORTFOLIO
    TABLE 101.APPLE INC.: NET SALES
    TABLE 102.APPLE INC.: KEY STRATERGIES
    TABLE 103.THALES: COMPANY SNAPSHOT
    TABLE 104.THALES: OPERATING SEGMENTS
    TABLE 105.THALES: PRODUCT PORTFOLIO
    TABLE 106.THALES: NET SALES
    TABLE 107.THALES: KEY STRATERGIES
    TABLE 108.NEC CORPORATION: COMPANY SNAPSHOT
    TABLE 109.NEC CORPORATION: OPERATING SEGMENTS
    TABLE 110.NEC CORPORATION: PRODUCT PORTFOLIO
    TABLE 111.NEC CORPORATION: NET SALES
    TABLE 112.NEC CORPORATION: KEY STRATERGIES
    TABLE 113.PRECISE BIOMETRICS: COMPANY SNAPSHOT
    TABLE 114.PRECISE BIOMETRICS: OPERATING SEGMENTS
    TABLE 115.PRECISE BIOMETRICS: PRODUCT PORTFOLIO
    TABLE 116.PRECISE BIOMETRICS: NET SALES
    TABLE 117.PRECISE BIOMETRICS: KEY STRATERGIES
    TABLE 118.IDEMIA: COMPANY SNAPSHOT
    TABLE 119.IDEMIA: OPERATING SEGMENTS
    TABLE 120.IDEMIA: PRODUCT PORTFOLIO
    TABLE 121.IDEMIA: NET SALES
    TABLE 122.IDEMIA: KEY STRATERGIES
    TABLE 123.ANVIZ GLOBAL INC.: COMPANY SNAPSHOT
    TABLE 124.ANVIZ GLOBAL INC.: OPERATING SEGMENTS
    TABLE 125.ANVIZ GLOBAL INC.: PRODUCT PORTFOLIO
    TABLE 126.ANVIZ GLOBAL INC.: NET SALES
    TABLE 127.ANVIZ GLOBAL INC.: KEY STRATERGIES
    TABLE 128.FINGERPRINT CARDS AB: COMPANY SNAPSHOT
    TABLE 129.FINGERPRINT CARDS AB: OPERATING SEGMENTS
    TABLE 130.FINGERPRINT CARDS AB: PRODUCT PORTFOLIO
    TABLE 131.FINGERPRINT CARDS AB: NET SALES
    TABLE 132.FINGERPRINT CARDS AB: KEY STRATERGIES
    TABLE 133.IDEX BIOMETRICS: COMPANY SNAPSHOT
    TABLE 134.IDEX BIOMETRICS: OPERATING SEGMENTS
    TABLE 135.IDEX BIOMETRICS: PRODUCT PORTFOLIO
    TABLE 136.IDEX BIOMETRICS: NET SALES
    TABLE 137.IDEX BIOMETRICS: KEY STRATERGIES
    TABLE 138.INFINEON TECHNOLOGIES AG: COMPANY SNAPSHOT
    TABLE 139.INFINEON TECHNOLOGIES AG: OPERATING SEGMENTS
    TABLE 140.INFINEON TECHNOLOGIES AG: PRODUCT PORTFOLIO
    TABLE 141.INFINEON TECHNOLOGIES AG: NET SALES
    TABLE 142.INFINEON TECHNOLOGIES AG: KEY STRATERGIES
    TABLE 143.SYNAPTICS INCORPORATED: COMPANY SNAPSHOT
    TABLE 144.SYNAPTICS INCORPORATED: OPERATING SEGMENTS
    TABLE 145.SYNAPTICS INCORPORATED: PRODUCT PORTFOLIO
    TABLE 146.SYNAPTICS INCORPORATED: NET SALES
    TABLE 147.SYNAPTICS INCORPORATED: KEY STRATERGIES
  • LIST OF FIGURES

  • FIGURE 1.FINGERPRINT PAYMENT MARKET SEGMENTATION
    FIGURE 2.FINGERPRINT PAYMENT MARKET,2021-2031
    FIGURE 3.FINGERPRINT PAYMENT MARKET,2021-2031
    FIGURE 4. TOP INVESTMENT POCKETS, BY REGION
    FIGURE 5.PORTER FIVE-1
    FIGURE 6.PORTER FIVE-2
    FIGURE 7.PORTER FIVE-3
    FIGURE 8.PORTER FIVE-4
    FIGURE 9.PORTER FIVE-5
    FIGURE 10.TOP PLAYER POSITIONING
    FIGURE 11.FINGERPRINT PAYMENT MARKET:DRIVERS, RESTRAINTS AND OPPORTUNITIES
    FIGURE 12.FINGERPRINT PAYMENT MARKET,BY COMPONENT,2021(%)
    FIGURE 13.COMPARATIVE SHARE ANALYSIS OF HARDWARE FINGERPRINT PAYMENT MARKET,2021-2031(%)
    FIGURE 14.COMPARATIVE SHARE ANALYSIS OF SOFTWARE FINGERPRINT PAYMENT MARKET,2021-2031(%)
    FIGURE 15.COMPARATIVE SHARE ANALYSIS OF SERVICES FINGERPRINT PAYMENT MARKET,2021-2031(%)
    FIGURE 16.FINGERPRINT PAYMENT MARKET,BY TYPE OF FINGERPRINT SCANNERS,2021(%)
    FIGURE 17.COMPARATIVE SHARE ANALYSIS OF OPTICAL FINGERPRINT SCANNER FINGERPRINT PAYMENT MARKET,2021-2031(%)
    FIGURE 18.COMPARATIVE SHARE ANALYSIS OF CAPACITIVE FINGERPRINT SCANNER FINGERPRINT PAYMENT MARKET,2021-2031(%)
    FIGURE 19.COMPARATIVE SHARE ANALYSIS OF ULTRASONIC FINGERPRINT SCANNER FINGERPRINT PAYMENT MARKET,2021-2031(%)
    FIGURE 20.COMPARATIVE SHARE ANALYSIS OF THERMAL FINGERPRINT SCANNER FINGERPRINT PAYMENT MARKET,2021-2031(%)
    FIGURE 21.FINGERPRINT PAYMENT MARKET,BY END USER,2021(%)
    FIGURE 22.COMPARATIVE SHARE ANALYSIS OF RETAIL FINGERPRINT PAYMENT MARKET,2021-2031(%)
    FIGURE 23.COMPARATIVE SHARE ANALYSIS OF GOVERNMENT FINGERPRINT PAYMENT MARKET,2021-2031(%)
    FIGURE 24.COMPARATIVE SHARE ANALYSIS OF TRANSPORTATION FINGERPRINT PAYMENT MARKET,2021-2031(%)
    FIGURE 25.COMPARATIVE SHARE ANALYSIS OF HEALTHCARE FINGERPRINT PAYMENT MARKET,2021-2031(%)
    FIGURE 26.COMPARATIVE SHARE ANALYSIS OF HOSPITALITY FINGERPRINT PAYMENT MARKET,2021-2031(%)
    FIGURE 27.COMPARATIVE SHARE ANALYSIS OF OTHERS FINGERPRINT PAYMENT MARKET,2021-2031(%)
    FIGURE 28.FINGERPRINT PAYMENT MARKET BY REGION,2021
    FIGURE 29.U.S. FINGERPRINT PAYMENT MARKET,2021-2031($MILLION)
    FIGURE 30.CANADA FINGERPRINT PAYMENT MARKET,2021-2031($MILLION)
    FIGURE 31.UK FINGERPRINT PAYMENT MARKET,2021-2031($MILLION)
    FIGURE 32.GERMANY FINGERPRINT PAYMENT MARKET,2021-2031($MILLION)
    FIGURE 33.FRANCE FINGERPRINT PAYMENT MARKET,2021-2031($MILLION)
    FIGURE 34.ITALY FINGERPRINT PAYMENT MARKET,2021-2031($MILLION)
    FIGURE 35.SPAIN FINGERPRINT PAYMENT MARKET,2021-2031($MILLION)
    FIGURE 36.REST OF EUROPE FINGERPRINT PAYMENT MARKET,2021-2031($MILLION)
    FIGURE 37.CHINA FINGERPRINT PAYMENT MARKET,2021-2031($MILLION)
    FIGURE 38.JAPAN FINGERPRINT PAYMENT MARKET,2021-2031($MILLION)
    FIGURE 39.INDIA FINGERPRINT PAYMENT MARKET,2021-2031($MILLION)
    FIGURE 40.AUSTRALIA FINGERPRINT PAYMENT MARKET,2021-2031($MILLION)
    FIGURE 41.SOUTH KOREA FINGERPRINT PAYMENT MARKET,2021-2031($MILLION)
    FIGURE 42.REST OF ASIA-PACIFIC FINGERPRINT PAYMENT MARKET,2021-2031($MILLION)
    FIGURE 43.LATIN AMERICA FINGERPRINT PAYMENT MARKET,2021-2031($MILLION)
    FIGURE 44.MIDDLE EAST FINGERPRINT PAYMENT MARKET,2021-2031($MILLION)
    FIGURE 45.AFRICA FINGERPRINT PAYMENT MARKET,2021-2031($MILLION)
    FIGURE 46. TOP WINNING STRATEGIES, BY YEAR
    FIGURE 47. TOP WINNING STRATEGIES, BY DEVELOPMENT
    FIGURE 48. TOP WINNING STRATEGIES, BY COMPANY
    FIGURE 49.PRODUCT MAPPING OF TOP 10 PLAYERS
    FIGURE 50.COMPETITIVE DASHBOARD
    FIGURE 51.COMPETITIVE HEATMAP OF TOP 10 KEY PLAYERS
    FIGURE 52.APPLE INC..: NET SALES ($MILLION)
    FIGURE 53.THALES.: NET SALES ($MILLION)
    FIGURE 54.NEC CORPORATION.: NET SALES ($MILLION)
    FIGURE 55.PRECISE BIOMETRICS.: NET SALES ($MILLION)
    FIGURE 56.IDEMIA.: NET SALES ($MILLION)
    FIGURE 57.ANVIZ GLOBAL INC..: NET SALES ($MILLION)
    FIGURE 58.FINGERPRINT CARDS AB.: NET SALES ($MILLION)
    FIGURE 59.IDEX BIOMETRICS.: NET SALES ($MILLION)
    FIGURE 60.INFINEON TECHNOLOGIES AG.: NET SALES ($MILLION)
    FIGURE 61.SYNAPTICS INCORPORATED.: NET SALES ($MILLION)


There have been a lot of advancements in the field of biometrics over the past few years. Fingerprint payment is observed by many as the most effective and safe method of individual identification. Furthermore, it is described as the automatic techniques of recognizing or confirming the identity of a living person in particular centered on a physiological or behavioral trait. In addition, biometrics is a quickly developing technology that is extensively used in a lot of fields including forensics. It can be used for criminal identification and prison security and has the potential to be employed in a huge array of civilian relevance projects.

Biometrics can be exercised to check illegal access to ATMs, cellular phones, smart cards, desktop PCs, workstations, and computer networks. It can also play a huge role to make business safe from scammers and cyber-attacks. In addition, fingerprint payment is very useful during banking transactions carried out by telephone and Internet or electronic banking. In automobiles, fingerprint payment can replace keys with keyless entry devices. Moreover, fingerprint payment is capable of ensuring fast and reliable protected access to information. Currently, techniques such as password verification have a lot of issues causing people to write them down and forget them at times which leads to stealing and hacking. Therefore, these factors are playing a major role in the growth of biometrics technology market.

Facial recognition technology is increasingly being used In the U.S., companies such as Delta Airlines use it for passenger check-in. Airports are planning to use the technology; officials at Miami International plan to have face recognition for all international flights by 2021. Apple has it on its iPhones, while in Portland, Oregon, it's used to unlock the doors for customers at another store. Furthermore, facial recognition technology is employed in countries such as China, Singapore, the United Arab Emirates and Japan. Moreover, according to BBC, China reportedly uses 200 million surveillance cameras, one camera for every seven of its citizens.

By 2021, about 400 million new cameras are expected to be installed in the country. The cameras are intended primarily for security and traffic control purposes. China also uses this technology in schools. In July 2021, the South China Morning Post reported that the country is working on the world's most powerful facial recognition system – one able to identify any of its 1.3 billion citizens within three seconds.

Therefore, with such advancements, the fingerprint payment market is subjected to grow at a rapid speed in the upcoming years. Some of the key players profiled in the report include IBM Corporation, Amazon Web Services Inc., Microsoft, SAP SE, Goldman Sachs, Oracle, Bitpay, Cegeka, Bitfury Group Limited, and Intel Corporation. These players have adopted various strategies to increase their market penetration and strengthen their position in the industry.

PURCHASE OPTIONS

Call or Email us

U.S.-Canada Toll-free: +1-800-792-5285
Int'l : +1-503-894-6022
Europe : +44-845-528-1300
Email : help@alliedmarketresearch.com
 
FREQUENTLY ASKED QUESTIONS?

A. The fingerprint payment market is estimated to grow at a CAGR of 15.3% from 2022 to 2031.

A. The fingerprint payment market is projected to reach $36.19 billion by 2031.

A. Enhanced security in payment services, surge in penetration of internet and increasing adoption of contactless payment majorly contribute toward the growth of the market.

A. The key players profiled in the report include Apple Inc., Anviz Global Inc., Fingerprint Cards AB, IDEX Biometrics, IDEMIA, Infineon Technologies AG, NEC Corporation, Precise Biometrics, Synaptics Incorporated and Thales.

A. The key growth strategies of fingerprint payment market players include product portfolio expansion, mergers & acquisitions, agreements, geographical expansion, and collaborations.

Looking for Customization?

 Customization Request

Have a Question?

 Speak with Analyst

Any Confusion?

 Inquire Before Buying

Have a glance of the Report

  Request Sample
RELATED TAGS

Purchase Full Report of
Fingerprint Payment Market

Start reading instantly.
This Report and over 66,983+ more Reports, Available with Avenue Library. T&C*.

  • Online Only
  • $3,570
  • Online cloud access only
  • Restricted print, copy, paste & download
  • Read only
  • Free industry update
    (Within 180 days)
  • Free report update in next update cycle
    (Dec 2023 - Dec 2024)
  • Data Pack
  • $3,840
  • Restricted to one authorized user
  • One print only
  • Available in
    Excel
  • Free industry update
    (Within 180 days)
  •   Free report update in next update cycle
    (Dec 2023 - Dec 2024)
  • Single User
  • $5,730
  • Restricted to one authorized user
  • One print only
  • Available in
    PDF
  • Free industry update
    (Within 180 days)
  •   Free report update in next update cycle
    (Dec 2023 - Dec 2024)
  • Five Users
  • $6,450
  • Limited to five authorized users
  • Print upto five copies
  • Available in
    PDF
  • Free industry update
    (Within 180 days)
  •   Free report update in next update cycle
    (Dec 2023 - Dec 2024)
  • Enterprise
    License/PDF

  • $9,600
  • Unlimited
    within
    company/enterprise
  • Available in Excel & PDF
  • Free industry update
    (Within 180 days)
  •   Free report update in next update cycle
    (Dec 2023 - Dec 2024)
  • Library
    Membership

  • $999 $ 1,175
    Per User/ Per month/ Billed annually
  • Published Content
    E-access
  • Company Profiles
    E-access
  • Newly Added Content Access
  • 10 PDF
    Downloads
  • 5 Excel Data
    Pack Downloads
  • 250 Company Profiles PDF Downloads
  • Buy Now

*Taxes/Fees, if applicable will be added during checkout. All prices in USD

RELATED REPORTS
 

Why Allied Market Research?


Infallible Methodology

To ensure high-level data integrity, accurate analysis, and impeccable forecasts

Analyst Support

For complete satisfaction

Customization

On-demand customization of scope of the report to exactly meet your needs

TARGETED MARKET VIEW

Targeted market view to provide pertinent information and save time of readers

Get fresh content delivered

Get insights on topics that are crucial for your business. Stay abreast of your interest areas.

Get Industry Data Alerts

Why Allied Market Research?

Infallible Methodology

To ensure high-level data integrity, accurate analysis, and impeccable forecasts

Analyst Support

For complete satisfaction

Customization

On-demand customization of scope of the report to exactly meet your needs

TARGETED MARKET VIEW

Targeted market view to provide pertinent information and save time of readers