0
New
New
2023
Fire Truck Market

Fire Truck Market

by Type (Aerial, Pumper, Rescue, Tanker, Others), by Application (Residential and Commercial, Industrial and Airport, Military, Others), by Propulsion Type (ICE, Electric): Global Opportunity Analysis and Industry Forecast, 2023-2032

Report Code: A06276
Jul 2023 | Pages: 267
Tables: 126
Charts: 77
  • Formats*:

  • pdf

    Single User License, Five User
    License & Enterprise User License

  • xls

    Data Pack Excel License

  • ppt

    It comes with the additional cost
    of $2500.00 contact sales.


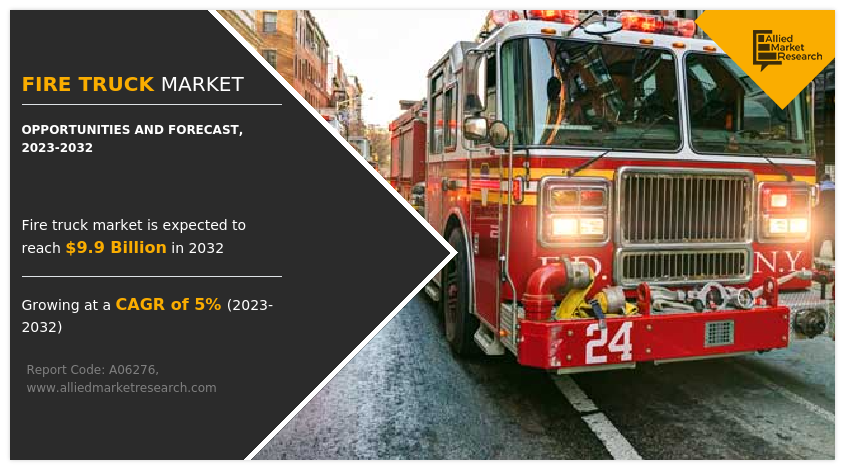
The global fire truck market size was valued at $6.2 billion in 2022, and is projected to reach $9.9 billion by 2032, growing at a CAGR of 5% from 2023 to 2032.

Report Key Highlighters:

  • The fire truck market studies more than 15 countries. The research includes a segment analysis of each country in terms of value ($ million) for the projected period 2022-2032.
  • The study integrated high-quality data, professional opinions and analysis, and critical independent perspectives. The research approach is intended to provide a balanced view of global markets and to assist stakeholders in making educated decisions to achieve their most ambitious growth objectives.
  • Over 3,700 product literature, annual reports, industry statements, and other comparable materials from major industry participants were reviewed to gain a better understanding of the market.
  • The fire truck market is moderately fragmented, with several players including Oshkosh Corporation, MORITA HOLDINGS CORPORATION, Rosenbauer International AG, Alexis Fire Equipment Company, Scania, Zoomlion Heavy Industry Science & Technology Co., Ltd., NAFFCO, REV Group, Magirus, and Albert Ziegler GmbH. Key strategies such as partnership, agreement, product launch, product development and other strategies of the players operating in the market are tracked and monitored.

Fire Truck Market

A fire truck is a vehicle designed and equipped to respond to emergencies such as fires, hazardous material incidents, medical emergencies, and extrication situations. These vehicles are designed with distinctive lights and markings that make them easily recognizable for efficient identification during emergency situations. Firefighting, rescue efforts, and emergency medical care are applications where fire trucks are utilized by the fire departments. Fire trucks are designed to transport vital firefighting supplies such as hoses, water pumps, ladders, and a variety of other gear needed to extinguish fires. Firefighters may respond to emergencies more quickly and efficiently owing to fire vehicles, which lowers the danger and protects people and property.
Factors such as growth in stringent fire safety regulations, electrification of fire trucks, and rise in replacement of aging fire truck fleets drive the growth of the fire truck market. However, regulatory compliance and safety standards, and high initial investment hinder the growth of the market. Furthermore, the surge in the integration of advanced safety features, and technological advancements offer remarkable growth opportunities for the players operating in the fire truck industry.

Fire Truck Market

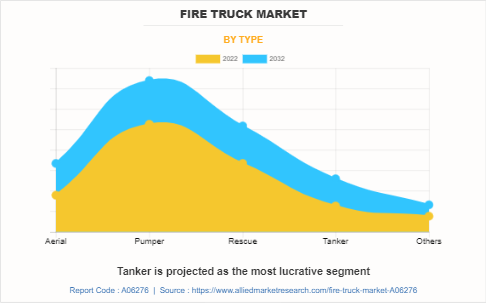
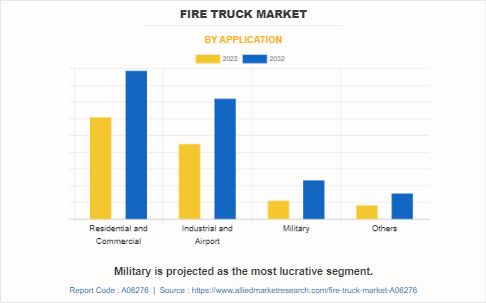
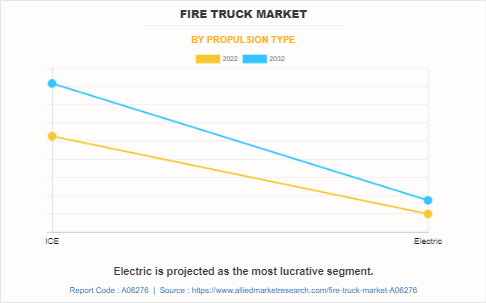
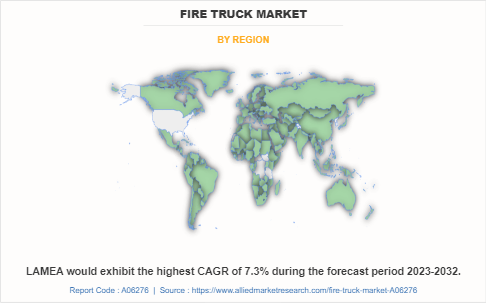
The fire truck market is segmented on the basis of type, application, propulsion type, and region. By type, it is classified into aerial, pumper, rescue, tanker, and others. By application, it is fragmented into residential & commercial, enterprises & airport, military, and others. By propulsion type, it is bifurcated into ICE, and electric. By region, the market is analyzed across North America, Europe, Asia-Pacific, and LAMEA.

The leading companies profiled in the fire truck market report include Oshkosh Corporation, MORITA HOLDINGS CORPORATION, Rosenbauer International AG, Alexis Fire Equipment Company, Scania, Zoomlion Heavy Industry Science & Technology Co., Ltd., NAFFCO, REV Group, Magirus, and Albert Ziegler GmbH. To strengthen the market position and increase the fire truck market share, the players have implemented strategies such as expansion, product development, agreement, contract, and others.

Europe includes the UK, Germany, France, Spain, and the rest of Europe. Fire departments in Europe are placing a greater focus on improving safety features and operational efficiency in fire trucks. The fire department requires vehicles that incorporate advanced technologies such as automatic vehicle location systems, integrated communication systems, state-of-the-art firefighting equipment, and enhanced ergonomic designs. Moreover, fire truck manufacturers market share is expected to steadily increase with the development and integration of electric and hybrid propulsion systems in fire trucks. These advancements are crucial for ensuring effective and safe firefighting operations in the region. Therefore, the rise in demand for fire trucks is anticipated to propel the growth of the market during the forecast period.

Stringent fire safety regulations

Demand for modern and technologically advanced fire trucks is fueled by the implementation of strict fire safety rules, which in turn drives the market for fire trucks.  The construction of fire suppression systems, the provision of proper access for emergency responders, and the availability of firefighting tools such as fire trucks are the requirements for fire protection measures that are outlined in fire safety regulations. Fire departments and organizations are required to abide by these rules by providing themselves with innovative, effective fire trucks that correspond to the set safety standards. Fire trucks are important vehicles in responding to fires and performing rescue operations effectively. They have specialized equipment such as water pumps, hoses, ladders, and other pieces of firefighting gear required for extinguishing fires and conducting rescue operations. During the forecast period, the demand for fire vehicles is driven by the requirement to adhere to fire safety regulations.
Fire Truck Market

Electrification of fire trucks

The rise in the demand for electric-powered fire trucks is driving the growth of the fire truck market. There is a rise in the global focus on sustainability and environmentally friendly solutions to reduce carbon emissions and promote cleaner energy alternatives. Electric fire trucks offer significant environmental advantages over traditional combustion engine vehicles. Manufacturers increasingly develop electric fire trucks to improve air quality, reduce carbon footprint, and decrease noise pollution during firefighting operations. For instance, in April 2022, REV Fire Group unveiled Vector, the first fully electric North American-style fire truck at Fire Department Instructors Conference (FDIC) 2022. The Vector is designed to meet the specific requirements and standards of North American fire departments, offering a fully electric alternative to traditional combustion engine fire trucks. In addition to their environmental benefits, electrified fire trucks provide operational advantages. Electric powertrains offer instant torque and smoother acceleration, enhancing the maneuverability and responsiveness required in emergency situations. Fire departments and municipalities are recognizing the advantages of electric fire trucks in terms of their environmental impact, operational capabilities, and potential cost savings. For instance, in April 2023, the city of Boulder, Colorado purchased its first electric fire truck, showcasing the growing trend of adopting electric vehicles in the firefighting industry. Therefore, the demand for electric-powered firefighting vehicles is increasing, driving innovation and development within the fire truck market. Manufacturers are investing in research and development to provide advanced electric fire trucks that meet the specific needs of fire departments and comply with safety regulations. Such developments to create a greener and more sustainable firefighting fleet are expected to boost the growth of the market.

Regulatory compliance and safety standards

Regulatory compliance and safety standards can act as restraints on the fire truck market by imposing specific requirements and limitations on manufacturers. The effectiveness of firefighting operations and the safety of firefighters are based on the regulations, which are developed by organizations such as the National Fire Protection Association (NFPA). Such regulations provide difficulties and restrictions for both manufacturers and consumers. Manufacturers are constrained by the need to commit a large amount of time and money to ensuring adherence to these requirements. They have to develop fire trucks that meet the required safety requirements, which may involve stringent testing, certification procedures, and following specific criteria. This can make production more expensive and may prevent certain manufacturers from competing in the market. Moreover, stringent safety standards may restrict the level of innovation and customization options available to manufacturers. While safety regulations are essential for ensuring the reliability and performance of fire trucks, they can also limit the flexibility for manufacturers to introduce new features or design variations that may better suit the specific needs of fire departments or address emerging firefighting challenges.
Fire Truck Market

High initial investment

High investment acts as a restraint to the fire truck market due to the substantial costs associated with manufacturing and purchasing fire trucks. Fire truck manufacturers need to make significant investments in research and development, engineering, manufacturing facilities, and specialized equipment. They are expected to incorporate advanced technologies, materials, and manufacturing processes to meet evolving safety standards, enhance performance, and improve overall capabilities. These investments can be substantial, particularly during the integration of innovative features such as advanced firefighting systems and integrated communication technologies. Moreover, fire departments and organizations face the challenge of the high cost of purchasing fire trucks. The complexity of design, specialized equipment, and safety features contribute to the high cost of fire trucks. In addition, ongoing maintenance, repairs, and training add to the overall cost of ownership for fire trucks. Routine servicing, equipment inspections, replacement parts, and training programs for firefighters are necessary to ensure the effective operation and maintenance of the vehicles. The combination of manufacturing and purchasing costs, along with the ongoing expenses for maintenance and training, can impose financial burdens on both manufacturers and fire departments. These high investments are expected to hinder market growth.

Surge in the integration of advanced safety features

Manufacturers incorporate safety technologies that are expected to significantly enhance firefighter protection and operational efficiency. The focus of the manufacturers is expected to be on improving features such as ergonomics, vision systems, driving assistance systems (ADAS), collision avoidance systems, and autonomous capabilities. Manufacturers efficiently respond to the changing needs of fire departments, enhance the overall security of their vehicles, and gain a competitive edge in the market by prioritizing the integration of these cutting-edge safety measures. Fire departments and universities are actively testing V2V (Vehicle-to-Vehicle) communication systems for potential integration into their fire truck fleets. This emerging technology holds significant promise for enhancing firefighter safety, particularly during emergency responses. Fire departments have the option to either have the V2V devices installed by the fire truck manufacturer or retrofit them onto existing vehicles at a later stage. By enabling communication between fire trucks and other vehicles on the road, V2V technology has the potential to improve situational awareness, coordination, and response effectiveness, thereby reducing the risks and hazards faced by firefighters while en route to emergency calls. Such factors are anticipated to provide significant opportunities for the growth of the market.
Fire Truck Market

Recent Developments:

  • In June 2023, Rosenbauer International AG delivered two electrically powered basic firefighting vehicles (BLF) through an agreement with the fire department and civil protection of Vienna. It is equipped with a high-voltage battery with a capacity of 66 kWh & 225 kW energy backup system (EBU) for prolonged power outages.
  • In May 2023, Oshkosh Corporation through its subsidiary Pierce Manufacturing Inc. received an order through an agreement from the City of San Diego Fire-Rescue Department. Order includes 18 custom fire apparatus, including 17 Pierce fire trucks and one Frontline Communications mobile command vehicle.
  • In February 2023, Oshkosh Corporation through its subsidiary Pierce Manufacturing Inc. signed a purchase agreement with the City of Madison fire department in Wisconsin for Pierce Volterra Electric Pumper. Pierce Volterra Electric Vehicle Configuration includes custom chassis with seating for six 1,500 GPM single-stage pumps, and a 500-gallon water tank.
  • In April 2023, Scania launched a hybrid system for airport fire trucks, at Interschutz. It is equipped with a 6-liter, up to 770hp combustion engine and 380hp E-machine. The complete hybrid solution enables quicker response time and more sustainable and safe operations.
  • In December 2022, Albert Ziegler GmbH signed an agreement to deliver a new Z6 Airfield and Rescue firefighting (ARFF) vehicle to the International Airport of KoÅ¡ice, Slovakia. The vehicle is built on a TITAN 6x6 chassis T39-770 6x6 and is equipped with a 770 HP Scania V8 engine.
  • In March 2020, NAFFCO delivered six firefighting vehicles through an agreement to Missan Oil Fields in Iraq. The vehicles are a mix of water/foam and water/foam/dry chemical powder configurations. It is built on a Scania 6x4 with automated transmission Opti-cruise and 410 HP engine with water tanks & foam tanks.

The outbreak of COVID-19 resulted in global economic downturn, with many countries experiencing recessions and reduced government budgets. decreased This caused decreased public spending and budget constraints for numerous municipalities and fire departments. However, post-pandemic, economic conditions gradually improved as economies reopened and stabilized. Governments and municipalities regained financial stability, enabling them to allocate funds to essential services, including fire departments. This positive economic shift created a favorable environment for fire departments to consider investing in new fire trucks.

Key Benefits For Stakeholders

  • This report provides a quantitative analysis of the market segments, current trends, estimations, and dynamics of the fire truck market analysis from 2022 to 2032 to identify the prevailing fire truck market opportunities.
  • The market research is offered along with information related to key drivers, restraints, and opportunities.
  • Porter's five forces analysis highlights the potency of buyers and suppliers to enable stakeholders make profit-oriented business decisions and strengthen their supplier-buyer network.
  • In-depth analysis of the fire truck market segmentation assists to determine the prevailing market opportunities.
  • Major countries in each region are mapped according to their revenue contribution to the global market.
  • Market player positioning facilitates benchmarking and provides a clear understanding of the present position of the market players.
  • The report includes the analysis of the regional as well as global fire truck market trends, key players, market segments, application areas, and market growth strategies.

Fire Truck Market Report Highlights

Aspects Details
Market Size By 2032 USD 9.9 billion
Growth Rate CAGR of 5%
Forecast period 2022 - 2032
Report Pages 267
By Type
  • Aerial
  • Pumper
  • Rescue
  • Tanker
  • Others
By Application
  • Residential and Commercial
  • Industrial and Airport
  • Military
  • Others
By Propulsion Type
  • ICE
  • Electric
By Region
  • North America  (U.S., Canada, Mexico)
  • Europe  (UK, Germany, France, Spain, Rest of Europe)
  • Asia-Pacific  (China, Japan, India, South Korea, Rest of Asia-Pacific)
  • LAMEA  (Latin America, Middle East, Africa)
Key Market Players Albert Ziegler GmbH, NAFFCO, Rosenbauer International AG, MORITA HOLDINGS CORPORATION, Alexis Fire Equipment Company, REV Group, Zoomlion Heavy Industry Science &Technology Co., Ltd., Magirus, Scania, Oshkosh Corporation
 
  • CHAPTER 1: INTRODUCTION

    • 1.1. Report description

    • 1.2. Key market segments

    • 1.3. Key benefits to the stakeholders

    • 1.4. Research Methodology

      • 1.4.1. Primary research

      • 1.4.2. Secondary research

      • 1.4.3. Analyst tools and models

  • CHAPTER 2: EXECUTIVE SUMMARY

    • 2.1. CXO Perspective

  • CHAPTER 3: MARKET OVERVIEW

    • 3.1. Market definition and scope

    • 3.2. Key findings

      • 3.2.1. Top impacting factors

      • 3.2.2. Top investment pockets

    • 3.3. Porter’s five forces analysis

      • 3.3.1. Low bargaining power of suppliers

      • 3.3.2. Low threat of new entrants

      • 3.3.3. Low threat of substitutes

      • 3.3.4. Low intensity of rivalry

      • 3.3.5. Low bargaining power of buyers

    • 3.4. Market dynamics

      • 3.4.1. Drivers

        • 3.4.1.1. Rise in replacement of aging fire truck fleets
        • 3.4.1.2. Stringent fire safety regulations
        • 3.4.1.3. Electrification of fire trucks

      • 3.4.2. Restraints

        • 3.4.2.1. Regulatory compliance and safety standards
        • 3.4.2.2. High initial investment

      • 3.4.3. Opportunities

        • 3.4.3.1. Surge in the integration of advanced safety features
        • 3.4.3.2. Technological advancements

    • 3.5. COVID-19 Impact Analysis on the market

  • CHAPTER 4: FIRE TRUCK MARKET, BY TYPE

    • 4.1. Overview

      • 4.1.1. Market size and forecast

    • 4.2. Aerial

      • 4.2.1. Key market trends, growth factors and opportunities

      • 4.2.2. Market size and forecast, by region

      • 4.2.3. Market share analysis by country

    • 4.3. Pumper

      • 4.3.1. Key market trends, growth factors and opportunities

      • 4.3.2. Market size and forecast, by region

      • 4.3.3. Market share analysis by country

    • 4.4. Rescue

      • 4.4.1. Key market trends, growth factors and opportunities

      • 4.4.2. Market size and forecast, by region

      • 4.4.3. Market share analysis by country

    • 4.5. Tanker

      • 4.5.1. Key market trends, growth factors and opportunities

      • 4.5.2. Market size and forecast, by region

      • 4.5.3. Market share analysis by country

    • 4.6. Others

      • 4.6.1. Key market trends, growth factors and opportunities

      • 4.6.2. Market size and forecast, by region

      • 4.6.3. Market share analysis by country

  • CHAPTER 5: FIRE TRUCK MARKET, BY APPLICATION

    • 5.1. Overview

      • 5.1.1. Market size and forecast

    • 5.2. Residential and Commercial

      • 5.2.1. Key market trends, growth factors and opportunities

      • 5.2.2. Market size and forecast, by region

      • 5.2.3. Market share analysis by country

    • 5.3. Industrial and Airport

      • 5.3.1. Key market trends, growth factors and opportunities

      • 5.3.2. Market size and forecast, by region

      • 5.3.3. Market share analysis by country

    • 5.4. Military

      • 5.4.1. Key market trends, growth factors and opportunities

      • 5.4.2. Market size and forecast, by region

      • 5.4.3. Market share analysis by country

    • 5.5. Others

      • 5.5.1. Key market trends, growth factors and opportunities

      • 5.5.2. Market size and forecast, by region

      • 5.5.3. Market share analysis by country

  • CHAPTER 6: FIRE TRUCK MARKET, BY PROPULSION TYPE

    • 6.1. Overview

      • 6.1.1. Market size and forecast

    • 6.2. ICE

      • 6.2.1. Key market trends, growth factors and opportunities

      • 6.2.2. Market size and forecast, by region

      • 6.2.3. Market share analysis by country

    • 6.3. Electric

      • 6.3.1. Key market trends, growth factors and opportunities

      • 6.3.2. Market size and forecast, by region

      • 6.3.3. Market share analysis by country

  • CHAPTER 7: FIRE TRUCK MARKET, BY REGION

    • 7.1. Overview

      • 7.1.1. Market size and forecast By Region

    • 7.2. North America

      • 7.2.1. Key trends and opportunities

      • 7.2.2. Market size and forecast, by Type

      • 7.2.3. Market size and forecast, by Application

      • 7.2.4. Market size and forecast, by Propulsion Type

      • 7.2.5. Market size and forecast, by country

        • 7.2.5.1. U.S.
          • 7.2.5.1.1. Key market trends, growth factors and opportunities
          • 7.2.5.1.2. Market size and forecast, by Type
          • 7.2.5.1.3. Market size and forecast, by Application
          • 7.2.5.1.4. Market size and forecast, by Propulsion Type
        • 7.2.5.2. Canada
          • 7.2.5.2.1. Key market trends, growth factors and opportunities
          • 7.2.5.2.2. Market size and forecast, by Type
          • 7.2.5.2.3. Market size and forecast, by Application
          • 7.2.5.2.4. Market size and forecast, by Propulsion Type
        • 7.2.5.3. Mexico
          • 7.2.5.3.1. Key market trends, growth factors and opportunities
          • 7.2.5.3.2. Market size and forecast, by Type
          • 7.2.5.3.3. Market size and forecast, by Application
          • 7.2.5.3.4. Market size and forecast, by Propulsion Type
    • 7.3. Europe

      • 7.3.1. Key trends and opportunities

      • 7.3.2. Market size and forecast, by Type

      • 7.3.3. Market size and forecast, by Application

      • 7.3.4. Market size and forecast, by Propulsion Type

      • 7.3.5. Market size and forecast, by country

        • 7.3.5.1. UK
          • 7.3.5.1.1. Key market trends, growth factors and opportunities
          • 7.3.5.1.2. Market size and forecast, by Type
          • 7.3.5.1.3. Market size and forecast, by Application
          • 7.3.5.1.4. Market size and forecast, by Propulsion Type
        • 7.3.5.2. Germany
          • 7.3.5.2.1. Key market trends, growth factors and opportunities
          • 7.3.5.2.2. Market size and forecast, by Type
          • 7.3.5.2.3. Market size and forecast, by Application
          • 7.3.5.2.4. Market size and forecast, by Propulsion Type
        • 7.3.5.3. France
          • 7.3.5.3.1. Key market trends, growth factors and opportunities
          • 7.3.5.3.2. Market size and forecast, by Type
          • 7.3.5.3.3. Market size and forecast, by Application
          • 7.3.5.3.4. Market size and forecast, by Propulsion Type
        • 7.3.5.4. Spain
          • 7.3.5.4.1. Key market trends, growth factors and opportunities
          • 7.3.5.4.2. Market size and forecast, by Type
          • 7.3.5.4.3. Market size and forecast, by Application
          • 7.3.5.4.4. Market size and forecast, by Propulsion Type
        • 7.3.5.5. Rest of Europe
          • 7.3.5.5.1. Key market trends, growth factors and opportunities
          • 7.3.5.5.2. Market size and forecast, by Type
          • 7.3.5.5.3. Market size and forecast, by Application
          • 7.3.5.5.4. Market size and forecast, by Propulsion Type
    • 7.4. Asia-Pacific

      • 7.4.1. Key trends and opportunities

      • 7.4.2. Market size and forecast, by Type

      • 7.4.3. Market size and forecast, by Application

      • 7.4.4. Market size and forecast, by Propulsion Type

      • 7.4.5. Market size and forecast, by country

        • 7.4.5.1. China
          • 7.4.5.1.1. Key market trends, growth factors and opportunities
          • 7.4.5.1.2. Market size and forecast, by Type
          • 7.4.5.1.3. Market size and forecast, by Application
          • 7.4.5.1.4. Market size and forecast, by Propulsion Type
        • 7.4.5.2. Japan
          • 7.4.5.2.1. Key market trends, growth factors and opportunities
          • 7.4.5.2.2. Market size and forecast, by Type
          • 7.4.5.2.3. Market size and forecast, by Application
          • 7.4.5.2.4. Market size and forecast, by Propulsion Type
        • 7.4.5.3. India
          • 7.4.5.3.1. Key market trends, growth factors and opportunities
          • 7.4.5.3.2. Market size and forecast, by Type
          • 7.4.5.3.3. Market size and forecast, by Application
          • 7.4.5.3.4. Market size and forecast, by Propulsion Type
        • 7.4.5.4. South Korea
          • 7.4.5.4.1. Key market trends, growth factors and opportunities
          • 7.4.5.4.2. Market size and forecast, by Type
          • 7.4.5.4.3. Market size and forecast, by Application
          • 7.4.5.4.4. Market size and forecast, by Propulsion Type
        • 7.4.5.5. Rest of Asia-Pacific
          • 7.4.5.5.1. Key market trends, growth factors and opportunities
          • 7.4.5.5.2. Market size and forecast, by Type
          • 7.4.5.5.3. Market size and forecast, by Application
          • 7.4.5.5.4. Market size and forecast, by Propulsion Type
    • 7.5. LAMEA

      • 7.5.1. Key trends and opportunities

      • 7.5.2. Market size and forecast, by Type

      • 7.5.3. Market size and forecast, by Application

      • 7.5.4. Market size and forecast, by Propulsion Type

      • 7.5.5. Market size and forecast, by country

        • 7.5.5.1. Latin America
          • 7.5.5.1.1. Key market trends, growth factors and opportunities
          • 7.5.5.1.2. Market size and forecast, by Type
          • 7.5.5.1.3. Market size and forecast, by Application
          • 7.5.5.1.4. Market size and forecast, by Propulsion Type
        • 7.5.5.2. Middle East
          • 7.5.5.2.1. Key market trends, growth factors and opportunities
          • 7.5.5.2.2. Market size and forecast, by Type
          • 7.5.5.2.3. Market size and forecast, by Application
          • 7.5.5.2.4. Market size and forecast, by Propulsion Type
        • 7.5.5.3. Africa
          • 7.5.5.3.1. Key market trends, growth factors and opportunities
          • 7.5.5.3.2. Market size and forecast, by Type
          • 7.5.5.3.3. Market size and forecast, by Application
          • 7.5.5.3.4. Market size and forecast, by Propulsion Type
  • CHAPTER 8: COMPETITIVE LANDSCAPE

    • 8.1. Introduction

    • 8.2. Top winning strategies

    • 8.3. Product Mapping of Top 10 Player

    • 8.4. Competitive Dashboard

    • 8.5. Competitive Heatmap

    • 8.6. Top player positioning, 2022

  • CHAPTER 9: COMPANY PROFILES

    • 9.1. MORITA HOLDINGS CORPORATION

      • 9.1.1. Company overview

      • 9.1.2. Key Executives

      • 9.1.3. Company snapshot

      • 9.1.4. Operating business segments

      • 9.1.5. Product portfolio

      • 9.1.6. Business performance

    • 9.2. Rosenbauer International AG

      • 9.2.1. Company overview

      • 9.2.2. Key Executives

      • 9.2.3. Company snapshot

      • 9.2.4. Operating business segments

      • 9.2.5. Product portfolio

      • 9.2.6. Business performance

      • 9.2.7. Key strategic moves and developments

    • 9.3. Oshkosh Corporation

      • 9.3.1. Company overview

      • 9.3.2. Key Executives

      • 9.3.3. Company snapshot

      • 9.3.4. Operating business segments

      • 9.3.5. Product portfolio

      • 9.3.6. Business performance

      • 9.3.7. Key strategic moves and developments

    • 9.4. Alexis Fire Equipment Company

      • 9.4.1. Company overview

      • 9.4.2. Key Executives

      • 9.4.3. Company snapshot

      • 9.4.4. Operating business segments

      • 9.4.5. Product portfolio

    • 9.5. Scania

      • 9.5.1. Company overview

      • 9.5.2. Key Executives

      • 9.5.3. Company snapshot

      • 9.5.4. Operating business segments

      • 9.5.5. Product portfolio

      • 9.5.6. Business performance

      • 9.5.7. Key strategic moves and developments

    • 9.6. Zoomlion Heavy Industry Science &Technology Co., Ltd.

      • 9.6.1. Company overview

      • 9.6.2. Key Executives

      • 9.6.3. Company snapshot

      • 9.6.4. Operating business segments

      • 9.6.5. Product portfolio

      • 9.6.6. Business performance

    • 9.7. REV Group

      • 9.7.1. Company overview

      • 9.7.2. Key Executives

      • 9.7.3. Company snapshot

      • 9.7.4. Operating business segments

      • 9.7.5. Product portfolio

      • 9.7.6. Business performance

      • 9.7.7. Key strategic moves and developments

    • 9.8. NAFFCO

      • 9.8.1. Company overview

      • 9.8.2. Key Executives

      • 9.8.3. Company snapshot

      • 9.8.4. Operating business segments

      • 9.8.5. Product portfolio

      • 9.8.6. Key strategic moves and developments

    • 9.9. Albert Ziegler GmbH

      • 9.9.1. Company overview

      • 9.9.2. Key Executives

      • 9.9.3. Company snapshot

      • 9.9.4. Operating business segments

      • 9.9.5. Product portfolio

      • 9.9.6. Business performance

      • 9.9.7. Key strategic moves and developments

    • 9.10. Magirus

      • 9.10.1. Company overview

      • 9.10.2. Key Executives

      • 9.10.3. Company snapshot

      • 9.10.4. Operating business segments

      • 9.10.5. Product portfolio

      • 9.10.6. Business performance

  • LIST OF TABLES

  • TABLE 01. GLOBAL FIRE TRUCK MARKET, BY TYPE, 2022-2032 ($MILLION)
    TABLE 02. FIRE TRUCK MARKET FOR AERIAL, BY REGION, 2022-2032 ($MILLION)
    TABLE 03. FIRE TRUCK MARKET FOR PUMPER, BY REGION, 2022-2032 ($MILLION)
    TABLE 04. FIRE TRUCK MARKET FOR RESCUE, BY REGION, 2022-2032 ($MILLION)
    TABLE 05. FIRE TRUCK MARKET FOR TANKER, BY REGION, 2022-2032 ($MILLION)
    TABLE 06. FIRE TRUCK MARKET FOR OTHERS, BY REGION, 2022-2032 ($MILLION)
    TABLE 07. GLOBAL FIRE TRUCK MARKET, BY APPLICATION, 2022-2032 ($MILLION)
    TABLE 08. FIRE TRUCK MARKET FOR RESIDENTIAL AND COMMERCIAL, BY REGION, 2022-2032 ($MILLION)
    TABLE 09. FIRE TRUCK MARKET FOR INDUSTRIAL AND AIRPORT, BY REGION, 2022-2032 ($MILLION)
    TABLE 10. FIRE TRUCK MARKET FOR MILITARY, BY REGION, 2022-2032 ($MILLION)
    TABLE 11. FIRE TRUCK MARKET FOR OTHERS, BY REGION, 2022-2032 ($MILLION)
    TABLE 12. GLOBAL FIRE TRUCK MARKET, BY PROPULSION TYPE, 2022-2032 ($MILLION)
    TABLE 13. FIRE TRUCK MARKET FOR ICE, BY REGION, 2022-2032 ($MILLION)
    TABLE 14. FIRE TRUCK MARKET FOR ELECTRIC, BY REGION, 2022-2032 ($MILLION)
    TABLE 15. FIRE TRUCK MARKET, BY REGION, 2022-2032 ($MILLION)
    TABLE 16. NORTH AMERICA FIRE TRUCK MARKET, BY TYPE, 2022-2032 ($MILLION)
    TABLE 17. NORTH AMERICA FIRE TRUCK MARKET, BY APPLICATION, 2022-2032 ($MILLION)
    TABLE 18. NORTH AMERICA FIRE TRUCK MARKET, BY PROPULSION TYPE, 2022-2032 ($MILLION)
    TABLE 19. NORTH AMERICA FIRE TRUCK MARKET, BY COUNTRY, 2022-2032 ($MILLION)
    TABLE 20. U.S. FIRE TRUCK MARKET, BY TYPE, 2022-2032 ($MILLION)
    TABLE 21. U.S. FIRE TRUCK MARKET, BY APPLICATION, 2022-2032 ($MILLION)
    TABLE 22. U.S. FIRE TRUCK MARKET, BY PROPULSION TYPE, 2022-2032 ($MILLION)
    TABLE 23. CANADA FIRE TRUCK MARKET, BY TYPE, 2022-2032 ($MILLION)
    TABLE 24. CANADA FIRE TRUCK MARKET, BY APPLICATION, 2022-2032 ($MILLION)
    TABLE 25. CANADA FIRE TRUCK MARKET, BY PROPULSION TYPE, 2022-2032 ($MILLION)
    TABLE 26. MEXICO FIRE TRUCK MARKET, BY TYPE, 2022-2032 ($MILLION)
    TABLE 27. MEXICO FIRE TRUCK MARKET, BY APPLICATION, 2022-2032 ($MILLION)
    TABLE 28. MEXICO FIRE TRUCK MARKET, BY PROPULSION TYPE, 2022-2032 ($MILLION)
    TABLE 29. EUROPE FIRE TRUCK MARKET, BY TYPE, 2022-2032 ($MILLION)
    TABLE 30. EUROPE FIRE TRUCK MARKET, BY APPLICATION, 2022-2032 ($MILLION)
    TABLE 31. EUROPE FIRE TRUCK MARKET, BY PROPULSION TYPE, 2022-2032 ($MILLION)
    TABLE 32. EUROPE FIRE TRUCK MARKET, BY COUNTRY, 2022-2032 ($MILLION)
    TABLE 33. UK FIRE TRUCK MARKET, BY TYPE, 2022-2032 ($MILLION)
    TABLE 34. UK FIRE TRUCK MARKET, BY APPLICATION, 2022-2032 ($MILLION)
    TABLE 35. UK FIRE TRUCK MARKET, BY PROPULSION TYPE, 2022-2032 ($MILLION)
    TABLE 36. GERMANY FIRE TRUCK MARKET, BY TYPE, 2022-2032 ($MILLION)
    TABLE 37. GERMANY FIRE TRUCK MARKET, BY APPLICATION, 2022-2032 ($MILLION)
    TABLE 38. GERMANY FIRE TRUCK MARKET, BY PROPULSION TYPE, 2022-2032 ($MILLION)
    TABLE 39. FRANCE FIRE TRUCK MARKET, BY TYPE, 2022-2032 ($MILLION)
    TABLE 40. FRANCE FIRE TRUCK MARKET, BY APPLICATION, 2022-2032 ($MILLION)
    TABLE 41. FRANCE FIRE TRUCK MARKET, BY PROPULSION TYPE, 2022-2032 ($MILLION)
    TABLE 42. SPAIN FIRE TRUCK MARKET, BY TYPE, 2022-2032 ($MILLION)
    TABLE 43. SPAIN FIRE TRUCK MARKET, BY APPLICATION, 2022-2032 ($MILLION)
    TABLE 44. SPAIN FIRE TRUCK MARKET, BY PROPULSION TYPE, 2022-2032 ($MILLION)
    TABLE 45. REST OF EUROPE FIRE TRUCK MARKET, BY TYPE, 2022-2032 ($MILLION)
    TABLE 46. REST OF EUROPE FIRE TRUCK MARKET, BY APPLICATION, 2022-2032 ($MILLION)
    TABLE 47. REST OF EUROPE FIRE TRUCK MARKET, BY PROPULSION TYPE, 2022-2032 ($MILLION)
    TABLE 48. ASIA-PACIFIC FIRE TRUCK MARKET, BY TYPE, 2022-2032 ($MILLION)
    TABLE 49. ASIA-PACIFIC FIRE TRUCK MARKET, BY APPLICATION, 2022-2032 ($MILLION)
    TABLE 50. ASIA-PACIFIC FIRE TRUCK MARKET, BY PROPULSION TYPE, 2022-2032 ($MILLION)
    TABLE 51. ASIA-PACIFIC FIRE TRUCK MARKET, BY COUNTRY, 2022-2032 ($MILLION)
    TABLE 52. CHINA FIRE TRUCK MARKET, BY TYPE, 2022-2032 ($MILLION)
    TABLE 53. CHINA FIRE TRUCK MARKET, BY APPLICATION, 2022-2032 ($MILLION)
    TABLE 54. CHINA FIRE TRUCK MARKET, BY PROPULSION TYPE, 2022-2032 ($MILLION)
    TABLE 55. JAPAN FIRE TRUCK MARKET, BY TYPE, 2022-2032 ($MILLION)
    TABLE 56. JAPAN FIRE TRUCK MARKET, BY APPLICATION, 2022-2032 ($MILLION)
    TABLE 57. JAPAN FIRE TRUCK MARKET, BY PROPULSION TYPE, 2022-2032 ($MILLION)
    TABLE 58. INDIA FIRE TRUCK MARKET, BY TYPE, 2022-2032 ($MILLION)
    TABLE 59. INDIA FIRE TRUCK MARKET, BY APPLICATION, 2022-2032 ($MILLION)
    TABLE 60. INDIA FIRE TRUCK MARKET, BY PROPULSION TYPE, 2022-2032 ($MILLION)
    TABLE 61. SOUTH KOREA FIRE TRUCK MARKET, BY TYPE, 2022-2032 ($MILLION)
    TABLE 62. SOUTH KOREA FIRE TRUCK MARKET, BY APPLICATION, 2022-2032 ($MILLION)
    TABLE 63. SOUTH KOREA FIRE TRUCK MARKET, BY PROPULSION TYPE, 2022-2032 ($MILLION)
    TABLE 64. REST OF ASIA-PACIFIC FIRE TRUCK MARKET, BY TYPE, 2022-2032 ($MILLION)
    TABLE 65. REST OF ASIA-PACIFIC FIRE TRUCK MARKET, BY APPLICATION, 2022-2032 ($MILLION)
    TABLE 66. REST OF ASIA-PACIFIC FIRE TRUCK MARKET, BY PROPULSION TYPE, 2022-2032 ($MILLION)
    TABLE 67. LAMEA FIRE TRUCK MARKET, BY TYPE, 2022-2032 ($MILLION)
    TABLE 68. LAMEA FIRE TRUCK MARKET, BY APPLICATION, 2022-2032 ($MILLION)
    TABLE 69. LAMEA FIRE TRUCK MARKET, BY PROPULSION TYPE, 2022-2032 ($MILLION)
    TABLE 70. LAMEA FIRE TRUCK MARKET, BY COUNTRY, 2022-2032 ($MILLION)
    TABLE 71. LATIN AMERICA FIRE TRUCK MARKET, BY TYPE, 2022-2032 ($MILLION)
    TABLE 72. LATIN AMERICA FIRE TRUCK MARKET, BY APPLICATION, 2022-2032 ($MILLION)
    TABLE 73. LATIN AMERICA FIRE TRUCK MARKET, BY PROPULSION TYPE, 2022-2032 ($MILLION)
    TABLE 74. MIDDLE EAST FIRE TRUCK MARKET, BY TYPE, 2022-2032 ($MILLION)
    TABLE 75. MIDDLE EAST FIRE TRUCK MARKET, BY APPLICATION, 2022-2032 ($MILLION)
    TABLE 76. MIDDLE EAST FIRE TRUCK MARKET, BY PROPULSION TYPE, 2022-2032 ($MILLION)
    TABLE 77. AFRICA FIRE TRUCK MARKET, BY TYPE, 2022-2032 ($MILLION)
    TABLE 78. AFRICA FIRE TRUCK MARKET, BY APPLICATION, 2022-2032 ($MILLION)
    TABLE 79. AFRICA FIRE TRUCK MARKET, BY PROPULSION TYPE, 2022-2032 ($MILLION)
    TABLE 80. MORITA HOLDINGS CORPORATION: KEY EXECUTIVES
    TABLE 81. MORITA HOLDINGS CORPORATION: COMPANY SNAPSHOT
    TABLE 82. MORITA HOLDINGS CORPORATION: PRODUCT SEGMENTS
    TABLE 83. MORITA HOLDINGS CORPORATION: PRODUCT PORTFOLIO
    TABLE 84. ROSENBAUER INTERNATIONAL AG: KEY EXECUTIVES
    TABLE 85. ROSENBAUER INTERNATIONAL AG: COMPANY SNAPSHOT
    TABLE 86. ROSENBAUER INTERNATIONAL AG: PRODUCT SEGMENTS
    TABLE 87. ROSENBAUER INTERNATIONAL AG: PRODUCT PORTFOLIO
    TABLE 88. ROSENBAUER INTERNATIONAL AG: KEY STRATERGIES
    TABLE 89. OSHKOSH CORPORATION: KEY EXECUTIVES
    TABLE 90. OSHKOSH CORPORATION: COMPANY SNAPSHOT
    TABLE 91. OSHKOSH CORPORATION: PRODUCT SEGMENTS
    TABLE 92. OSHKOSH CORPORATION: PRODUCT PORTFOLIO
    TABLE 93. OSHKOSH CORPORATION: KEY STRATERGIES
    TABLE 94. ALEXIS FIRE EQUIPMENT COMPANY: KEY EXECUTIVES
    TABLE 95. ALEXIS FIRE EQUIPMENT COMPANY: COMPANY SNAPSHOT
    TABLE 96. ALEXIS FIRE EQUIPMENT COMPANY: PRODUCT SEGMENTS
    TABLE 97. ALEXIS FIRE EQUIPMENT COMPANY: SERVICE SEGMENTS
    TABLE 98. ALEXIS FIRE EQUIPMENT COMPANY: PRODUCT PORTFOLIO
    TABLE 99. SCANIA: KEY EXECUTIVES
    TABLE 100. SCANIA: COMPANY SNAPSHOT
    TABLE 101. SCANIA: PRODUCT SEGMENTS
    TABLE 102. SCANIA: PRODUCT PORTFOLIO
    TABLE 103. SCANIA: KEY STRATERGIES
    TABLE 104. ZOOMLION HEAVY INDUSTRY SCIENCE &TECHNOLOGY CO., LTD.: KEY EXECUTIVES
    TABLE 105. ZOOMLION HEAVY INDUSTRY SCIENCE &TECHNOLOGY CO., LTD.: COMPANY SNAPSHOT
    TABLE 106. ZOOMLION HEAVY INDUSTRY SCIENCE &TECHNOLOGY CO., LTD.: PRODUCT SEGMENTS
    TABLE 107. ZOOMLION HEAVY INDUSTRY SCIENCE &TECHNOLOGY CO., LTD.: PRODUCT PORTFOLIO
    TABLE 108. REV GROUP: KEY EXECUTIVES
    TABLE 109. REV GROUP: COMPANY SNAPSHOT
    TABLE 110. REV GROUP: PRODUCT SEGMENTS
    TABLE 111. REV GROUP: PRODUCT PORTFOLIO
    TABLE 112. REV GROUP: KEY STRATERGIES
    TABLE 113. NAFFCO: KEY EXECUTIVES
    TABLE 114. NAFFCO: COMPANY SNAPSHOT
    TABLE 115. NAFFCO: PRODUCT SEGMENTS
    TABLE 116. NAFFCO: PRODUCT PORTFOLIO
    TABLE 117. NAFFCO: KEY STRATERGIES
    TABLE 118. ALBERT ZIEGLER GMBH: KEY EXECUTIVES
    TABLE 119. ALBERT ZIEGLER GMBH: COMPANY SNAPSHOT
    TABLE 120. ALBERT ZIEGLER GMBH: PRODUCT SEGMENTS
    TABLE 121. ALBERT ZIEGLER GMBH: PRODUCT PORTFOLIO
    TABLE 122. ALBERT ZIEGLER GMBH: KEY STRATERGIES
    TABLE 123. MAGIRUS: KEY EXECUTIVES
    TABLE 124. MAGIRUS: COMPANY SNAPSHOT
    TABLE 125. MAGIRUS: PRODUCT SEGMENTS
    TABLE 126. MAGIRUS: PRODUCT PORTFOLIO
  • LIST OF FIGURES

  • FIGURE 01. FIRE TRUCK MARKET, 2022-2032
    FIGURE 02. SEGMENTATION OF FIRE TRUCK MARKET,2022-2032
    FIGURE 03. TOP INVESTMENT POCKETS IN FIRE TRUCK MARKET (2023-2032)
    FIGURE 04. LOW BARGAINING POWER OF SUPPLIERS
    FIGURE 05. LOW THREAT OF NEW ENTRANTS
    FIGURE 06. LOW THREAT OF SUBSTITUTES
    FIGURE 07. LOW INTENSITY OF RIVALRY
    FIGURE 08. LOW BARGAINING POWER OF BUYERS
    FIGURE 09. GLOBAL FIRE TRUCK MARKET:DRIVERS, RESTRAINTS AND OPPORTUNITIES
    FIGURE 10. FIRE TRUCK MARKET, BY TYPE, 2022(%)
    FIGURE 11. COMPARATIVE SHARE ANALYSIS OF FIRE TRUCK MARKET FOR AERIAL, BY COUNTRY 2022 AND 2032(%)
    FIGURE 12. COMPARATIVE SHARE ANALYSIS OF FIRE TRUCK MARKET FOR PUMPER, BY COUNTRY 2022 AND 2032(%)
    FIGURE 13. COMPARATIVE SHARE ANALYSIS OF FIRE TRUCK MARKET FOR RESCUE, BY COUNTRY 2022 AND 2032(%)
    FIGURE 14. COMPARATIVE SHARE ANALYSIS OF FIRE TRUCK MARKET FOR TANKER, BY COUNTRY 2022 AND 2032(%)
    FIGURE 15. COMPARATIVE SHARE ANALYSIS OF FIRE TRUCK MARKET FOR OTHERS, BY COUNTRY 2022 AND 2032(%)
    FIGURE 16. FIRE TRUCK MARKET, BY APPLICATION, 2022(%)
    FIGURE 17. COMPARATIVE SHARE ANALYSIS OF FIRE TRUCK MARKET FOR RESIDENTIAL AND COMMERCIAL, BY COUNTRY 2022 AND 2032(%)
    FIGURE 18. COMPARATIVE SHARE ANALYSIS OF FIRE TRUCK MARKET FOR INDUSTRIAL AND AIRPORT, BY COUNTRY 2022 AND 2032(%)
    FIGURE 19. COMPARATIVE SHARE ANALYSIS OF FIRE TRUCK MARKET FOR MILITARY, BY COUNTRY 2022 AND 2032(%)
    FIGURE 20. COMPARATIVE SHARE ANALYSIS OF FIRE TRUCK MARKET FOR OTHERS, BY COUNTRY 2022 AND 2032(%)
    FIGURE 21. FIRE TRUCK MARKET, BY PROPULSION TYPE, 2022(%)
    FIGURE 22. COMPARATIVE SHARE ANALYSIS OF FIRE TRUCK MARKET FOR ICE, BY COUNTRY 2022 AND 2032(%)
    FIGURE 23. COMPARATIVE SHARE ANALYSIS OF FIRE TRUCK MARKET FOR ELECTRIC, BY COUNTRY 2022 AND 2032(%)
    FIGURE 24. FIRE TRUCK MARKET BY REGION, 2022(%)
    FIGURE 25. U.S. FIRE TRUCK MARKET, 2022-2032 ($MILLION)
    FIGURE 26. CANADA FIRE TRUCK MARKET, 2022-2032 ($MILLION)
    FIGURE 27. MEXICO FIRE TRUCK MARKET, 2022-2032 ($MILLION)
    FIGURE 28. UK FIRE TRUCK MARKET, 2022-2032 ($MILLION)
    FIGURE 29. GERMANY FIRE TRUCK MARKET, 2022-2032 ($MILLION)
    FIGURE 30. FRANCE FIRE TRUCK MARKET, 2022-2032 ($MILLION)
    FIGURE 31. SPAIN FIRE TRUCK MARKET, 2022-2032 ($MILLION)
    FIGURE 32. REST OF EUROPE FIRE TRUCK MARKET, 2022-2032 ($MILLION)
    FIGURE 33. CHINA FIRE TRUCK MARKET, 2022-2032 ($MILLION)
    FIGURE 34. JAPAN FIRE TRUCK MARKET, 2022-2032 ($MILLION)
    FIGURE 35. INDIA FIRE TRUCK MARKET, 2022-2032 ($MILLION)
    FIGURE 36. SOUTH KOREA FIRE TRUCK MARKET, 2022-2032 ($MILLION)
    FIGURE 37. REST OF ASIA-PACIFIC FIRE TRUCK MARKET, 2022-2032 ($MILLION)
    FIGURE 38. LATIN AMERICA FIRE TRUCK MARKET, 2022-2032 ($MILLION)
    FIGURE 39. MIDDLE EAST FIRE TRUCK MARKET, 2022-2032 ($MILLION)
    FIGURE 40. AFRICA FIRE TRUCK MARKET, 2022-2032 ($MILLION)
    FIGURE 41. TOP WINNING STRATEGIES, BY YEAR
    FIGURE 42. TOP WINNING STRATEGIES, BY DEVELOPMENT
    FIGURE 43. TOP WINNING STRATEGIES, BY COMPANY
    FIGURE 44. PRODUCT MAPPING OF TOP 10 PLAYERS
    FIGURE 45. COMPETITIVE DASHBOARD
    FIGURE 46. COMPETITIVE HEATMAP: FIRE TRUCK MARKET
    FIGURE 47. TOP PLAYER POSITIONING, 2022
    FIGURE 48. MORITA HOLDINGS CORPORATION: NET SALES, 2020-2022 ($MILLION)
    FIGURE 49. MORITA HOLDINGS CORPORATION: REVENUE SHARE BY SEGMENT, 2022 (%)
    FIGURE 50. ROSENBAUER INTERNATIONAL AG: NET SALES, 2020-2022 ($MILLION)
    FIGURE 51. ROSENBAUER INTERNATIONAL AG: RESEARCH & DEVELOPMENT EXPENDITURE, 2020-2022 ($MILLION)
    FIGURE 52. ROSENBAUER INTERNATIONAL AG: REVENUE SHARE BY SEGMENT, 2022 (%)
    FIGURE 53. ROSENBAUER INTERNATIONAL AG: REVENUE SHARE BY REGION, 2022 (%)
    FIGURE 54. OSHKOSH CORPORATION: NET SALES, 2020-2022 ($MILLION)
    FIGURE 55. OSHKOSH CORPORATION: RESEARCH & DEVELOPMENT EXPENDITURE, 2020-2022 ($MILLION)
    FIGURE 56. OSHKOSH CORPORATION: REVENUE SHARE BY REGION, 2022 (%)
    FIGURE 57. OSHKOSH CORPORATION: REVENUE SHARE BY SEGMENT, 2022 (%)
    FIGURE 58. SCANIA: RESEARCH & DEVELOPMENT EXPENDITURE, 2020-2022 ($MILLION)
    FIGURE 59. SCANIA: NET SALES, 2020-2022 ($MILLION)
    FIGURE 60. SCANIA: REVENUE SHARE BY SEGMENT, 2022 (%)
    FIGURE 61. SCANIA: REVENUE SHARE BY REGION, 2022 (%)
    FIGURE 62. ZOOMLION HEAVY INDUSTRY SCIENCE &TECHNOLOGY CO., LTD.: RESEARCH & DEVELOPMENT EXPENDITURE, 2020-2022
    FIGURE 63. ZOOMLION HEAVY INDUSTRY SCIENCE &TECHNOLOGY CO., LTD.: NET SALES, 2020-2022 ($MILLION)
    FIGURE 64. ZOOMLION HEAVY INDUSTRY SCIENCE &TECHNOLOGY CO., LTD.: REVENUE SHARE BY SEGMENT, 2022 (%)
    FIGURE 65. ZOOMLION HEAVY INDUSTRY SCIENCE &TECHNOLOGY CO., LTD.: REVENUE SHARE BY REGION, 2022 (%)
    FIGURE 66. REV GROUP: NET SALES, 2019-2021 ($MILLION)
    FIGURE 67. REV GROUP: RESEARCH & DEVELOPMENT EXPENDITURE, 2019-2021 ($MILLION)
    FIGURE 68. REV GROUP: REVENUE SHARE BY SEGMENT, 2021 (%)
    FIGURE 69. REV GROUP: REVENUE SHARE BY REGION, 2021 (%)
    FIGURE 70. ALBERT ZIEGLER GMBH: RESEARCH & DEVELOPMENT EXPENDITURE, 2020-2022 ($MILLION)
    FIGURE 71. ALBERT ZIEGLER GMBH: NET SALES, 2020-2022 ($MILLION)
    FIGURE 72. ALBERT ZIEGLER GMBH: REVENUE SHARE BY SEGMENT, 2022 (%)
    FIGURE 73. ALBERT ZIEGLER GMBH: REVENUE SHARE BY REGION, 2022 (%)
    FIGURE 74. MAGIRUS: NET SALES, 2020-2022 ($MILLION)
    FIGURE 75. MAGIRUS: RESEARCH & DEVELOPMENT EXPENDITURE, 2020-2022 ($MILLION)
    FIGURE 76. MAGIRUS: REVENUE SHARE BY SEGMENT, 2022 (%)
    FIGURE 77. MAGIRUS: REVENUE SHARE BY REGION, 2022 (%)


PURCHASE OPTIONS

Call or Email us

U.S.-Canada Toll-free: +1-800-792-5285
Int'l : +1-503-894-6022
Europe : +44-845-528-1300
Email : help@alliedmarketresearch.com
 
FREQUENTLY ASKED QUESTIONS?

A. The top companies to hold the market share in fire truck are Oshkosh Corporation, MORITA HOLDINGS CORPORATION, Rosenbauer International AG, Alexis Fire Equipment Company, Scania, Zoomlion Heavy Industry Science & Technology Co., Ltd., NAFFCO, REV Group, Magirus, and Albert Ziegler GmbH

A. The estimated industry size of fire truck is $6.20 billion in 2022.

A. The largest regional market for fire truck is Asia-Pacific.

A. The leading application of fire truck market is residential and commercial.

A. The upcoming trends of the fire truck market in the world are surge in the integration of advanced safety features, and technological advancements.

Looking for Customization?

 Customization Request

Have a Question?

 Speak with Analyst

Any Confusion?

 Inquire Before Buying

Have a glance of the Report

  Request Sample
RELATED TAGS

Purchase Full Report of
Fire Truck Market

Start reading instantly.
This Report and over 68,247+ more Reports, Available with Avenue Library. T&C*.

  • Online Only
  • $3,570
  • Online cloud access only
  • Restricted print, copy, paste & download
  • Read only
  • Free industry update
    (Within 180 days)
  • Free report update in next update cycle
    (Jul 2024 - Jul 2025)
  • Data Pack
  • $3,840
  • Restricted to one authorized user
  • One print only
  • Available in
    Excel
  • Free industry update
    (Within 180 days)
  •   Free report update in next update cycle
    (Jul 2024 - Jul 2025)
  • Single User
  • $5,730
  • Restricted to one authorized user
  • One print only
  • Available in
    PDF
  • Free industry update
    (Within 180 days)
  •   Free report update in next update cycle
    (Jul 2024 - Jul 2025)
  • Five Users
  • $6,450
  • Limited to five authorized users
  • Print upto five copies
  • Available in
    PDF
  • Free industry update
    (Within 180 days)
  •   Free report update in next update cycle
    (Jul 2024 - Jul 2025)
  • Enterprise
    License/PDF

  • $9,600
  • Unlimited
    within
    company/enterprise
  • Available in Excel & PDF
  • Free industry update
    (Within 180 days)
  •   Free report update in next update cycle
    (Jul 2024 - Jul 2025)
  • Library
    Membership

  • $999 $ 1,175
    Per User/ Per month/ Billed annually
  • Published Content
    E-access
  • Company Profiles
    E-access
  • Newly Added Content Access
  • 10 PDF
    Downloads
  • 5 Excel Data
    Pack Downloads
  • 250 Company Profiles PDF Downloads
  • Buy Now

*Taxes/Fees, if applicable will be added during checkout. All prices in USD

RELATED REPORTS
 

Why Allied Market Research?


Infallible Methodology

To ensure high-level data integrity, accurate analysis, and impeccable forecasts

Analyst Support

For complete satisfaction

Customization

On-demand customization of scope of the report to exactly meet your needs

TARGETED MARKET VIEW

Targeted market view to provide pertinent information and save time of readers

Get fresh content delivered

Get insights on topics that are crucial for your business. Stay abreast of your interest areas.

Get Industry Data Alerts

Why Allied Market Research?

Infallible Methodology

To ensure high-level data integrity, accurate analysis, and impeccable forecasts

Analyst Support

For complete satisfaction

Customization

On-demand customization of scope of the report to exactly meet your needs

TARGETED MARKET VIEW

Targeted market view to provide pertinent information and save time of readers