A03918 | Pages: 231 | Jan 2018 | 23858 Views | | |
Author(s) : Akhila Prasannan | Tables: 86 | Charts: 63 |
|
Pandemic disrupted the entire world and affected many industries.
Get detailed COVID-19 impact analysis on the Fitness And Recreational Sports Centers Market
Request Now !
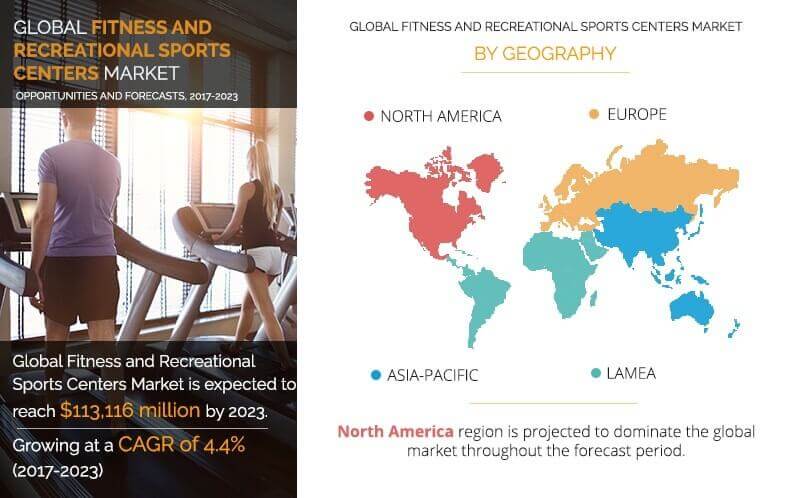
The Global Fitness And Recreational Sports Centers Market size was $83,680 million in 2016, and is expected to reach $113,116 million by 2023, registering a CAGR of 4.4% from 2017 to 2023. Fitness and recreational sports centers comprise establishments or facilities that have equipment for exercising and other active physical fitness conditioning activities such as skating, swimming, or racquet sports.
The growth of the global fitness and recreational sports center market is driven by factors such as surge in middle class population, shift in consumer preference toward better health, and increase in incidence of obesity. In addition, government support for health & fitness and availability of a variety of equipment & personalized fitness training programs at fitness and recreation sports centers have supplemented the market growth. However, high investment cost for opening fitness centers, high membership fees, and sedentary lifestyle are anticipated to hamper the market growth. The impact of the driving factors is expected to surpass that of the restraints. Conversely, growth in youth population across emerging countries and surge in business innovations and acquisitions & expansions in the industry are expected to offer lucrative opportunities for the global market.
The report analyzes the global fitness and recreational sports center market on the basis of type, age group, and geography. The global market is segmented based on type as gymnasiums, yoga, aerobic dance, handball sports, racquet sports, skating, swimming, and others. By age group, it is classified into 35 & younger, 35-54, and 55 & older. The report includes the revenue generated from fitness and recreational sports centers across North America, Europe, Asia-Pacific, and LAMEA.
Get more information on this report : Request Sample Pages
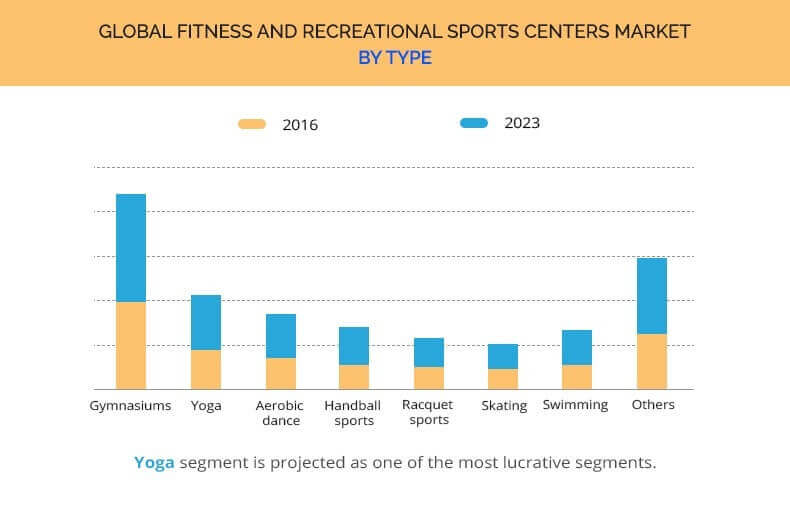
The Global Fitness And Recreational Sports Centers Market is highly fragmented, and hence its growth is stagnated. However, the market is anticipated to witness high end-to-end overall growth in the near future, owing to increase in awareness for fitness among the young population. The fitness and recreational sports centers include gymnasiums, yoga, aerobic dance, handball sports, racquet sports, skating, swimming, and others. These centers have helped the population attain their fitness goals and also to manage their health concerns.
Get more information on this report : Request Sample Pages
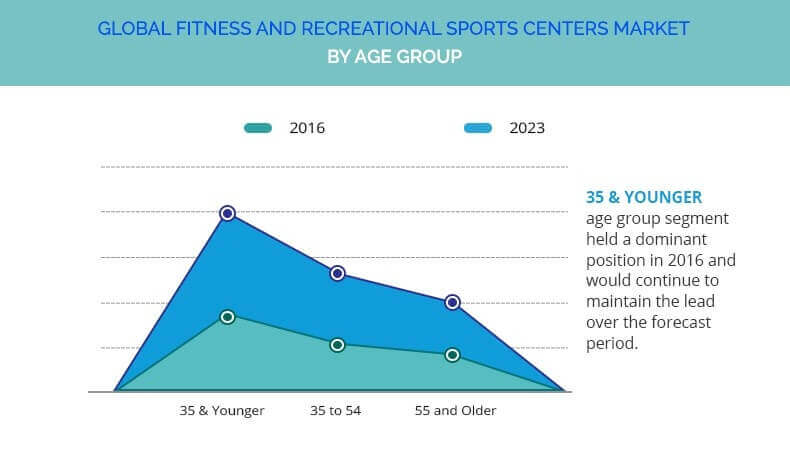
In the past decade, the global fitness and recreational sports centers industry experienced a substantial growth. This is attributed to the fact that the aging population encouraged health and fitness clubs to widen their target demographic beyond the traditional market of 18-35 year old. Industry operators are gradually expanding their target market to include 35 to 54-year-olds and individuals aged under 18. Approximately 40% of fitness and recreational sports center members are female, a proportion that has increased in recent years. The growth of female participation is likely a result of rise in number of female-only health club facilities. Depending on age group, the global market is fragmented into 35 & younger, 35-54, and 55 to older.
Get more information on this report : Request Sample Pages
The fitness and recreational sports center scenario varies across regions, and is majorly dependent on factors such as health awareness, lifestyle disease incidence, young population, and per capita income. Various types of fitness and recreational centers such as yoga, aerobic dance, and gymnasiums are preferred in different geographical regions due to the difference in consumer preferences.
The key players in the global fitness and recreational sports centers market have strategically focused on expansion to gain significant share in the market.
The key players profiled in the report are:
Key Benefits for Stakeholders
Key Market Segments
Key Market Players
CHAPTER 1 INTRODUCTION
1.1. REPORT DESCRIPTION
1.2. KEY BENEFITS
1.3. KEY MARKET SEGMENTS
1.4. RESEARCH METHODOLOGY
1.4.1. Primary research
1.4.2. Secondary research
1.4.3. Analyst tools and models
CHAPTER 2 EXECUTIVE SUMMARY
2.1. MARKET SNAPSHOT
2.2. CXO PERSPECTIVE
CHAPTER 3 MARKET OVERVIEW
3.1. MARKET DEFINITION AND SCOPE
3.2. KEY FINDINGS
3.2.1. Top investment pockets
3.2.2. Top winning strategies
3.3. MARKET SHARE ANALYSIS, 2016 (%)
3.3.1. By type
3.3.2. By age group
3.3.3. By geography
3.3.4. By companies
3.4. PORTER'S FIVE FORCES ANALYSIS
3.4.1. Bargaining power of suppliers
3.4.2. Bargaining power of buyers
3.4.3. Threat of new entrants
3.4.4. Threat of substitutes
3.4.5. Competitive rivalry
3.5. MARKET DYNAMICS
3.5.1. Drivers
3.5.1.1. Growing middle class population
3.5.1.2. Shift in consumer preference toward wellbeing
3.5.1.3. Increase in obesity problems
3.5.1.4. Government support for health & fitness
3.5.1.5. Availability of variety of equipment & personalized fitness training programs
3.5.2. Restraints
3.5.2.1. High investment cost for opening fitness & recreational sports centers
3.5.2.2. High membership price
3.5.2.3. Busy work schedules
3.5.3. Opportunities
3.5.3.1. Growing youth population in developing countries
3.5.3.2. Businesses are innovating to serve expanding base of consumers
3.5.3.3. Acquisitions & Expansions in Asia-Pacific region
CHAPTER 4 FITNESS AND RECREATIONAL SPORTS CENTERS MARKET, BY TYPE
4.1. OVERVIEW
4.2. GYMNASIUMS
4.2.1. Key market trends
4.2.2. Growth factors and opportunities
4.2.3. Market size and forecast, by region
4.2.4. Market size and forecast, by country
4.3. YOGA
4.3.1. Key market trends
4.3.2. Growth factors and opportunities
4.3.3. Market size and forecast, by region
4.3.4. Market size and forecast, by country
4.4. AEROBIC DANCE
4.4.1. Key market trends
4.4.2. Growth factors and opportunities
4.4.3. Market size and forecast, by region
4.4.4. Market size and forecast, by country
4.5. HANDBALL SPORTS
4.5.1. Key market trends
4.5.2. Growth factors and opportunities
4.5.3. Market size and forecast, by region
4.5.4. Market size and forecast, by country
4.6. RACQUET SPORTS
4.6.1. Key market trends
4.6.2. Growth factors and opportunities
4.6.3. Market size and forecast, by region
4.6.4. Market size and forecast, by country
4.7. SKATING
4.7.1. Key market trends
4.7.2. Growth factors and opportunities
4.7.3. Market size and forecast, by region
4.7.4. Market size and forecast, by country
4.8. SWIMMING
4.8.1. Key market trends
4.8.2. Growth factors and opportunities
4.8.3. Market size and forecast, by region
4.8.4. Market size and forecast, by country
4.9. OTHERS
4.9.1. Key market trends
4.9.2. Growth factors and opportunities
4.9.3. Market size and forecast, by region
4.9.4. Market size and forecast, by country
CHAPTER 5 FITNESS AND RECREATIONAL SPORTS CENTERS MARKET, BY AGE GROUP
5.1. OVERVIEW
5.2. 35 & YOUNGER
5.2.1. Key market trends
5.2.2. Growth factors and opportunities
5.2.3. Market size and forecast, by region
5.2.4. Market size and forecast, by country
5.3. 35-54
5.3.1. Key market trends
5.3.2. Growth factors and opportunities
5.3.3. Market size and forecast, by region
5.3.4. Market size and forecast, by country
5.4. 55 & OLDER
5.4.1. Key market trends
5.4.2. Growth factors and opportunities
5.4.3. Market size and forecast, by region
5.4.4. Market size and forecast, by country
CHAPTER 6 FITNESS AND RECREATIONAL SPORTS CENTER MARKET, BY GEOGRAPHY
6.1. INTRODUCTION
6.2. NORTH AMERICA
6.2.1. Key Market Trends
6.2.2. Growth Factors and Opportunities
6.2.3. Market size and forecast
6.2.4. U.S.
6.2.4.1. Market size and forecast, by type
6.2.4.2. Market size and forecast, by age group
6.2.5. Canada
6.2.5.1. Market size and forecast, by type
6.2.5.2. Market size and forecast, by age group
6.2.6. Mexico
6.2.6.1. Market size and forecast, by type
6.2.6.2. Market size and forecast, by age group
6.3. EUROPE
6.3.1. Key Market Trends
6.3.2. Growth Factors and Opportunities
6.3.3. Market Size and Forecast
6.3.4. U.K.
6.3.4.1. Market size and forecast, by type
6.3.4.2. Market size and forecast, by age group
6.3.5. Germany
6.3.5.1. Market size and forecast, by type
6.3.5.2. Market size and forecast, by age group
6.3.6. France
6.3.6.1. Market size and forecast, by type
6.3.6.2. Market size and forecast, by age group
6.3.7. Italy
6.3.7.1. Market size and forecast, by type
6.3.7.2. Market size and forecast, by age group
6.3.8. Spain
6.3.8.1. Market size and forecast, by type
6.3.8.2. Market size and forecast, by age group
6.3.9. Rest of Europe
6.3.9.1. Market size and forecast, by type
6.3.9.2. Market size and forecast, by age group
6.4. ASIA-PACIFIC
6.4.1. Key Market Trends
6.4.2. Growth Factors and Opportunities
6.4.3. Market Size and Forecast
6.4.4. China
6.4.4.1. Market size and forecast, by type
6.4.4.2. Market size and forecast, by age group
6.4.5. India
6.4.5.1. Market size and forecast, by type
6.4.5.2. Market size and forecast, by age group
6.4.6. Japan
6.4.6.1. Market size and forecast, by type
6.4.6.2. Market size and forecast, by age group
6.4.7. Australia
6.4.7.1. Market size and forecast, by type
6.4.7.2. Market size and forecast, by age group
6.4.8. South Korea
6.4.8.1. Market size and forecast, by type
6.4.8.2. Market size and forecast, by age group
6.4.9. Rest of Asia-Pacific
6.4.9.1. Market size and forecast, by type
6.4.9.2. Market size and forecast, by age group
6.5. LAMEA
6.5.1. Key Market Trends
6.5.2. Growth Factors and Opportunities
6.5.3. Market Size and Forecast
6.5.4. Brazil
6.5.4.1. Market size and forecast, by type
6.5.4.2. Market size and forecast, by age group
6.5.5. Argentina
6.5.5.1. Market size and forecast, by type
6.5.5.2. Market size and forecast, by age group
6.5.6. Africa
6.5.6.1. Market size and forecast, by type
6.5.6.2. Market size and forecast, by age group
6.5.7. Saudi Arabia
6.5.7.1. Market size and forecast, by type
6.5.7.2. Market size and forecast, by age group
6.5.8. UAE
6.5.8.1. Market size and forecast, by type
6.5.8.2. Market size and forecast, by age group
6.5.9. Rest of LAMEA
6.5.9.1. Market size and forecast, by type
6.5.9.2. Market size and forecast, by age group
CHAPTER 7 COMPANY PROFILES
7.1. 24 HOUR FITNESS USA, INC.
7.1.1. Company overview
7.1.2. Company snapshot
7.1.3. Operating business segments
7.1.4. Key strategic moves and developments
7.2. CROSSFIT INC.
7.2.1. Company overview
7.2.2. Company snapshot
7.2.3. Operating business segments
7.2.4. Key strategic moves and developments
7.3. EQUINOX HOLDINGS, INC.
7.3.1. Company overview
7.3.2. Company snapshot
7.3.3. Key strategic moves and developments
7.4. GOLD’S GYM
7.4.1. Company overview
7.4.2. Company snapshot
7.4.3. Operating business segments
7.4.4. Key strategic moves and developments
7.5. KONAMI HOLDINGS CORPORATION (KONAMI SPORTS CLUB)
7.5.1. Company overview
7.5.2. Company snapshot
7.5.3. Operating business segments
7.5.4. Business performance
7.6. LIFE TIME FITNESS, INC.
7.6.1. Company overview
7.6.2. Company snapshot
7.6.3. Operating business segments
7.7. MCFIT GLOBAL GROUP GMBH
7.7.1. Company overview
7.7.2. Company snapshot
7.7.3. Operating business segments
7.7.4. Key strategic moves and developments
7.8. PLANET FITNESS, INC.
7.8.1. Company overview
7.8.2. Company snapshot
7.8.3. Operating business segments
7.8.4. Business performance
7.8.5. Key strategic moves and developments
7.9. TOWN SPORTS INTERNATIONAL HOLDINGS INC.
7.9.1. Company overview
7.9.2. Company snapshot
7.9.3. Operating business segments
7.9.4. Business performance
7.9.5. Key strategic moves and developments
7.10. VIRGIN ACTIVE LIMITED
7.10.1. Company overview
7.10.2. Company snapshot
7.10.3. Operating business segments
7.10.4. Key strategic moves and developments
LIST OF TABLES
TABLE 1. GLOBAL FITNESS AND RECREATIONAL SPORTS CENTERS MARKET VALUE, BY TYPE, 2016-2023 ($MILLION)
TABLE 2. GYMNASIUMS MARKET VALUE, BY GEOGRAPHY, 2016-2023 ($MILLION)
TABLE 3. YOGA MARKET VALUE, BY GEOGRAPHY, 2016-2023 ($MILLION)
TABLE 4. AEROBIC DANCE MARKET VALUE, BY GEOGRAPHY, 2016-2023 ($MILLION)
TABLE 5. HANDBALL SPORTS MARKET VALUE, BY GEOGRAPHY, 2016-2023 ($MILLION)
TABLE 6. RACQUET SPORTS MARKET VALUE, BY GEOGRAPHY, 2016-2023 ($MILLION)
TABLE 7. SKATING MARKET VALUE, BY GEOGRAPHY, 2016-2023 ($MILLION)
TABLE 8. SWIMMING MARKET VALUE, BY GEOGRAPHY, 2016-2023 ($MILLION)
TABLE 9. OTHER MARKET VALUE, BY GEOGRAPHY, 2016-2023 ($MILLION)
TABLE 10. GLOBAL FITNESS AND RECREATIONAL SPORTS CENTERS MARKET VALUE, BY AGE GROUP, 2016-2023 ($MILLION)
TABLE 11. FITNESS AND RECREATIONAL SPORTS CENTERS MARKET VALUE FOR AGED 35 & YOUNGER, BY GEOGRAPHY, 2016-2023 ($MILLION)
TABLE 12. FITNESS AND RECREATIONAL SPORTS CENTERS MARKET VALUE FOR AGE 35-54, BY GEOGRAPHY, 2016-2023 ($MILLION)
TABLE 13. FITNESS AND RECREATIONAL SPORTS CENTERS MARKET VALUE FOR AGE 55 & OLDER, BY GEOGRAPHY, 2016-2023 ($MILLION)
TABLE 14. NORTH AMERICA FITNESS AND RECREATIONAL SPORTS CENTERS MARKET VALUE, BY TYPE, 2016-2023 ($MILLION)
TABLE 15. NORTH AMERICA FITNESS AND RECREATIONAL SPORTS CENTERS MARKET VALUE, BY AGE GROUP, 2016-2023 ($MILLION)
TABLE 16. NORTH AMERICA FITNESS AND RECREATIONAL SPORTS CENTERS MARKET VALUE, BY COUNTRY, 2016-2023 ($MILLION)
TABLE 17. U.S. FITNESS AND RECREATIONAL SPORTS CENTERS MARKET VALUE, BY TYPE, 2016-2023 ($MILLION)
TABLE 18. U.S. FITNESS AND RECREATIONAL SPORTS CENTERS MARKET VALUE, BY AGE GROUP, 2016-2023 ($MILLION)
TABLE 19. CANADA FITNESS AND RECREATIONAL SPORTS CENTERS MARKET VALUE, BY TYPE, 2016-2023 ($MILLION)
TABLE 20. CANADA FITNESS AND RECREATIONAL SPORTS CENTERS MARKET VALUE, BY AGE GROUP, 2016-2023 ($MILLION)
TABLE 21. MEXICO FITNESS AND RECREATIONAL SPORTS CENTERS MARKET VALUE, BY TYPE, 2016-2023 ($MILLION)
TABLE 22. MEXICO FITNESS AND RECREATIONAL SPORTS CENTERS MARKET VALUE, BY AGE GROUP, 2016-2023 ($MILLION)
TABLE 23. EUROPE FITNESS AND RECREATIONAL SPORTS CENTERS MARKET VALUE, BY TYPE, 2016-2023 ($MILLION)
TABLE 24. EUROPE FITNESS AND RECREATIONAL SPORTS CENTERS MARKET VALUE, BY AGE GROUP, 2016-2023 ($MILLION)
TABLE 25. EUROPE FITNESS AND RECREATIONAL SPORTS CENTERS MARKET VALUE, BY COUNTRY, 2016-2023 ($MILLION)
TABLE 26. U.K. FITNESS AND RECREATIONAL SPORTS CENTERS MARKET VALUE, BY TYPE, 2016-2023 ($MILLION)
TABLE 27. U.K. FITNESS AND RECREATIONAL SPORTS CENTERS MARKET VALUE, BY AGE GROUP, 2016-2023 ($MILLION)
TABLE 28. GERMANY FITNESS AND RECREATIONAL SPORTS CENTERS MARKET VALUE, BY TYPE, 2016-2023 ($MILLION)
TABLE 29. GERMANY FITNESS AND RECREATIONAL SPORTS CENTERS MARKET VALUE, BY AGE GROUP, 2016-2023 ($MILLION)
TABLE 30. FRANCE FITNESS AND RECREATIONAL SPORTS CENTERS MARKET VALUE, BY TYPE, 2016-2023 ($MILLION)
TABLE 31. FRANCE FITNESS AND RECREATIONAL SPORTS CENTERS MARKET VALUE, BY AGE GROUP, 2016-2023 ($MILLION)
TABLE 32. ITALY FITNESS AND RECREATIONAL SPORTS CENTERS MARKET VALUE, BY TYPE, 2016-2023 ($MILLION)
TABLE 33. ITALY FITNESS AND RECREATIONAL SPORTS CENTERS MARKET VALUE, BY AGE GROUP, 2016-2023 ($MILLION)
TABLE 34. SPAIN FITNESS AND RECREATIONAL SPORTS CENTERS MARKET VALUE, BY TYPE, 2016-2023 ($MILLION)
TABLE 35. SPAIN FITNESS AND RECREATIONAL SPORTS CENTERS MARKET VALUE, BY AGE GROUP, 2016-2023 ($MILLION)
TABLE 36. REST OF EUROPE FITNESS AND RECREATIONAL SPORTS CENTERS MARKET VALUE, BY TYPE, 2016-2023 ($MILLION)
TABLE 37. REST OF EUROPE FITNESS AND RECREATIONAL SPORTS CENTERS MARKET VALUE, BY AGE GROUP, 2016-2023 ($MILLION)
TABLE 38. ASIA-PACIFIC FITNESS AND RECREATIONAL SPORTS CENTERS MARKET VALUE, BY TYPE, 2016-2023 ($MILLION)
TABLE 39. ASIA-PACIFIC FITNESS AND RECREATIONAL SPORTS CENTERS MARKET VALUE, BY AGE GROUP, 2016-2023 ($MILLION)
TABLE 40. ASIA-PACIFIC FITNESS AND RECREATIONAL SPORTS CENTERS MARKET VALUE, BY COUNTRY, 2016-2023 ($MILLION)
TABLE 41. CHINA FITNESS AND RECREATIONAL SPORTS CENTERS MARKET VALUE, BY TYPE, 2016-2023 ($MILLION)
TABLE 42. CHINA FITNESS AND RECREATIONAL SPORTS CENTERS MARKET VALUE, BY AGE GROUP, 2016-2023 ($MILLION)
TABLE 43. INDIA FITNESS AND RECREATIONAL SPORTS CENTERS MARKET VALUE, BY TYPE, 2016-2023 ($MILLION)
TABLE 44. INDIA FITNESS AND RECREATIONAL SPORTS CENTERS MARKET VALUE, BY AGE GROUP, 2016-2023 ($MILLION)
TABLE 45. JAPAN FITNESS AND RECREATIONAL SPORTS CENTERS MARKET VALUE, BY TYPE, 2016-2023 ($MILLION)
TABLE 46. JAPAN FITNESS AND RECREATIONAL SPORTS CENTERS MARKET VALUE, BY AGE GROUP, 2016-2023 ($MILLION)
TABLE 47. AUSTRALIA FITNESS AND RECREATIONAL SPORTS CENTERS MARKET VALUE, BY TYPE, 2016-2023 ($MILLION)
TABLE 48. AUSTRALIA FITNESS AND RECREATIONAL SPORTS CENTERS MARKET VALUE, BY AGE GROUP, 2016-2023 ($MILLION)
TABLE 49. SOUTH KOREA FITNESS AND RECREATIONAL SPORTS CENTERS MARKET VALUE, BY TYPE, 2016-2023 ($MILLION)
TABLE 50. SOUTH KOREA FITNESS AND RECREATIONAL SPORTS CENTERS MARKET VALUE, BY AGE GROUP, 2016-2023 ($MILLION)
TABLE 51. REST OF ASIA-PACIFIC FITNESS AND RECREATIONAL SPORTS CENTERS MARKET VALUE, BY TYPE, 2016-2023 ($MILLION)
TABLE 52. REST OF ASIA-PACIFIC FITNESS AND RECREATIONAL SPORTS CENTERS MARKET VALUE, BY AGE GROUP, 2016-2023 ($MILLION)
TABLE 53. LAMEA FITNESS AND RECREATIONAL SPORTS CENTERS MARKET VALUE, BY TYPE, 2016-2023 ($MILLION)
TABLE 54. LAMEA FITNESS AND RECREATIONAL SPORTS CENTERS MARKET VALUE, BY AGE GROUP, 2016-2023 ($MILLION)
TABLE 55. LAMEA FITNESS AND RECREATIONAL SPORTS CENTERS MARKET VALUE, BY COUNTRY, 2016-2023 ($MILLION)
TABLE 56. BRAZIL FITNESS AND RECREATIONAL SPORTS CENTERS MARKET VALUE, BY TYPE, 2016-2023 ($MILLION)
TABLE 57. BRAZIL FITNESS AND RECREATIONAL SPORTS CENTERS MARKET VALUE, BY AGE GROUP, 2016-2023 ($MILLION)
TABLE 58. ARGENTINA FITNESS AND RECREATIONAL SPORTS CENTERS MARKET VALUE, BY TYPE, 2016-2023 ($MILLION)
TABLE 59. ARGENTINA FITNESS AND RECREATIONAL SPORTS CENTERS MARKET VALUE, BY AGE GROUP, 2016-2023 ($MILLION)
TABLE 60. AFRICA FITNESS AND RECREATIONAL SPORTS CENTERS MARKET VALUE, BY TYPE, 2016-2023 ($MILLION)
TABLE 61. AFRICA FITNESS AND RECREATIONAL SPORTS CENTERS MARKET VALUE, BY AGE GROUP, 2016-2023 ($MILLION)
TABLE 62. SAUDI ARABIA FITNESS AND RECREATIONAL SPORTS CENTERS MARKET VALUE, BY TYPE, 2016-2023 ($MILLION)
TABLE 63. SAUDI ARABIA FITNESS AND RECREATIONAL SPORTS CENTERS MARKET VALUE, BY AGE GROUP, 2016-2023 ($MILLION)
TABLE 64. UAE FITNESS AND RECREATIONAL SPORTS CENTERS MARKET VALUE, BY TYPE, 2016-2023 ($MILLION)
TABLE 65. UAE FITNESS AND RECREATIONAL SPORTS CENTERS MARKET VALUE, BY AGE GROUP, 2016-2023 ($MILLION)
TABLE 66. REST OF LAMEA FITNESS AND RECREATIONAL SPORTS CENTERS MARKET VALUE, BY TYPE, 2016-2023 ($MILLION)
TABLE 67. REST OF LAMEA FITNESS AND RECREATIONAL SPORTS CENTERS MARKET VALUE, BY AGE GROUP, 2016-2023 ($MILLION)
TABLE 68. 24 HOUR FITNESS USA, INC.: COMPANY SNAPSHOT
TABLE 69. 24 HOUR FITNESS USA, INC.: OPERATING SEGMENTS
TABLE 70. CROSSFIT INC.: COMPANY SNAPSHOT
TABLE 71. CROSSFIT INC.: OPERATING SEGMENTS
TABLE 72. EQUINOX HOLDING, INC.: COMPANY SNAPSHOT
TABLE 73. LIFE TIME FITNESS, INC.: COMPANY SNAPSHOT
TABLE 74. GOLD’S GYM: OPERATING SEGMENTS
TABLE 75. KONAMI HOLDINGS CORPORATION: COMPANY SNAPSHOT
TABLE 76. KONAMI HOLDINGS CORPORATION: OPERATING SEGMENTS
TABLE 77. LIFE TIME FITNESS, INC.: COMPANY SNAPSHOT
TABLE 78. LIFE TIME FITNESS, INC.: OPERATING SEGMENTS
TABLE 79. MCFIT GLOBAL GROUP GMBH: COMPANY SNAPSHOT
TABLE 80. MCFIT GLOBAL GROUP GMBH: OPERATING SEGMENTS
TABLE 81. PLANET FITNESS, INC.: COMPANY SNAPSHOT
TABLE 82. PLANET FITNESS, INC.: OPERATING SEGMENTS
TABLE 83. TOWN SPORTS INTERNATIONAL HOLDINGS, INC.: COMPANY SNAPSHOT
TABLE 84. TOWN SPORTS INTERNATIONAL HOLDINGS, INC: OPERATING SEGMENTS
TABLE 85. VIRGIN ACTIVE LIMITED: COMPANY SNAPSHOT
TABLE 86. VIRGIN ACTIVE LIMITED: OPERATING SEGMENTS
LIST OF FIGURES
FIGURE 1. GLOBAL FITNESS AND RECREATIONAL SPORTS CENTER MARKET SEGMENTATION
FIGURE 2. TOP INVESTMENT POCKET, BY TYPE
FIGURE 3. TOP WINNING STRATEGIES, BY YEAR, 2015-2017*
FIGURE 4. TOP WINNING STRATEGIES, BY DEVELOPMENT, 2015-2017* (%)
FIGURE 5. TOP WINNING STRATEGIES, BY COMPANY, 2015-2017*
FIGURE 6. MARKET SHARE ANALYSIS, BY TYPE, 2016 VS. 2023 (%)
FIGURE 7. MARKET SHARE ANALYSIS, BY AGE GROUP, 2016 VS. 2023 (%)
FIGURE 8. MARKET SHARE ANALYSIS, BY GEOGRAPHY, 2016 VS. 2023 (%)
FIGURE 9. BARGAINING POWER OF SUPPLIERS
FIGURE 10. BARGAINING POWER OF BUYERS
FIGURE 11. THREAT OF NEW ENTRANTS
FIGURE 12. THREAT OF SUBSTITUTES
FIGURE 13. COMPETITIVE RIVALRY
FIGURE 14. DRIVERS AND RESTRAINTS: GLOBAL FITNESS AND RECREATIONAL SPORTS CENTER MARKET
FIGURE 15. MIDDLE CLASS CONSUMPTION EXPENDITURES
FIGURE 16. LIFESTYLE DISEASES IN INDIA (URBAN)
FIGURE 17. REASONS WHY CUSTOMERS PREFER FITNESS STUDIOS
FIGURE 18. SOME EXPENSIVE FITNESS AND RECREATIONAL SPORTS CENTERS MEMBERSHIPS
FIGURE 19. INDIA YOUTH POPULATION
FIGURE 20. GLOBAL FITNESS AND RECREATIONAL SPORTS CENTERS MARKET SHARE, BY TYPE, 2016 (%)
FIGURE 21. GLOBAL GYMNASIUMS MARKET VALUE, BY COUNTRY, 2016 (%)
FIGURE 22. GLOBAL YOGA MARKET VALUE, BY COUNTRY, 2016 (%)
FIGURE 23. GLOBAL AEROBIC DANCE MARKET VALUE, BY COUNTRY, 2016 (%)
FIGURE 24. GLOBAL HANDBALL SPORTS MARKET VALUE, BY COUNTRY, 2016 (%)
FIGURE 25. GLOBAL RACQUET SPORTS MARKET VALUE, BY COUNTRY, 2016 (%)
FIGURE 26. GLOBAL SKATING MARKET VALUE, BY COUNTRY, 2016 (%)
FIGURE 27. GLOBAL SWIMMING MARKET VALUE, BY COUNTRY, 2016 (%)
FIGURE 28. GLOBAL OTHERS MARKET VALUE, BY COUNTRY, 2016 (%)
FIGURE 29. GLOBAL FITNESS AND RECREATIONAL SPORTS CENTERS MARKET SHARE, BY AGE GROUP, 2016 (%)
FIGURE 30. GLOBAL FITNESS AND RECREATIONAL SPORTS CENTERS MARKET VALUE FOR AGED 35 & YOUNGER, BY COUNTRY, 2016 (%)
FIGURE 31. GLOBAL FITNESS AND RECREATIONAL SPORTS CENTERS MARKET VALUE FOR AGE 35-54, BY COUNTRY, 2016 (%)
FIGURE 32. GLOBAL FITNESS AND RECREATIONAL SPORTS CENTERS MARKET VALUE FOR 55 & OLDER, BY COUNTRY, 2016 (%)
FIGURE 33. TOP TEN COUNTRIES WITH MAXIMUM GYM MEMBERSHIPS, 2015
FIGURE 34. FITNESS AND RECREATIONAL SPORTS CENTERS MARKET SHARE, BY GEOGRAPHY, 2016 (%)
FIGURE 35. NUMBER OF FITNESS CENTERS & HEALTH CLUBS IN U.S., 2008-2016
FIGURE 36. U.S. FITNESS AND RECREATIONAL SPORTS CENTERS MARKET, 2016-2023 ($MILLION)
FIGURE 37. CANADA FITNESS AND RECREATIONAL SPORTS CENTERS MARKET, 2016-2023 ($MILLION)
FIGURE 38. MEXICO FITNESS AND RECREATIONAL SPORTS CENTERS MARKET, 2016-2023 ($MILLION)
FIGURE 39. U.K. FITNESS AND RECREATIONAL SPORTS CENTERS MARKET, 2016-2023 ($MILLION)
FIGURE 40. GERMANY FITNESS AND RECREATIONAL SPORTS CENTERS MARKET, 2016-2023 ($MILLION)
FIGURE 41. FRANCE FITNESS AND RECREATIONAL SPORTS CENTERS MARKET, 2016-2023 ($MILLION)
FIGURE 42. ITALY FITNESS AND RECREATIONAL SPORTS CENTERS MARKET, 2016-2023 ($MILLION)
FIGURE 43. SPAIN FITNESS AND RECREATIONAL SPORTS CENTERS MARKET, 2016-2023 ($MILLION)
FIGURE 44. REST OF EUROPE FITNESS AND RECREATIONAL SPORTS CENTERS MARKET, 2016-2023 ($MILLION)
FIGURE 45. CHINA FITNESS AND RECREATIONAL SPORTS CENTERS MARKET, 2016-2023 ($MILLION)
FIGURE 46. INDIA FITNESS AND RECREATIONAL SPORTS CENTERS MARKET, 2016-2023 ($MILLION)
FIGURE 47. JAPAN FITNESS AND RECREATIONAL SPORTS CENTERS MARKET, 2016-2023 ($MILLION)
FIGURE 48. AUSTRALIA FITNESS AND RECREATIONAL SPORTS CENTERS MARKET, 2016-2023 ($MILLION)
FIGURE 49. SOUTH KOREA FITNESS AND RECREATIONAL SPORTS CENTERS MARKET, 2016-2023 ($MILLION)
FIGURE 50. REST OF ASIA-PACIFIC FITNESS AND RECREATIONAL SPORTS CENTERS MARKET, 2016-2023 ($MILLION)
FIGURE 51. BRAZIL FITNESS AND RECREATIONAL SPORTS CENTERS MARKET, 2016-2023 ($MILLION)
FIGURE 52. ARGENTINA FITNESS AND RECREATIONAL SPORTS CENTERS MARKET, 2016-2023 ($MILLION)
FIGURE 53. AFRICA FITNESS AND RECREATIONAL SPORTS CENTERS MARKET, 2016-2023 ($MILLION)
FIGURE 54. SAUDI ARABIA FITNESS AND RECREATIONAL SPORTS CENTERS MARKET, 2016-2023 ($MILLION)
FIGURE 55. UAE FITNESS AND RECREATIONAL SPORTS CENTERS MARKET, 2016-2023 ($MILLION)
FIGURE 56. REST OF LAMEA FITNESS AND RECREATIONAL SPORTS CENTERS MARKET, 2016-2023 ($MILLION)
FIGURE 57. KONAMI HOLDINGS CORPORATION: REVENUE, 2015-2017 ($MILLION)
FIGURE 58. KONAMI HOLDINGS CORPORATION: REVENUE SHARE BY SEGMENT, 2017 (%)
FIGURE 59. KONAMI HOLDINGS CORPORATION: REVENUE SHARE BY GEOGRAPHY, 2017 (%)
FIGURE 60. PLANET FITNESS, INC.: REVENUE, 2014-2016 ($MILLION)
FIGURE 61. PLANET FITNESS, INC.: REVENUE SHARE BY SEGMENT, 2016 (%)
FIGURE 62. TOWN SPORTS INTERNATIONAL HOLDINGS, INC.: REVENUE, 2014-2016 ($MILLION)
FIGURE 63. TOWN SPORTS INTERNATIONAL HOLDINGS, INC.: REVENUE SHARE BY SEGMENT, 2016 (%)
Fitness and recreational sports centers are the facilities, which have equipment for exercise and physical fitness conditioning activities. The growth of the global fitness and recreational sports centers industry is driven by increase in youth population across the globe and shift in consumer preference towards better individual health. The international fitness chains and gyms have already started expanding their product and services to tap the developing markets to cater to the increasing customer requirements.
Many key players have adopted the franchising model to enter in the developing markets and to expand their client base. The fitness customers are mostly in the age group of 35 & younger, who majorly focus on personal esthetics and fitness. North America and Europe are anticipated to hold the major share in the global market during the forecast period. India is projected to witness significant growth in the Asia-Pacific market.
Clients can easily download both quantitative as well as
qualitative reports in PDF and excel formats.
Start reading instantly.
This Report and over 13,000+ thousand more Reports, Available with Avenue Library. T&C*.
Enterprise
License/PDF
*Taxes/Fees, if applicable will be added during checkout. All prices in USD
To ensure high-level data integrity, accurate analysis, and impeccable forecasts
For complete satisfaction
On-demand customization of scope of the report to exactly meet your needs
Targeted market view to provide pertinent information and save time of readers
Get insights on topics that are crucial for your business. Stay abreast of your interest areas.
To ensure high-level data integrity, accurate analysis, and impeccable forecasts
For complete satisfaction
On-demand customization of scope of the report to exactly meet your needs
Targeted market view to provide pertinent information and save time of readers