
Flare Gas Recovery System Market Research, 2033
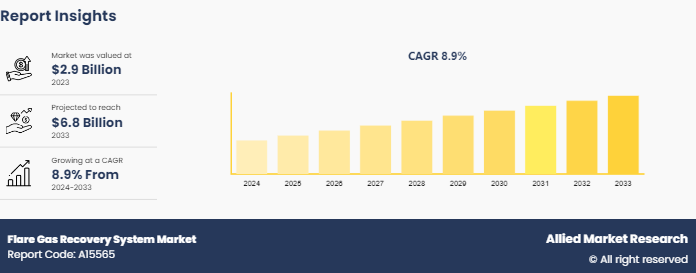
The global flare gas recovery system market size was valued at USD 2.9 billion in 2023, and is projected to reach USD 6.8 Billion by 2033, growing at a CAGR of 8.9% from 2024 to 2033.
Market Introduction and Definition
A flare gas recovery unit (FGRU) is a system that collects flare gases and returns them to production operations for use as fuel gas. This technique reduces regular flaring and emissions while lowering long-term production costs for operators. It is utilized in oil and gas processing facilities to optimize energy use, reduce environmental impact, and enhance economic efficiency. By capturing gases that would otherwise be flared, the system allows these gases to be repurposed as fuel for onsite operations, thus lowering energy costs. In addition, the purified gas can be used as feedstock for chemical production processes or for power generation, contributing to the facility's energy self-sufficiency. In some cases, the recovered gas can be re-injected into reservoirs to maintain pressure and enhance oil recovery. This practice not only minimizes greenhouse gas emissions and other pollutants, helping facilities comply with environmental regulations, but also converts waste into valuable resources, thereby improving the profitability of operations.
Key Takeaways
Over 1,500 product literatures, industry releases, annual reports, and various documents from major flare gas recovery system market participants, along with credible industry journals, trade association releases, and government websites, have been reviewed to generate valuable industry insights.
The flare gas recovery system market study covers 20 countries. The research includes a segment analysis of each country in terms of value for the projected period.
The study integrated high-quality data, expert opinions and analysis, and crucial independent perspectives. This research approach aims to provide a balanced view of global markets and flare gas recovery system market overview, assisting stakeholders in making informed decisions to achieve their most ambitious growth objectives.
Flare gas recovery system market news and key industry trends are also included in the report.
Market Dynamics
The flare gas recovery system market is primarily driven by stringent environmental regulations aimed at reducing greenhouse gas emissions and minimizing environmental impact. Governments and regulatory bodies worldwide are enforcing stricter policies to curb flaring, compelling oil and gas companies to adopt flare gas recovery system technologies. In addition, the increase in emphasis on sustainable practices and corporate social responsibility is pushing companies to invest in environment-friendly technologies. The economic benefits of recovering valuable hydrocarbons that would otherwise be wasted also play a significant role in driving flare gas recovery system market growth. The potential for cost savings and revenue generation from recovered gas, which can be used as fuel or feedstock for chemical processes, further incentivizes the adoption of flare gas recovery system.
Despite the numerous advantages, the flare gas recovery system market faces several challenges. High initial capital investment and operational costs can be significant barriers, particularly for small and medium-sized enterprises. The complexity of integrating FGRS into existing infrastructure can also pose technical challenges and require specialized expertise, which may not be readily available. In addition, fluctuating oil and gas prices can impact the financial feasibility of investing in FGRS technologies. Economic downturns and reduced profitability in the oil and gas sector can lead to deferred investments in such systems, slowing market growth.
Nevertheless, technological advancements and innovation are expected to offer lucrative growth opportunities for flare gas recovery system market growth. Flare Gas Recovery Systems (FGRS) continue to evolve and improve, driven by the urgent need to address environmental concerns and capitalize on the economic benefits these systems offer. Modern flare gas recovery system is equipped with cutting-edge components, including high-efficiency compressors, advanced control systems, and robust safety features. Highly efficient liquid ring compressors have become standard in FGRS. These compressors can handle a variety of gases and provide reliable compression, ensuring safe operation and minimal gas wastage. Moreover, sophisticated control systems enable real-time monitoring and adjustments, further enhancing the performance and safety of these systems. The ongoing development of flare gas recovery systems reflects the industry's commitment to reducing emissions and promoting sustainable practices. Companies are consistently investing in research and development to optimize these systems' performance and expand their accessibility to a broader range of industries.
Segment Overview
The flare gas recovery system market is segmented on the basis of component, application, end-use and region. By component, the market is classified into compressors, control systems, and others. By application, the market is divided into onshore and offshore. By end-use, the market is categorized into oil and gas, petrochemicals, power generation, and others. Region-wise, the flare gas recovery system market share is studied across North America, Europe, Asia-Pacific, and LAMEA.
Regional/Country Market Outlook
According to the World Bank, gas flaring in China increased by 35%, making it the tenth biggest flaring country in 2020. Rising gas flaring can be attributed to new field expansions in western China. This is because Chinese laws are significantly less strict compared to those in the U.S. and the European Union. However, the country continues to possess a substantial installed base of FGRS. Stringent carbon emission rules in China are likely to drive sales of flare gas recovery systems in China throughout the predicted period.
In 2020, oil output fell by 8% (from 82 million b/d in 2019 to 76 million b/d in 2020) , while worldwide gas flaring decreased by 5% (from 150 bcm in 2019, 142 bcm in 2020) . The U.S. accounted for 70% of the global decline in gas flaring, with a 32% decrease from 2019 to 2020. This was due to an 8% drop in oil output and new infrastructure to consume previously flared gas. Since the launch of the first two satellites in 2012, Russia, Iraq, Iran, the US, Algeria, Venezuela, and Nigeria have been the top seven nations in terms of gas flaring. These seven countries generate 40% of the world's oil each year, however, they account for around 65% of global gas flaring. Thus, above mentioned factors are likely to propel the flare gas recovery system market growth in coming years.
Competitive Landscape
Key players in the flare gas recovery system industry include Zeeco, Inc., Honeywell International Inc., John Zink Hamworthy Combustion, Wärtsilä Corporation, Transvac Systems Limited, Baker Hughes Company, Garo, Bharat Petroleum Corporation, GTUIT, and Gardner Denver Nash LLC
Key Developments
In February 2022, Baker Hughes and the Egyptian General Petroleum Corporation (EGPC) signed a Memorandum of Understanding (MoU) at the 2022 Egypt Petroleum Show (EGYPS) to establish and drive a flare recovery initiative to support emissions recovery and reduction in Egypt's upstream and downstream oil and gas operations. Baker Hughes will use its portfolio of emissions management solutions, which includes flare management technology, compression, gas turbines, and integrated processing systems, to help in flare gas measurement, recovery, management, and utilization in Egypt.
In February 2020, Zeeco, a global leader in combustion and environmental solutions for the refinery, production, petrochemical, power, pharmaceutical and biogas industries, launched services in Nigeria in partnership with Arbel Energy and Logistics Limited to help reduce the environmental impact of gas flaring in the country.
Key Industry Trends
In May 2024, Wood, a globally known consultancy and engineering business, was awarded a new contract by TotalEnergies (TEPUK) to assist with flare gas recovery operations in the North Sea, with the goal of decarbonization. Wood was granted a 23-month contract for the Elgin-Franklin Flare Gas Recovery System Project, building on its previous accomplishments of completing a field study and front-end engineering design (FEED) . This contract governs the coordination of operational, procurement, and design components for the Elgin asset. Under the direction of Wood's Aberdeen team, this deal will result in the creation of 40 new onshore and offshore jobs. As part of TEPUK's Carbon Footprint Reduction strategy, this initiative intends to reroute gas that was previously meant for flaring. Instead, it will be transferred via a new offshore compressor system before being treated and reused.
In January 2022, (TN) Platforms P-66, P-70, and P-77, located in the Tupi, Atapu, and Búzios fields, respectively, started operating with minimum gas flaring, which occurs only in unusual safety conditions, lowering greenhouse gas emissions. The flare is an equipment that burns the gas that is not used on the platforms to dispose of it safely. The start-up of the flare gas recovery system (FGRU or Flare Gas Recovery Unit) allows this gas to return to the unit for processing, preventing its burning and greenhouse gases emission. Using the technology on these three platforms has the potential to reduce emissions by about 80, 000 tons of CO2 equivalent per year.
Key Sources Referred
American Petroleum Institute (API)
Gas Processors Association (GPA)
Environmental Protection Agency (EPA)
World Bank Global Gas Flaring Reduction Partnership (GGFR)
International Association of Oil & Gas Producers (IOGP)
International Gas Union (IGU)
Society of Petroleum Engineers (SPE)
Key Benefits For Stakeholders
This flare gas recovery system market report provides a quantitative analysis of the market segments, current trends, estimations, and dynamics of the flare gas recovery system market analysis to identify the prevailing market opportunities.
The market research is offered along with information related to key drivers, restraints, and opportunities.
Porter's five forces analysis highlights the potency of buyers and suppliers to enable stakeholders make profit-oriented business decisions and strengthen their supplier-buyer network.
In-depth analysis of the flare gas recovery system market forecast assists to determine the prevailing market opportunities.
Major countries in each region are mapped according to their revenue contribution to the global market.
Market player positioning facilitates benchmarking and provides a clear understanding of the present position of the market players.
The report includes the analysis of the regional as well as global flare gas recovery system market trends, key players, market segments, application areas, flare gas recovery system market statistics, and market growth strategies.
Flare Gas Recovery System Market Report Highlights
| Aspects | Details |
| Market Size By 2033 | USD 6.8 Billion |
| Growth Rate | CAGR of 8.9% |
| Forecast period | 2024 - 2033 |
| Report Pages | 280 |
| By Component |
|
| By Application |
|
| By End-use |
|
| By Region |
|
| Key Market Players | Bharat Petroleum Corporation, Garo, Baker Hughes Company , Transvac Systems Limited, Gardner Denver Nash LLC, Wärtsilä Corporation, Zeeco, Inc., Honeywell International Inc., John Zink Hamworthy Combustion, GTUIT |
Loading Table Of Content...

