0
2019
Flow Meter Market

Flow Meter Market

by Type (Differential Pressure, Positive Displacement, Ultrasonic, Turbine, Magnetic, Coriolis, Vortex, and Others), and End User (Water & Wastewater, Oil & Gas, Chemicals, Power Generation, Pulp & Paper, Food & Beverages, and Others): Global Opportunity Analysis and Industry Forecast, 2019-2026

Report Code: A05893
Dec 2019 | Pages: 150
Tables: 123
Charts: 55
  • Formats*:

  • pdf

    Single User License, Five User
    License & Enterprise User License

  • xls

    Data Pack Excel License

  • ppt

    It comes with the additional cost
    of $2500.00 contact sales.


COVID-19

Pandemic disrupted the entire world and affected many industries.

Get detailed COVID-19 impact analysis on the Flow Meter Market

Request Now !

Global Flow Meter Market Outlook – 2026

The global flow meter market size was valued at $7.3 billion in 2018, and is projected to reach $11.9 billion by 2026, growing at a CAGR of 6.3% from 2019 to 2026. 

Flow meter is an integral tool that measures linear, non-linear, volumetric or mass flow rate of a liquid or a gas or mixture of both. Fluid characteristics, flow profile, flow range, and the need for accurate measurements are the key factors for determining the right flow meter for a particular application. There are various types of flow meters available in the market depending upon the accuracy required and their application in various end-use industries. Types of flow meter include differential pressure, positive displacement, ultrasonic, turbine, magnetic, coriolis, vortex, and others. The overall accuracy of flow meter also depends on the circumstances of the application. The above-mentioned types of flow meter are classified by considering the circumstances of the application. As the effect of temperature, pressure, fluid, and dynamic influences may potentially alter the measurement being taken.

Flow Meter Market

The flow meter industry is operating in its growth phase and it is expected to explore significant growth opportunities during the forecast period. The use of the flow meter is highly favorable in the process industries. Also, the government from various geographies is making the use of flow meters mandatory due to various advantages associated with them. Water and wastewater, oil & gas, chemical, power generation, and pulp & paper are some of the major end-users. Therefore, factors such as increase in number of initiatives to build safe water management infrastructure, rise in industrial output, and surge in energy needs majorly boost the demand for flow meters. 

Increase in demand from the municipal sector, rise in textile production, and surge in oil & gas extraction activities are leading to huge wastewater generation across the globe. Flow meters are increasingly used in these industries to treat wastewater thereby significantly contributing to the overall market growth. On the other hand, process automation is one of the recent flow meter market trends observed due to the need of mass manufacturing. This creates a need for accurate flow measuring tools to undertake efficient manufacturing processes; making flow meters an ideal tool. Therefore, increase in industrial production across the globe is expected to drive the flow meter market growth. 

In each end use industry, the use of flow meter is specified due to which there is a need of different flow meter in each industry. Currently, the market is lacking in the customized manufacturing of flow meter which restrains the growth of global flow meter market. Nevertheless, the flow meter market opportunity is likely to be developed by technological development in the key regions like North America and Asia-Pacific. 

The global flow meter market is segmented into type, end user, and region. Depending on type, the global market is divided into differential pressure, positive displacement, ultrasonic, turbine, magnetic, coriolis, vortex, and others. By end user, it is classified into water & wastewater, oil & gas, chemicals, power generation, pulp & paper, food & beverages, and others. Region-wise, the global market is analyzed across North America, Europe, Asia-Pacific, and LAMEA.

Asia-Pacific is the largest regional market in the global flow meter market wherein China, Japan, India, South Korea, and Australia is emerged as one of the major contributors. High manufacturing base of food & beverages, pulp & paper, chemical, textile, refining & petroleum, water & wastewater treatment industries in this region is the key factor driving the adoption of industrial flow meter. 

Some of the major market players operating and profiled in this market are Honeywell International Inc., Siemens AG, Emerson Electric Company, ABB Ltd, Schneider Electric SE, Yokogawa Electric Corporation, Azbil Corporation, Badger Meter Inc., Hitachi, Ltd., and KROHNE Messtechnik GmbH. The other players in the value chain include Seametrics Inc, Thermal Instruments Co, Katronic Technologies Ltd., Flow Meter Group, Litre Meter Limited., and others. Key players are adopting numerous strategies such as product launch, agreement, and business expansion, to stay competitive in the market. 

For instance, in September 2019 Badger Meter launched a versatile ultrasonic flow & energy meter named Dynasonics TFX-5000. It is designed for non-invasive, ultrasonic transit time measurement, which is known to be ideal in water and wastewater treatment, heating/ventilation/air conditioning (HVAC), and oil & gas applications. 

Global Flow Meter Market, by Type

By type, the differential flow meter segment accounted for largest flow meter market share in 2018 due to its wide application in most of the end use industries. Differential flow meter is perfectly suitable for utilization in the oil & gas industry, most specifically, in natural gas measuring applications. It measures volumetric flow but not mass flow that makes it favorable in oil & gas measuring applications. The U.S. is one of the major consumers of this type of flow meter where natural gas (shale gas) is produced at a mass scale. Increase in natural gas processing activities across the U.S. is further expected to drive the demand for differential pressure flow meter.

Flow Meter Market
By Type

Your browser does not support the canvas element.

Differential Pressure is projected as the most lucrative segment.

Get more information on this report : Request Sample Pages

Global Flow Meter Market, by End User 

By end-user, the power generation segment accounted for the highest market share in 2018. Rise in energy requirement across the globe in response to consistent surge in population, increase in urbanization, and development in industrialization has made power generation segment the major consumer of flow meters 

Flow Meter Market
By End User

Your browser does not support the canvas element.

Power Generation is projected as the most lucrative segment.

Get more information on this report : Request Sample Pages

Global Flow Meter Market, by Region

By region, Asia-Pacific acquired the largest share of flow meter market owing to increase in industrial output, rise in urbanization, and highest automotive sales & production over other regions.  In addition, it is the highly populous region that leads to the consistent demand for food and energy at a rapid pace. Consequently, existing power and food processing plants are expanding their operating capacities, driving the demand for flow meters across the region.           

Flow Meter Market
By Region

2026
Asia-pacific 
North America
Europe
LAMEA

Asia-Pacific holds a dominant position in 2018 and would continue to maintain the lead over the forecast period.

Get more information on this report : Request Sample Pages

Key Benefits for Stakeholders:

  • The report provides an in-depth analysis of the flow meter market forecast along with the current and future market trends
  • This report highlights the key drivers, opportunities, and restraints of the market along with the impact analyses during the forecast period
  • Porter’s five forces analysis helps analyze the potential of the buyers & suppliers and the competitive scenario of the global flow meter industry for strategy building
  • A comprehensive flow meter market analysis covers factors that drive and restrain market growth
  • The qualitative data in this report aims on market dynamics, trends, and developments

Flow Meter Market Report Highlights

Aspects Details
By Type
  • Differential Pressure Flow Meter
  • Positive displacement Flow Meter
  • Ultrasonic Flow Meter
  • Turbine Flow Meter
  • Magnetic Flow Meter
  • Coriolis Flow Meter
  • Vortex Flow Meter
  • Others Flow Meter
By End User
  • Water & Wastewater
  • Oil & Gas
  • Chemicals
  • Power Generation
  • Pulp & Paper
  • Food & Beverages
  • Others
By Region
  • North America  (U.S., Canada, Mexico)
  • Europe  (Germany, France, Italy, Spain, UK, Rest of Europe)
  • Asia-Pacific  (China, Japan, India, South Korea, Australia, Rest of Asia-Pacific)
  • LAMEA  (Brazil, Saudi Arabia, South Africa, LAMEA)
Key Market Players Krohne Group, Badger Meter Inc., Honeywell International, Inc., Azbil Group, ABB Ltd., Yokogawa Electric Corporation, Siemens AG, Schneider Electric SE, Emerson Electric Company, Hitachi, Ltd.
 

CHAPTER 1:    INTRODUCTION

1.1.    Report description
1.2.    Key benefits for stakeholders
1.3.    Key market segments
1.4.    Research methodology

1.4.1.    Secondary research
1.4.2.    Primary research

1.5.    Analyst tools and models

CHAPTER 2:    EXECUTIVE SUMMARY

2.1.    Key findings of the study
2.2.    CXO perspective

CHAPTER 3:    MARKET OVERVIEW

3.1.    Market definition and scope
3.2.    Key findings

3.2.1.    Top investment pockets

3.3.    Porter’s five forces analysis
3.4.    Market dynamics

3.4.1.    Drivers

3.4.1.1.    High adoption of flow meters in industrial measuring application
3.4.1.2.    Recent advancements in the flow meter technology

3.4.2.    Restraints

3.4.2.1.    High cost of flow meter and requirements of skilled labor

3.4.3.    Opportunity

3.4.3.1.    Trend for process automation across manufacturing and process industries

3.5.    Patent Analysis (2015-2018)
3.6.    Pricing Analysis (2018)

CHAPTER 4:    GLOBAL FLOW METER MARKET, BY TYPE

4.1.    Overview

4.1.1.    Market size and forecast by Type

4.2.    Differential Pressure Flow Meter

4.2.1.    Key market trends, growth, factors and opportunities
4.2.2.    Market size and forecast, by Region
4.2.3.    Market share analysis, by country

4.3.    Positive displacement Flow Meter

4.3.1.    Key market trends, growth, factors and opportunities
4.3.2.    Market size and forecast, by Region
4.3.3.    Market share analysis, by country

4.4.    Ultrasonic Flow Meter

4.4.1.    Key market trends, growth, factors and opportunities
4.4.2.    Market size and forecast, by Region
4.4.3.    Market share analysis, by country

4.5.    Turbine Flow Meter

4.5.1.    Key market trends, growth, factors and opportunities
4.5.2.    Market size and forecast, by Region
4.5.3.    Market share analysis, by country

4.6.    Magnetic Flow Meter

4.6.1.    Key market trends, growth, factors and opportunities
4.6.2.    Market size and forecast, by Region
4.6.3.    Market share analysis, by country

4.7.    Coriolis Flow Meter

4.7.1.    Key market trends, growth, factors and opportunities
4.7.2.    Market size and forecast, by Region
4.7.3.    Market share analysis, by country

4.8.    Vortex Flow Meter

4.8.1.    Key market trends, growth, factors and opportunities
4.8.2.    Market size and forecast, by Region
4.8.3.    Market share analysis, by country

4.9.    Others Flow Meter

4.9.1.    Key market trends, growth, factors and opportunities
4.9.2.    Market size and forecast, by Region
4.9.3.    Market share analysis, by country

CHAPTER 5:    GLOBAL FLOW METER MARKET, BY END USER

5.1.    Market size and forecast by End User
5.2.    Water and wastewater

5.2.1.    Key market trends, growth, factors and opportunities
5.2.2.    Market size and forecast, by Region
5.2.3.    Market share analysis, by country

5.3.    Oil and Gas

5.3.1.    Key market trends, growth, factors and opportunities
5.3.2.    Market size and forecast, by Region
5.3.3.    Market share analysis, by country

5.4.    Chemical

5.4.1.    Key market trends, growth, factors and opportunities
5.4.2.    Market size and forecast, by Region
5.4.3.    Market share analysis, by country

5.5.    Power Generation

5.5.1.    Key market trends, growth, factors and opportunities
5.5.2.    Market size and forecast, by Region
5.5.3.    Market share analysis, by country

5.6.    Pulp and Paper

5.6.1.    Key market trends, growth, factors and opportunities
5.6.2.    Market size and forecast, by Region
5.6.3.    Market share analysis, by country

5.7.    Food & Beverages

5.7.1.    Key market trends, growth, factors and opportunities
5.7.2.    Market size and forecast, by Region
5.7.3.    Market share analysis, by country

5.8.    Others

5.8.1.    Key market trends, growth, factors and opportunities
5.8.2.    Market size and forecast, by Region
5.8.3.    Market share analysis, by country

CHAPTER 6:    GLOBAL FLOW METER MARKET, BY REGION

6.1.    Overview

6.1.1.    Market size and forecast by region

6.2.    North America

6.2.1.    Market size and forecast by Type
6.2.2.    Market size and forecast by End User
6.2.3.    Market size and forecast by Country
6.2.4.    U.S.
6.2.5.    Market size and forecast by Type
6.2.6.    Market size and forecast by End User
6.2.7.    Canada

6.2.7.1.    Market size and forecast by Type
6.2.7.2.    Market size and forecast by End User

6.2.8.    Mexico

6.2.8.1.    Market size and forecast by Type

6.2.9.    Market size and forecast by End User

6.3.    Europe

6.3.1.    Market size and forecast by Type
6.3.2.    Market size and forecast by End User

6.3.2.1.    Market size and forecast by Country

6.3.3.    Germany

6.3.3.1.    Market size and forecast by Type
6.3.3.2.    Market size and forecast by End User

6.3.4.    France

6.3.4.1.    Market size and forecast by Type
6.3.4.2.    Market size and forecast by End User

6.3.5.    Italy

6.3.5.1.    Market size and forecast by Type
6.3.5.2.    Market size and forecast by End User

6.3.6.    Spain

6.3.6.1.    Market size and forecast by Type
6.3.6.2.    Market size and forecast by End User

6.3.7.    UK

6.3.7.1.    Market size and forecast by Type
6.3.7.2.    Market size and forecast by End User

6.3.8.    Rest of Europe

6.3.8.1.    Market size and forecast by Type
6.3.8.2.    Market size and forecast by End User

6.4.    Asia-Pacific

6.4.1.1.    Market size and forecast by Type
6.4.1.2.    Market size and forecast by End User
6.4.1.3.    Market size and forecast by Country

6.4.2.    China

6.4.2.1.    Market size and forecast by Type
6.4.2.2.    Market size and forecast by End User

6.4.3.    Japan

6.4.3.1.    Market size and forecast by Type
6.4.3.2.    Market size and forecast by End User

6.4.4.    India

6.4.4.1.    Market size and forecast by Type
6.4.4.2.    Market size and forecast by End User

6.4.5.    South Korea

6.4.5.1.    Market size and forecast by Type
6.4.5.2.    Market size and forecast by End User

6.4.6.    Australia

6.4.6.1.    Market size and forecast by Type
6.4.6.2.    Market size and forecast by End User

6.4.7.    Rest of Asia-Pacific

6.4.7.1.    Market size and forecast by Type
6.4.7.2.    Market size and forecast by End User

6.5.    LAMEA

6.5.1.    Market size and forecast by Type
6.5.2.    Market size and forecast by End User
6.5.3.    Market size and forecast by Country
6.5.4.    Brazil

6.5.4.1.    Market size and forecast by Type
6.5.4.2.    Market size and forecast by End User

6.5.5.    Saudi Arabia

6.5.5.1.    Market size and forecast by Type
6.5.5.2.    Market size and forecast by End User

6.5.6.    South Africa

6.5.6.1.    Market size and forecast by Type
6.5.6.2.    Market size and forecast by End User

6.5.7.    Rest of LAMEA

6.5.7.1.    Market size and forecast by Type
6.5.7.2.    Market size and forecast by End User

CHAPTER 7:    COMPETITIVE LANDSCAPE

7.1.    INTRODUCTION

7.1.1.    MARKET PLAYER POSITIONING, 2018

7.2.    TOP WINNING STRATEGIES

7.2.1.    Top winning strategies, by year
7.2.2.    Top winning strategies, by development
7.2.3.    Top winning strategies, by company

7.3.    PRODUCT MAPPING OF TOP 10 PLAYER
7.4.    COMPETITIVE HEATMAP
7.5.    KEY DEVELOPMENTS

7.5.1.    New product launches
7.5.2.    Collaborations

CHAPTER 8:    COMPANY PROFILES:

8.1.    ABB Ltd.

8.1.1.    Company overview
8.1.2.    Company snapshot
8.1.3.    Operating business segments
8.1.4.    Product portfolio
8.1.5.    Business performance
8.1.6.    Key strategic moves and developments

8.2.    Azbil Group

8.2.1.    Company overview
8.2.2.    Company snapshot
8.2.3.    Operating business segments
8.2.4.    Product portfolio
8.2.5.    Business performance
8.2.6.    Key strategic moves and developments

8.3.    Badger Meter Inc.

8.3.1.    Company overview
8.3.2.    Company snapshot
8.3.3.    Product portfolio
8.3.4.    Business performance
8.3.5.    Key strategic moves and developments

8.4.    Emerson Electric Company

8.4.1.    Company overview
8.4.2.    Company snapshot
8.4.3.    Operating business segments
8.4.4.    Product portfolio
8.4.5.    Business performance
8.4.6.    Key strategic moves and developments

8.5.    Hitachi, Ltd.

8.5.1.    Company overview
8.5.2.    Company snapshot
8.5.3.    Operating business segments
8.5.4.    Product portfolio
8.5.5.    Business performance

8.6.    Honeywell International, Inc.

8.6.1.    Company overview
8.6.2.    Company snapshot
8.6.3.    Operating business segments
8.6.4.    Product portfolio
8.6.5.    Business performance
8.6.6.    Key strategic moves and developments

8.7.    Krohne Group

8.7.1.    Company overview
8.7.2.    Company snapshot
8.7.3.    Product portfolio
8.7.4.    Key strategic moves and developments

8.8.    Schneider Electric SE

8.8.1.    Company overview
8.8.2.    Company snapshot
8.8.3.    Operating business segments
8.8.4.    Product portfolio
8.8.5.    Business performance
8.8.6.    Key strategic moves and developments

8.9.    Siemens AG

8.9.1.    Company overview
8.9.2.    Company snapshot
8.9.3.    Operating business segments
8.9.4.    Product portfolio
8.9.5.    Business performance

8.10.    Yokogawa Electric Corporation

8.10.1.    Company overview
8.10.2.    Company snapshot
8.10.3.    Operating business segments
8.10.4.    Product portfolio
8.10.5.    Business performance
8.10.6.    Key strategic moves and developments

LIST OF TABLES

TABLE 01.    GROWING INSTALLED POWER CAPACITY IN CHINA (2010-2018)    56
TABLE 02.    FLOW METER PRICES/UNIT, (2018)    58
TABLE 03.    PATENT FILED ON FLOW METER, BY COUNTRY(2015-2029)    60
TABLE 04.    PATENT FILED ON FLOW METER, BY APPLICANT (2015-2029)    61
TABLE 05.    AVERAGE PRICE OF FLOW METER, BY TYPE (2018)    62
TABLE 06.    GLOBAL FLOW METER  MARKET REVENUE, BY TYPE ($MILLION)(2019-2026)    64
TABLE 07.    GLOBAL FLOW METER MARKET, BY TYPE 2018–2026 ($MILLION)    65
TABLE 08.    GLOBAL FLOW METER MARKET FOR DIFFERENTIAL PRESSURE FLOW METER, BY REGION, 2018–2026 ($MILLION)    67
TABLE 09.    GLOBAL FLOW METER MARKET FOR POSITIVE DISPLACEMENT FLOW METER, BY REGION, 2018–2026 ($MILLION)    70
TABLE 10.    GLOBAL FLOW METER MARKET FOR ULTRASONIC FLOW METER, BY REGION, 2018–2026 ($MILLION)    73
TABLE 11.    GLOBAL FLOW METER MARKET FOR TURBINE FLOW METER, BY REGION, 2018–2026 ($MILLION)    76
TABLE 12.    GLOBAL FLOW METER MARKET FOR MAGNETIC FLOW METER, BY REGION, 2018–2026 ($MILLION)    79
TABLE 13.    GLOBAL FLOW METER MARKET FOR CORIOLIS FLOW METER, BY REGION, 2018–2026 ($MILLION)    82
TABLE 14.    GLOBAL FLOW METER MARKET FOR VORTEX FLOW METER, BY REGION, 2018–2026 ($MILLION)    85
TABLE 15.    GLOBAL FLOW METER MARKET FOR OTHERS, BY REGION, 2018–2026 ($MILLION)    88
TABLE 16.    GLOBAL FLOW METER MARKET REVENUE, BY END USER ($MILLION) (2019-2026)    91
TABLE 17.    GLOBAL FLOW METER MARKET, BY END USER 2018–2026 ($MILLION)    92
TABLE 18.    GLOBAL FLOW METER MARKET FOR WATER AND WASTEWATER, BY REGION, 2018–2026 ($MILLION)    94
TABLE 19.    WORLD CRUDE OIL PRODUCTION, (2010-2018)    97
TABLE 20.    GLOBAL FLOW METER MARKET FOR OIL AND GAS, BY REGION, 2018–2026 ($MILLION)    98
TABLE 21.    GLOBAL FLOW METER MARKET FOR CHEMICALS, BY REGION, 2018–2026 ($MILLION)    101
TABLE 22.    GLOBAL FLOW METER MARKET FOR POWER GENERATION, BY REGION, 2018–2026 ($MILLION)    104
TABLE 23.    GLOBAL FLOW METER MARKET FOR PULP AND PAPER, BY REGION, 2018–2026 ($MILLION)    107
TABLE 24.    GLOBAL FLOW METER MARKET FOR FOOD & BEVERAGES, BY REGION, 2018–2026 ($MILLION)    110
TABLE 25.    GLOBAL FLOW METER MARKET FOR OTHERS, BY REGION, 2018–2026 ($MILLION)    113
TABLE 26.    GLOBAL FLOW METER MARKET, BY REGION 2018–2026 ($MILLION)    116
TABLE 27.    NORTH AMERICA FLOW METER MARKET, BY TYPE 2018–2026 ($MILLION)    118
TABLE 28.    NORTH AMERICA FLOW METER MARKET, BY END USER 2018–2026 ($MILLION)    119
TABLE 29.    NORTH AMERICA FLOW METER MARKET, BY COUNTRY 2018–2026 ($MILLION)    120
TABLE 30.    U.S. FLOW METER MARKET, BY TYPE 2018–2026 ($MILLION)    121
TABLE 31.    U.S. FLOW METER MARKET, BY END USER 2018–2026 ($MILLION)    122
TABLE 32.    CANADA FLOW METER MARKET, BY TYPE 2018–2026 ($MILLION)    123
TABLE 33.    CANADA FLOW METER MARKET, BY END USER 2018–2026 ($MILLION)    124
TABLE 34.    MEXICO FLOW METER MARKET, BY TYPE 2018–2026 ($MILLION)    125
TABLE 35.    MEXICO FLOW METER MARKET, BY END USER 2018–2026 ($MILLION)    126
TABLE 36.    EUROPE FLOW METER MARKET, BY TYPE 2018–2026 ($MILLION)    128
TABLE 37.    EUROPE FLOW METER MARKET, BY END USER 2018–2026 ($MILLION)    129
TABLE 38.    EUROPE FLOW METER MARKET, BY MEASURED COUNTRY 2018–2026 ($MILLION)    130
TABLE 39.    GERMANY FLOW METER MARKET, BY TYPE 2018–2026 ($MILLION)    131
TABLE 40.    GERMANY FLOW METER MARKET, BY END USER 2018–2026 ($MILLION)    132
TABLE 41.    FRANCE FLOW METER MARKET, BY TYPE 2018–2026 ($MILLION)    133
TABLE 42.    FRANCE FLOW METER MARKET, BY END USER 2018–2026 ($MILLION)    134
TABLE 43.    ITALY FLOW METER MARKET, BY TYPE 2018–2026 ($MILLION)    135
TABLE 44.    ITALY FLOW METER MARKET, BY END USER 2018–2026 ($MILLION)    136
TABLE 45.    SPAIN FLOW METER MARKET, BY TYPE 2018–2026 ($MILLION)    137
TABLE 46.    SPAIN FLOW METER MARKET, BY END USER 2018–2026 ($MILLION)    138
TABLE 47.    UK FLOW METER MARKET, BY TYPE 2018–2026 ($MILLION)    139
TABLE 48.    UK FLOW METER MARKET, BY END USER 2018–2026 ($MILLION)    140
TABLE 49.    REST OF EUROPE FLOW METER MARKET, BY TYPE 2018–2026 ($MILLION)    141
TABLE 50.    REST OF EUROPE FLOW METER MARKET, BY END USER 2018–2026 ($MILLION)    142
TABLE 51.    ASIA-PACIFIC FLOW METER MARKET, BY TYPE 2018–2026 ($MILLION)    144
TABLE 52.    ASIA-PACIFIC FLOW METER MARKET, BY END USER 2018–2026 ($MILLION)    145
TABLE 53.    ASIA-PACIFIC FLOW METER MARKET, BY COUNTRY 2018–2026 ($MILLION)    146
TABLE 54.    CHINA FLOW METER MARKET, BY TYPE 2018–2026 ($MILLION)    147
TABLE 55.    CHINA FLOW METER MARKET, BY END USER 2018–2026 ($MILLION)    148
TABLE 56.    JAPAN FLOW METER MARKET, BY TYPE 2018–2026 ($MILLION)    149
TABLE 57.    JAPAN FLOW METER MARKET, BY END USER 2018–2026 ($MILLION)    150
TABLE 58.    INDIA FLOW METER MARKET, BY TYPE 2018–2026 ($MILLION)    151
TABLE 59.    INDIA FLOW METER MARKET, BY END USER 2018–2026 ($MILLION)    152
TABLE 60.    SOUTH KOREA FLOW METER MARKET, BY TYPE 2018–2026 ($MILLION)    153
TABLE 61.    SOUTH KOREA FLOW METER MARKET, BY END USER 2018–2026 ($MILLION)    154
TABLE 62.    AUSTRALIA FLOW METER MARKET, BY TYPE 2018–2026 ($MILLION)    155
TABLE 63.    AUSTRALIA FLOW METER MARKET, BY END USER 2018–2026 ($MILLION)    156
TABLE 64.    REST OF LAMEA FLOW METER MARKET, BY TYPE 2018–2026 ($MILLION)    157
TABLE 65.    REST OF LAMEA FLOW METER MARKET, BY END USER 2018–2026 ($MILLION)    158
TABLE 66.    LAMEA FLOW METER MARKET, BY TYPE 2018–2026 ($MILLION)    160
TABLE 67.    LAMEA FLOW METER MARKET, BY END USER 2018–2026 ($MILLION)    161
TABLE 68.    LAMEA FLOW METER MARKET, BY COUNTRY 2018–2026 ($MILLION)    162
TABLE 69.    BRAZIL FLOW METER MARKET, BY TYPE 2018–2026 ($MILLION)    163
TABLE 70.    BRAZIL FLOW METER MARKET, BY END USER 2018–2026 ($MILLION)    164
TABLE 71.    SAUDI ARABIA FLOW METER MARKET, BY TYPE 2018–2026 ($MILLION)    165
TABLE 72.    SAUDI ARABIA FLOW METER MARKET, BY END USER 2018–2026 ($MILLION)    166
TABLE 73.    SOUTH AFRICA FLOW METER MARKET, BY TYPE 2018–2026 ($MILLION)    167
TABLE 74.    SOUTH AFRICA FLOW METER MARKET, BY END USER 2018–2026 ($MILLION)    168
TABLE 75.    REST OF LAMEA FLOW METER MARKET, BY TYPE 2018–2026 ($MILLION)    169
TABLE 76.    REST OF LAMEA FLOW METER MARKET, BY END USER 2018–2026 ($MILLION)    170
TABLE 77.    KEY NEW PRODUCT LAUNCHES (2016-2019)    179
TABLE 78.    KEY COLLABORATIONS (2016-2019)    181
TABLE 79.    ABB: COMPANY SNAPSHOT    183
TABLE 80.    ABB: OPERATING SEGMENTS    184
TABLE 81.    ABB: PRODUCT PORTFOLIO    185
TABLE 82.    ABB FINANCIAL STATUS ($MILLION)    186
TABLE 83.    ABB: KEY STRATEGIC MOVES AND DEVELOPMENTS    188
TABLE 84.    AZBIL: COMPANY SNAPSHOT    190
TABLE 85.    AZBIL: OPERATING SEGMENTS    191
TABLE 86.    AZBIL: PRODUCT PORTFOLIO    191
TABLE 87.    AZBIL FINANCIAL STATUS ($MILLION)    192
TABLE 88.    AZBIL: KEY STRATEGIC MOVES AND DEVELOPMENTS    194
TABLE 89.    BADGER METER: COMPANY SNAPSHOT    196
TABLE 90.    BADGER METER: PRODUCT PORTFOLIO    197
TABLE 91.    OVERALL FINANCIAL STATUS ($MILLION)    198
TABLE 92.    BADGER METER: KEY STRATEGIC MOVES AND DEVELOPMENTS    200
TABLE 93.    EMERSON: COMPANY SNAPSHOT    202
TABLE 94.    EMERSON: OPERATING SEGMENTS    202
TABLE 95.    EMERSON: PRODUCT PORTFOLIO    203
TABLE 96.    EMERSON FINANCIAL STATUS ($MILLION)    204
TABLE 97.    EMERSON: KEY STRATEGIC MOVES AND DEVELOPMENTS    206
TABLE 98.    HITACHI: COMPANY SNAPSHOT    208
TABLE 99.    HITACHI: OPERATING SEGMENTS    209
TABLE 100.    HITACHI: PRODUCT PORTFOLIO    210
TABLE 101.    HITACHI FINANCIAL STATUS ($MILLION)    211
TABLE 102.    HONEYWELL: COMPANY SNAPSHOT    214
TABLE 103.    HONEYWELL: OPERATING SEGMENTS    215
TABLE 104.    HONEYWELL: PRODUCT PORTFOLIO    216
TABLE 105.    HONEYWELL FINANCIAL STATUS ($MILLION)    217
TABLE 106.    HONEYWELL: KEY STRATEGIC MOVES AND DEVELOPMENTS    218
TABLE 107.    KROHNE GROUP: COMPANY SNAPSHOT    220
TABLE 108.    KROHNE GROUP    221
TABLE 109.    KROHNE GROUP: KEY STRATEGIC MOVES AND DEVELOPMENTS    221
TABLE 110.    SCHNEIDER ELECTRIC: COMPANY SNAPSHOT    223
TABLE 111.    SCHNEIDER ELECTRIC: OPERATING SEGMENTS    223
TABLE 112.    SCHNEIDER ELECTRIC: PRODUCT PORTFOLIO    224
TABLE 113.    SCHNEIDER ELECTRIC FINANCIAL STATUS ($MILLION)    225
TABLE 114.    SCHNEIDER ELECTRIC: KEY STRATEGIC MOVES AND DEVELOPMENTS    227
TABLE 115.    SIEMENS AG: COMPANY SNAPSHOT    229
TABLE 116.    SIEMENS AG: OPERATING SEGMENTS    230
TABLE 117.    SIEMENS AG: PRODUCT PORTFOLIO    231
TABLE 118.    SIEMENS AG FINANCIAL STATUS ($MILLION)    232
TABLE 119.    YOKOGAWA ELECTRIC: COMPANY SNAPSHOT    235
TABLE 120.    YOKOGAWA ELECTRIC: OPERATING SEGMENTS    236
TABLE 121.    YOKOGAWA ELECTRIC: PRODUCT PORTFOLIO    236
TABLE 122.    YOKOGAWA ELECTRIC FINANCIAL STATUS ($MILLION)    237
TABLE 123.    YOKOGAWA ELECTRIC: KEY STRATEGIC MOVES AND DEVELOPMENTS    239

LIST OF FIGURES

FIGURE 01.    GLOBAL FLOW METER MARKET SEGMENTATION    46
FIGURE 02.    TOP INVESTMENT POCKETS, BY END USE INDUSTRY    49
FIGURE 03.    HIGH BARGAINING POWER OF SUPPLIERS    50
FIGURE 04.    MODERATE BARGAINING POWER OF BUYERS    50
FIGURE 05.    HIGH THREAT OF NEW ENTRANTS    51
FIGURE 06.    HIGH THREAT OF SUBSTITUTES    52
FIGURE 07.    LOW  INTENSITY OF COMPETITIVE RIVALRY    53
FIGURE 08.    FLOW METER MARKET DYNAMICS    54
FIGURE 09.    COMPARATIVE SHARE ANALYSIS OF FLOW METER MARKET FOR DIFFERENTIAL PRESSURE FLOW METER, BY COUNTRY, 2018 & 2026 ($MILLION)    68
FIGURE 10.    COMPARATIVE SHARE ANALYSIS OF FLOW METER MARKET FOR POSITIVE DISPLACEMENT FLOW METER, BY COUNTRY, 2018 & 2026 ($MILLION)    71
FIGURE 11.    COMPARATIVE SHARE ANALYSIS OF FLOW METER MARKET FOR ULTRASONIC FLOW METER, BY COUNTRY, 2018 & 2026 ($MILLION)    74
FIGURE 12.    COMPARATIVE SHARE ANALYSIS OF FLOW METER MARKET FOR TURBINE FLOW METER, BY COUNTRY, 2018 & 2026 ($MILLION)    77
FIGURE 13.    COMPARATIVE SHARE ANALYSIS OF FLOW METER MARKET FOR MAGNETIC FLOW METER, BY COUNTRY, 2018 & 2026 ($MILLION)    80
FIGURE 14.    COMPARATIVE SHARE ANALYSIS OF FLOW METER MARKET FOR CORIOLIS FLOW METER, BY COUNTRY, 2018 & 2026 ($MILLION)    83
FIGURE 15.    COMPARATIVE SHARE ANALYSIS OF FLOW METER MARKET FOR VORTEX FLOW METER, BY COUNTRY, 2018 & 2026 ($MILLION)    86
FIGURE 16.    COMPARATIVE SHARE ANALYSIS OF FLOW METER MARKET FOR OTHERS, BY COUNTRY, 2018 & 2026 ($MILLION)    89
FIGURE 17.    COMPARATIVE SHARE ANALYSIS OF FLOW METER MARKET FOR WATER AND WASTEWATER, BY COUNTRY, 2018 & 2026 ($MILLION)    95
FIGURE 18.    COMPARATIVE SHARE ANALYSIS OF FLOW METER MARKET FOR OIL AND GAS, BY COUNTRY, 2018 & 2026 ($MILLION)    99
FIGURE 19.    COMPARATIVE SHARE ANALYSIS OF FLOW METER MARKET FOR CHEMICALS, BY COUNTRY, 2018 & 2026 ($MILLION)    102
FIGURE 20.    COMPARATIVE SHARE ANALYSIS OF FLOW METER MARKET FOR POWER GENERATION, BY COUNTRY, 2018 & 2026 ($MILLION)    105
FIGURE 21.    COMPARATIVE SHARE ANALYSIS OF FLOW METER MARKET FOR PULP AND PAPER, BY COUNTRY, 2018 & 2026 ($MILLION)    108
FIGURE 22.    COMPARATIVE SHARE ANALYSIS OF FLOW METER MARKET FOR FOOD & BEVERAGES, BY COUNTRY, 2018 & 2026 ($MILLION)    111
FIGURE 23.    COMPARATIVE SHARE ANALYSIS OF FLOW METER MARKET FOR OTHERS, BY COUNTRY, 2018 & 2026 ($MILLION)    114
FIGURE 24.    MARKET PLAYER POSITIONING, 2018    172
FIGURE 25.    TOP WTOP WINNING STRATEGIES, BY YEAR, 2016–2019    174
FIGURE 26.    TOP WINNING STRATEGIES, BY DEVELOPMENT, 2016–2019 (%)    175
FIGURE 27.    TOP WINNING STRATEGIES, BY COMPANY, 2016–2019    176
FIGURE 28.    PRODUCT MAPPING OF TOP 10 PLAYERS    177
FIGURE 29.    COMPETITIVE HEATMAP OF KEY PLAYERS    178
FIGURE 30.    ABB: REVENUE, 2016–2018 ($MILLION)    186
FIGURE 31.    ABB: REVENUE SHARE BY SEGMENT, 2018 (%)    187
FIGURE 32.    ABB: REVENUE SHARE BY REGION, 2018 (%)    187
FIGURE 33.    AZBIL: REVENUE, 2016–2018 ($MILLION)    192
FIGURE 34.    AZBIL: REVENUE SHARE BY SEGMENT, 2018 (%)    193
FIGURE 35.    AZBIL: REVENUE SHARE BY REGION, 2018 (%)    193
FIGURE 36.    BADGER METER: NET SALES, 2016–2018 ($MILLION)    198
FIGURE 37.    BADGER METER: REVENUE SHARE BY REGION, 2018 (%)    199
FIGURE 38.    EMERSON: NET SALES, 2016–2018 ($MILLION)    204
FIGURE 39.    EMERSON: REVENUE SHARE BY SEGMENT, 2018 (%)    205
FIGURE 40.    EMERSON: REVENUE SHARE BY REGION, 2018 (%)    205
FIGURE 41.    HITACHI: REVENUE, 2016–2018 ($MILLION)    211
FIGURE 42.    HITACHI: REVENUE SHARE BY SEGMENT, 2018 (%)    212
FIGURE 43.    HITACHI: REVENUE SHARE BY REGION, 2018 (%)    212
FIGURE 44.    HONEYWELL: REVENUE, 2016–2018 ($MILLION)    216
FIGURE 45.    HONEYWELL: REVENUE SHARE BY SEGMENT, 2018 (%)    217
FIGURE 46.    HONEYWELL: REVENUE SHARE BY REGION, 2018 (%)    218
FIGURE 47.    SCHNEIDER ELECTRIC: REVENUE, 2016–2018 ($MILLION)    225
FIGURE 48.    SCHNEIDER ELECTRIC: REVENUE SHARE BY SEGMENT, 2018 (%)    226
FIGURE 49.    SCHNEIDER ELECTRIC: REVENUE SHARE BY REGION, 2018 (%)    226
FIGURE 50.    SIEMENS AG: REVENUE, 2016–2018 ($MILLION)    232
FIGURE 51.    SIEMENS AG: REVENUE SHARE BY SEGMENT, 2018 (%)    233
FIGURE 52.    SIEMENS AG: REVENUE SHARE BY REGION, 2018 (%)    233
FIGURE 53.    YOKOGAWA ELECTRIC: REVENUE, 2016–2018 ($MILLION)    237
FIGURE 54.    YOKOGAWA ELECTRIC: REVENUE SHARE BY SEGMENT, 2018 (%)    238
FIGURE 55.    YOKOGAWA ELECTRIC: REVENUE SHARE BY REGION, 2018 (%)    238


The global flowmeter market is moving toward the maturity phase in its industry life cycle where it is getting largely affected by the high cost of manufacturing, which further impacts the overall marginal profit. The power generation segment is the largest revenue contributor in this market and growing energy needs from residential as well as the industrial sector result in capacity expansion of the existing power plant. In addition, with the help of government, new power generation facilities are being installed and this factor is setting a growth trajectory of the market for the upcoming years.

Magnetic flow meters are highly recommended in water and wastewater treatment applications, which are anticipated to provide promising growth opportunities during the forecast period. This is due to increase in daily water consumption standards and rise in efforts to build sustainable water and wastewater treatment infrastructure at the global level. The World Water Council has predicted that the average daily water consumption is expected to increase by over 10% by each financial quarter from 2020 onwards. Therefore, there would be greater wastewater generation in the coming years, which is expected to offer lucrative growth opportunities to magnetic flow meters.

PURCHASE OPTIONS

Call or Email us

U.S.-Canada Toll-free: +1-800-792-5285
Int'l : +1-503-894-6022
Europe : +44-845-528-1300
Email : help@alliedmarketresearch.com
 
FREQUENTLY ASKED QUESTIONS?

A. The Asia-Pacific region expecetd to provide more business opportunities for flow market in the future

A. China, India, U.S., UK, and Brazil are the top investment centric markets in the global flow meter market

A. To get latest version of flow meter market report 

A. Water & wastewater, oil & gas, chemicals, power generation, pulp & paper, food & beverages, and others are the major end-use industries of the flow meter

A. Power generation holds the major market share for flow meter over other industries

A. Based on top growing big corporation, we select top 10 players. 

A. New product launch and merger & acquisition along with collaboratiuon are the major growth strategies adopted by market players in the global flow meter market

A. Company profiles has been selected based on their detailed product portfolio, wider geographical reach, and aggressive growth strategies

A. 
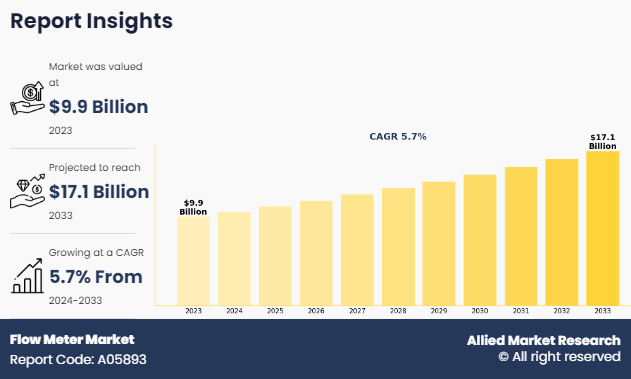
The global flow meter market was valued at $7.3 billion in 2018

A. Customized flow meter manufacturing and increasing adoption of digital flow meter are the major market trends observed in the global flow meter market

Looking for Customization?

 Customization Request

Have a Question?

 Speak with Analyst

Any Confusion?

 Inquire Before Buying

Have a glance of the Report

  Request Sample
RELATED TAGS

Purchase Full Report of
Flow Meter Market

Start reading instantly.
This Report and over 66,905+ more Reports, Available with Avenue Library. T&C*.

  • Online Only
  • $3,456
  • Online cloud access only
  • Restricted print, copy, paste & download
  • Read only
  • Free industry update
    (Within 180 days)
  • Free report update in next update cycle
    (Dec 2020 - Dec 2021)
  • Data Pack
  • $3,840
  • Restricted to one authorized user
  • One print only
  • Available in
    Excel
  • Free industry update
    (Within 180 days)
  •   Free report update in next update cycle
    (Dec 2020 - Dec 2021)
  • Single User
  • $5,769
  • Restricted to one authorized user
  • One print only
  • Available in
    PDF
  • Free industry update
    (Within 180 days)
  •   Free report update in next update cycle
    (Dec 2020 - Dec 2021)
  • Five Users
  • $6,450
  • Limited to five authorized users
  • Print upto five copies
  • Available in
    PDF
  • Free industry update
    (Within 180 days)
  •   Free report update in next update cycle
    (Dec 2020 - Dec 2021)
  • Enterprise
    License/PDF

  • $10,995
  • Unlimited
    within
    company/enterprise
  • Available in Excel & PDF
  • Free industry update
    (Within 180 days)
  •   Free report update in next update cycle
    (Dec 2020 - Dec 2021)
  • Library
    Membership

  • $999 $ 1,175
    Per User/ Per month/ Billed annually
  • Published Content
    E-access
  • Company Profiles
    E-access
  • Newly Added Content Access
  • 10 PDF
    Downloads
  • 5 Excel Data
    Pack Downloads
  • 250 Company Profiles PDF Downloads
  • Buy Now

*Taxes/Fees, if applicable will be added during checkout. All prices in USD

RELATED REPORTS
 

Why Allied Market Research?


Infallible Methodology

To ensure high-level data integrity, accurate analysis, and impeccable forecasts

Analyst Support

For complete satisfaction

Customization

On-demand customization of scope of the report to exactly meet your needs

TARGETED MARKET VIEW

Targeted market view to provide pertinent information and save time of readers

Get fresh content delivered

Get insights on topics that are crucial for your business. Stay abreast of your interest areas.

Get Industry Data Alerts

Why Allied Market Research?

Infallible Methodology

To ensure high-level data integrity, accurate analysis, and impeccable forecasts

Analyst Support

For complete satisfaction

Customization

On-demand customization of scope of the report to exactly meet your needs

TARGETED MARKET VIEW

Targeted market view to provide pertinent information and save time of readers