0
2023
Fluorescent Paint Market

Fluorescent Paint Market

by Type (Inorganic Fluorescents, Optical Whiteners, Daylight Fluorescents), by Application (Safety Equipment, Commercial Buildings, Road Line Markings, Facilities, Others): Global Opportunity Analysis and Industry Forecast, 2021-2031

Report Code: A06142
Jan 2023 | Pages: 420
Tables: 164
Charts: 51
  • Formats*:

  • pdf

    Single User License, Five User
    License & Enterprise User License

  • xls

    Data Pack Excel License

  • ppt

    It comes with the additional cost
    of $2500.00 contact sales.


Fluorescent Paint Market Research, 2031

The global fluorescent paint market was valued at $357.3 million in 2021 and is projected to reach $677.9 million by 2031, growing at a CAGR of 6.8% from 2022 to 2031.

Report key highlighters

  • Quantitative information mentioned in the global fluorescent paint market includes the market numbers in terms of value (USD Million) and volume (Kilolitres) with respect to different segments, pricing analysis, annual growth rate, CAGR (2022-31), and growth analysis.
  • The analysis in the report is provided on the basis of type and application. The study will also contain qualitative information such as the market dynamics (drivers, restraints, opportunities), Porter’s Five Force Analysis, key regulations across the region, and value chain analysis.
  • A few companies, including Radiant Color N.V., LuminoChem, Ronan Paints, Glow Paint Industries, GLOWTEC LTD, hold a large proportion of the fluorescent paint market.
  • This report makes it easier for existing market players and new entrants to the sonochemical coatings business to plan their strategies and understand the dynamics of the industry, which ultimately helps them make better decisions.
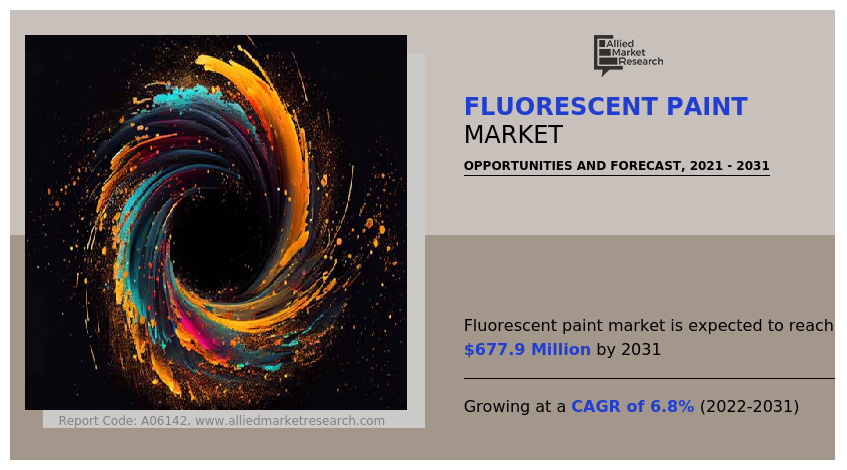
Increased adoption in various end-user industries, including oil & gas, microbiology, and construction drives the global fluorescent paint market. In addition, the use of fluorescent paints to highlight road lines is expected to contribute to growth over the forecast period.

Fluorescent Paint Market

Fluorescent paint is a form of a coating that emits visible or colored light when exposed to light. Fluorescent paints are utilized in paints and coatings, plastics, fabrics, paper goods, and leather goods, among others. It comprises two components, fluorescent paint that absorbs ultraviolet or blue light and re-emits it as visible light with a different wavelength (color). This sort of paint color emits light without the aid of an external source.

Fluorescent paint refers to paint that can absorb both visible and non-visible electromagnetic waves and radiation and then swiftly release the absorbed energy at the required wavelength. When the light of the expected wavelength is released onto this paint, it also emits a very particular hue. On a commercial scale, fluorescent paint has been utilized in a variety of applications, including the formulation of paint and coating solutions, inks, and textiles, to mention a few. There are two forms of fluorescent paint used commercially: organic and inorganic, which are derived from distinct sources. Organic fluorescent paint is made from natural and synthetic basic materials, while inorganic fluorescent paint is synthesized by combining various metal oxides. Both varieties are commercially accessible in powder and dispersion form, with formulations tailored to the requirements of the end-user industry.

Most fluorescent paints can withstand demanding applications due to their remarkable properties, such as resilience to adverse weather conditions, high temperatures, heat, and other chemicals. These characteristics facilitate the use of this fluorescent paint in a variety of applications. Similarly, this fluorescent paint is used as a colorant for engineering plastics in the automotive industry.

Increasing demand from building and construction industry

The construction industry’s demand for fluorescent paint for applications such as building paints, coatings, sign markings, and road lines is increasing. In commercial structures, luminous pigments or paints are utilized for coatings, markings, ornamentation, and sign marks. Fluorescent paints have applications in the construction industry for artificial lighting such as stage lighting, posters, and others. According to the U.S. Census Bureau, construction spending in the United States increased by 1.3% from December 2021 to January 2022, reaching $1,677 billion. Moreover, the increase in construction and infrastructure projects is boosting the market for fluorescent paint, creating development potential for market participants.

Fluorescent Paints provide superior features such as resistance to oil, water, grime, and corrosion. In developing regions, the number of new roadways and infrastructure projects has led to a rise in the use of fluorescent paints for a variety of applications, such as regulatory, emergency, and warning signs. Numerous countries around the globe have begun to work on the design and implementation of smart cities. China alone has around 300 smart city projects in development, with substantial industry and government participation. India has also allocated trillions of dollars for the development of more than 100 smart cities. Transportation is a crucial aspect of a smart city. Increasing demand for fluorescent paints to construct intelligent highways is driving the market for fluorescent paints.

Innovation is the key to generating new items, and as a result, alternatives begin to hamper market expansion. Increased use of phosphors with no radium content, such as copper-magnesium, copper, and silver, in conjunction with activators such as copper, copper-magnesium, and silver, is impacting the growth of the fluorescent paint market. The thin layer is utilized so that light can absorb itself. Fluorescent paints are expensive due to their lengthy illuminating life and hazardous due to their use of radioactive materials.

The invention of fluorescent paints led to their application in various industries and for various reasons. The use of gadgets that do not require additional electrical power for visibility in all conditions is expanding, and these can be utilized in remote places where the electrical power supply is limited. The helicopter's primary and tail rotors are painted with fluorescent paint to improve its visibility. The tail rotors are hazardous due to their rapid rotation and invisibility, especially when the vision limit is reached. According to the International Air Transport Association (IATA), the total aircraft fleet reached 24,500 by the end of the year, up from approximately 8,000 at the year's low point in April, but 18% lower than in 2019. The global fleet is not expected to return to pre-COVID levels until at least the end of 2022, but long-term projections show a recovery for the industry. Thus, expanding applications in the military and aviation sectors will create lucrative market opportunities for fluorescent.

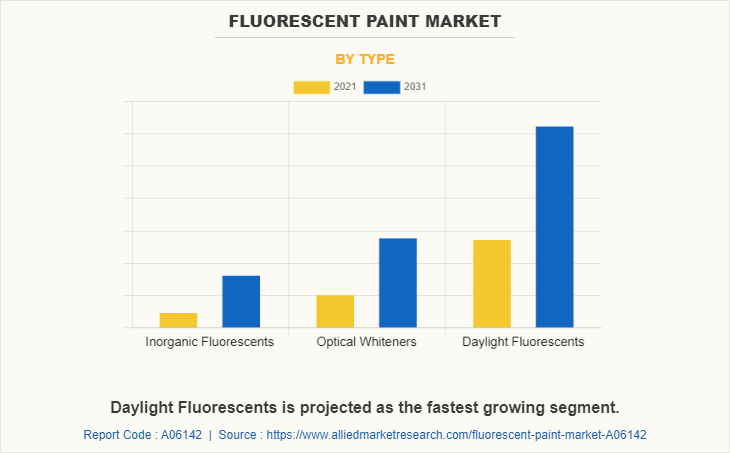
The fluorescent paint market is segmented into type, application, and region. Depending on the type, the market is divided into Inorganic fluorescents, optical whiteners, and daylight fluorescents. On the basis of application, it is categorized into safety equipment, commercial buildings, road line markings, facilities, and others. Region-wise, the market is studied across North America, Europe, Asia-Pacific, and LAMEA.

The major players operating in the global fluorescent paint market are Radiant Color N.V., LuminoChem, Ronan Paints, Glow Paint Industries, GLOWTEC LTD, Krylon Products Group, DayGlo Color Corp, Brilliant Group, Inc., Aron Universal Limited, and Vicome Corp. Other players operating in the market are Midstar, Xcolor, DANE Color Group and Solar Color Dust.
Fluorescent Paint Market

The daylight fluorescents segment accounted for the largest share and is the fastest-growing segment with a CAGR of 7.0%, The characteristic of luminosity is provided by the daylight fluorescent material when the fluorescent color emits light. Daylight fluorescent paints are non-toxic and are utilized due to their ability to attract attention and provide extremely high visibility. These pigments are utilized in advertising, protective gear, documentation, inks, and several biomedical applications.
Fluorescent Paint Market

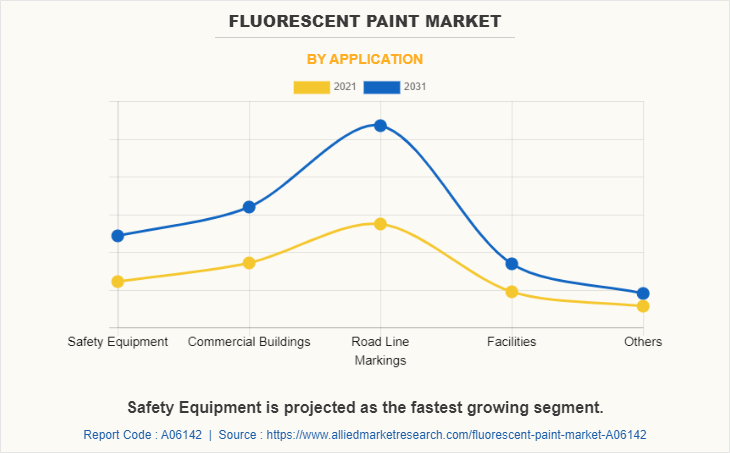
The road line markings segment accounted for the largest share, due to raising awareness through signals, sign boards, and important messages, mandating respect to traffic laws, and other approaches such as organizing awareness camps are all examples of road safety initiatives. Signboards are the most commonly used approach, mostly for preventing traffic accidents and mishaps. Because roads are the most common mode of transportation, users such as bicycles, pedestrians, and motor vehicle drivers are in danger of collisions. Because of measures such as sidewalks, safe crossing sites, bike lanes, rumble strips, and other traffic calming measures, the demand for road line marking has significantly increased.

The safety equipment segment is the fastest-growing segment with a CAGR of 7.4%, Fluorescent paints are used to paint or paint clothing that is subsequently worn as safety equipment. Fluorescent-coated clothing helps to decrease workplace accidents and injuries by making workers visible to one another. The usage of worker safety equipment on construction sites or in dangerous conditions, such as those near roadways, in the dark, or where personnel may be obstructed by trees and traffic barriers, is becoming more common in the industrial sector.
Fluorescent Paint Market

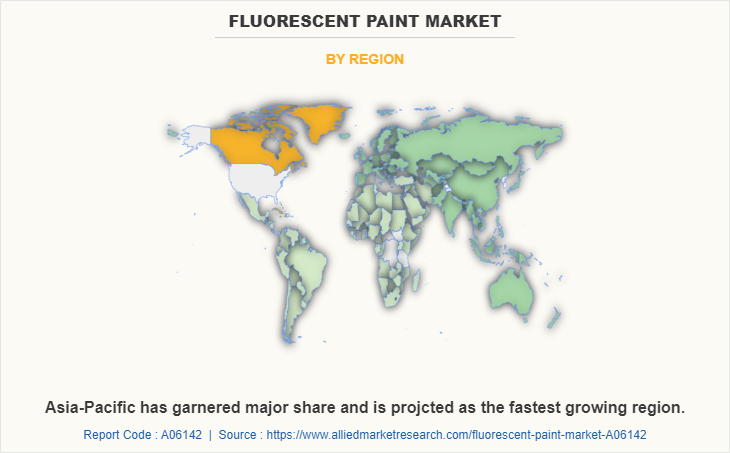
Asia-Pacific garnered the largest share. China and India are boosting demand in Asia-Pacific due to the expansion of transportation and infrastructure developments. Strong and healthy growth in the infrastructural sector is related with the expansion of government projects, such as the Indian government's plan to construct highways worth Rs. 15 lakh crore ($204,000 million) over the next two years. Numerous infrastructure development projects necessitate the use of fluorescent paints for road safety signs, markings, emergency signs, and others. This has resulted in the expansion of the market for fluorescent paint in the Asia-Pacific region.

Key Market Trends:

  • The European countries are concentrating on mergers and acquisitions for product development and launches that will aid in the expansion of businesses in the region by the conclusion of the forecast period.
  • Manufacturers from the Asia-Pacific region are concentrating heavily on the growth of fluorescent paint market applications in the area's growing and developed economies.
  • The Latin American register is in the process of reviving the economy and using the prospects accessible to businesses operating in both Brazil and Mexico.
  • As part of the North American market, the U.S. market focuses on creating demand through packaging materials, entertainment sources, and educational and safety-related product content.
  • With its Limelight i8 vehicle, BMW made tremendous progress. They have discovered a new approach to combine fluorescent pigment into their car models to give them a glossy appearance. This strategy of BMW Italia has assisted the corporation in giving their automobile a futuristic appearance.

 Recent developments undertaken by key players

  • In January 2022, Luminochem developed and manufactured unique luminescent photoactive materials and markers, with a focus on organic fluorescent security pigments and dyes and near infra-red absorbing materials. This launch improves the growth of the product portfolio.
  • In October 2020, Brilliant Group, Inc., the leader in providing a simple, end-to-end experience for manufacturers and distributors to implement fluorescent pigments, announces that their new warehouse location in The Netherlands is fully operational. This expansion will improve the growth of the fluorescent paint market.

Key Benefits For Stakeholders

  • This report provides a quantitative analysis of the market segments, current trends, estimations, and dynamics of the fluorescent paint market analysis from 2021 to 2031 to identify the prevailing fluorescent paint market opportunities.
  • The market research is offered along with information related to key drivers, restraints, and opportunities.
  • Porter's five forces analysis highlights the potency of buyers and suppliers to enable stakeholders make profit-oriented business decisions and strengthen their supplier-buyer network.
  • In-depth analysis of the fluorescent paint market segmentation assists to determine the prevailing market opportunities.
  • Major countries in each region are mapped according to their revenue contribution to the global market.
  • Market player positioning facilitates benchmarking and provides a clear understanding of the present position of the market players.
  • The report includes the analysis of the regional as well as global fluorescent paint market trends, key players, market segments, application areas, and market growth strategies.

Fluorescent Paint Market Report Highlights

Aspects Details
Market Size By 2031 USD 677.9 million
Growth Rate CAGR of 6.8%
Forecast period 2021 - 2031
Report Pages 420
By Type
  • Daylight Fluorescents
  • Inorganic Fluorescents
  • Optical Whiteners
By Application
  • Safety Equipment
  • Commercial Buildings
  • Road Line Markings
  • Facilities
  • Others
By Region
  • North America  (U.S., Canada, Mexico)
  • Europe  (Germany, France, Italy, UK, Spain, Rest of Europe)
  • Asia-Pacific  (China, India, Japan, South Korea, Australia, Rest of Asia-Pacific)
  • LAMEA  (Brazil, Saudi Arabia, South Africa, Rest of LAMEA)
Key Market Players Krylon Products Group, Radiant Color N.V., Aron Universal Limited, Brilliant Group, Inc., GLOWTEC LTD, DayGlo Color Corp, Glow Paint Industries, Ronan Paints, Vicome Corp., LuminoChem
 
  • CHAPTER 1: INTRODUCTION

    • 1.1. Report description

    • 1.2. Key market segments

    • 1.3. Key benefits to the stakeholders

    • 1.4. Research Methodology

      • 1.4.1. Primary research

      • 1.4.2. Secondary research

      • 1.4.3. Analyst tools and models

  • CHAPTER 2: EXECUTIVE SUMMARY

    • 2.1. CXO Perspective

  • CHAPTER 3: MARKET OVERVIEW

    • 3.1. Market definition and scope

    • 3.2. Key findings

      • 3.2.1. Top impacting factors

      • 3.2.2. Top investment pockets

    • 3.3. Porter’s five forces analysis

      • 3.3.1. Moderate bargaining power of suppliers

      • 3.3.2. Moderate bargaining power of buyers

      • 3.3.3. Moderate threat of substitutes

      • 3.3.4. Moderate threat of new entrants

      • 3.3.5. Low intensity of rivalry

    • 3.4. Market dynamics

      • 3.4.1. Drivers

        • 3.4.1.1. Increasing demand from building and construction industry
        • 3.4.1.2. Increasing use of optical whiteners in coated and uncoated paper industry

      • 3.4.2. Restraints

        • 3.4.2.1. Increasing raw material costs and environmental restrictions

      • 3.4.3. Opportunities

        • 3.4.3.1. Increasing use in the aerospace and defense industries

    • 3.5. COVID-19 Impact Analysis on the market

    • 3.6. Market Share Analysis

    • 3.7. Patent Landscape

    • 3.8. Pricing Analysis

    • 3.9. Value Chain Analysis

  • CHAPTER 4: FLUORESCENT PAINT MARKET, BY TYPE

    • 4.1. Overview

      • 4.1.1. Market size and forecast

    • 4.2. Inorganic Fluorescents

      • 4.2.1. Key market trends, growth factors and opportunities

      • 4.2.2. Market size and forecast, by region

      • 4.2.3. Market share analysis by country

    • 4.3. Optical Whiteners

      • 4.3.1. Key market trends, growth factors and opportunities

      • 4.3.2. Market size and forecast, by region

      • 4.3.3. Market share analysis by country

    • 4.4. Daylight Fluorescents

      • 4.4.1. Key market trends, growth factors and opportunities

      • 4.4.2. Market size and forecast, by region

      • 4.4.3. Market share analysis by country

  • CHAPTER 5: FLUORESCENT PAINT MARKET, BY APPLICATION

    • 5.1. Overview

      • 5.1.1. Market size and forecast

    • 5.2. Safety Equipment

      • 5.2.1. Key market trends, growth factors and opportunities

      • 5.2.2. Market size and forecast, by region

      • 5.2.3. Market share analysis by country

    • 5.3. Commercial Buildings

      • 5.3.1. Key market trends, growth factors and opportunities

      • 5.3.2. Market size and forecast, by region

      • 5.3.3. Market share analysis by country

    • 5.4. Road Line Markings

      • 5.4.1. Key market trends, growth factors and opportunities

      • 5.4.2. Market size and forecast, by region

      • 5.4.3. Market share analysis by country

    • 5.5. Facilities

      • 5.5.1. Key market trends, growth factors and opportunities

      • 5.5.2. Market size and forecast, by region

      • 5.5.3. Market share analysis by country

    • 5.6. Others

      • 5.6.1. Key market trends, growth factors and opportunities

      • 5.6.2. Market size and forecast, by region

      • 5.6.3. Market share analysis by country

  • CHAPTER 6: FLUORESCENT PAINT MARKET, BY REGION

    • 6.1. Overview

      • 6.1.1. Market size and forecast By Region

    • 6.2. North America

      • 6.2.1. Key trends and opportunities

      • 6.2.2. Market size and forecast, by Type

      • 6.2.3. Market size and forecast, by Application

      • 6.2.4. Market size and forecast, by country

        • 6.2.4.1. U.S.
          • 6.2.4.1.1. Key market trends, growth factors and opportunities
          • 6.2.4.1.2. Market size and forecast, by Type
          • 6.2.4.1.3. Market size and forecast, by Application
        • 6.2.4.2. Canada
          • 6.2.4.2.1. Key market trends, growth factors and opportunities
          • 6.2.4.2.2. Market size and forecast, by Type
          • 6.2.4.2.3. Market size and forecast, by Application
        • 6.2.4.3. Mexico
          • 6.2.4.3.1. Key market trends, growth factors and opportunities
          • 6.2.4.3.2. Market size and forecast, by Type
          • 6.2.4.3.3. Market size and forecast, by Application
    • 6.3. Europe

      • 6.3.1. Key trends and opportunities

      • 6.3.2. Market size and forecast, by Type

      • 6.3.3. Market size and forecast, by Application

      • 6.3.4. Market size and forecast, by country

        • 6.3.4.1. Germany
          • 6.3.4.1.1. Key market trends, growth factors and opportunities
          • 6.3.4.1.2. Market size and forecast, by Type
          • 6.3.4.1.3. Market size and forecast, by Application
        • 6.3.4.2. France
          • 6.3.4.2.1. Key market trends, growth factors and opportunities
          • 6.3.4.2.2. Market size and forecast, by Type
          • 6.3.4.2.3. Market size and forecast, by Application
        • 6.3.4.3. Italy
          • 6.3.4.3.1. Key market trends, growth factors and opportunities
          • 6.3.4.3.2. Market size and forecast, by Type
          • 6.3.4.3.3. Market size and forecast, by Application
        • 6.3.4.4. UK
          • 6.3.4.4.1. Key market trends, growth factors and opportunities
          • 6.3.4.4.2. Market size and forecast, by Type
          • 6.3.4.4.3. Market size and forecast, by Application
        • 6.3.4.5. Spain
          • 6.3.4.5.1. Key market trends, growth factors and opportunities
          • 6.3.4.5.2. Market size and forecast, by Type
          • 6.3.4.5.3. Market size and forecast, by Application
        • 6.3.4.6. Rest of Europe
          • 6.3.4.6.1. Key market trends, growth factors and opportunities
          • 6.3.4.6.2. Market size and forecast, by Type
          • 6.3.4.6.3. Market size and forecast, by Application
    • 6.4. Asia-Pacific

      • 6.4.1. Key trends and opportunities

      • 6.4.2. Market size and forecast, by Type

      • 6.4.3. Market size and forecast, by Application

      • 6.4.4. Market size and forecast, by country

        • 6.4.4.1. China
          • 6.4.4.1.1. Key market trends, growth factors and opportunities
          • 6.4.4.1.2. Market size and forecast, by Type
          • 6.4.4.1.3. Market size and forecast, by Application
        • 6.4.4.2. India
          • 6.4.4.2.1. Key market trends, growth factors and opportunities
          • 6.4.4.2.2. Market size and forecast, by Type
          • 6.4.4.2.3. Market size and forecast, by Application
        • 6.4.4.3. Japan
          • 6.4.4.3.1. Key market trends, growth factors and opportunities
          • 6.4.4.3.2. Market size and forecast, by Type
          • 6.4.4.3.3. Market size and forecast, by Application
        • 6.4.4.4. South Korea
          • 6.4.4.4.1. Key market trends, growth factors and opportunities
          • 6.4.4.4.2. Market size and forecast, by Type
          • 6.4.4.4.3. Market size and forecast, by Application
        • 6.4.4.5. Australia
          • 6.4.4.5.1. Key market trends, growth factors and opportunities
          • 6.4.4.5.2. Market size and forecast, by Type
          • 6.4.4.5.3. Market size and forecast, by Application
        • 6.4.4.6. Rest of Asia-Pacific
          • 6.4.4.6.1. Key market trends, growth factors and opportunities
          • 6.4.4.6.2. Market size and forecast, by Type
          • 6.4.4.6.3. Market size and forecast, by Application
    • 6.5. LAMEA

      • 6.5.1. Key trends and opportunities

      • 6.5.2. Market size and forecast, by Type

      • 6.5.3. Market size and forecast, by Application

      • 6.5.4. Market size and forecast, by country

        • 6.5.4.1. Brazil
          • 6.5.4.1.1. Key market trends, growth factors and opportunities
          • 6.5.4.1.2. Market size and forecast, by Type
          • 6.5.4.1.3. Market size and forecast, by Application
        • 6.5.4.2. Saudi Arabia
          • 6.5.4.2.1. Key market trends, growth factors and opportunities
          • 6.5.4.2.2. Market size and forecast, by Type
          • 6.5.4.2.3. Market size and forecast, by Application
        • 6.5.4.3. South Africa
          • 6.5.4.3.1. Key market trends, growth factors and opportunities
          • 6.5.4.3.2. Market size and forecast, by Type
          • 6.5.4.3.3. Market size and forecast, by Application
        • 6.5.4.4. Rest of LAMEA
          • 6.5.4.4.1. Key market trends, growth factors and opportunities
          • 6.5.4.4.2. Market size and forecast, by Type
          • 6.5.4.4.3. Market size and forecast, by Application
  • CHAPTER 7: COMPETITIVE LANDSCAPE

    • 7.1. Introduction

    • 7.2. Top winning strategies

    • 7.3. Product Mapping of Top 10 Player

    • 7.4. Competitive Dashboard

    • 7.5. Competitive Heatmap

    • 7.6. Top player positioning, 2021

  • CHAPTER 8: COMPANY PROFILES

    • 8.1. Radiant Color N.V.

      • 8.1.1. Company overview

      • 8.1.2. Key Executives

      • 8.1.3. Company snapshot

      • 8.1.4. Operating business segments

      • 8.1.5. Product portfolio

    • 8.2. LuminoChem

      • 8.2.1. Company overview

      • 8.2.2. Key Executives

      • 8.2.3. Company snapshot

      • 8.2.4. Operating business segments

      • 8.2.5. Product portfolio

      • 8.2.6. Key strategic moves and developments

    • 8.3. Aron Universal Limited

      • 8.3.1. Company overview

      • 8.3.2. Key Executives

      • 8.3.3. Company snapshot

      • 8.3.4. Operating business segments

      • 8.3.5. Product portfolio

    • 8.4. Ronan Paints

      • 8.4.1. Company overview

      • 8.4.2. Key Executives

      • 8.4.3. Company snapshot

      • 8.4.4. Operating business segments

      • 8.4.5. Product portfolio

    • 8.5. Glow Paint Industries

      • 8.5.1. Company overview

      • 8.5.2. Key Executives

      • 8.5.3. Company snapshot

      • 8.5.4. Operating business segments

      • 8.5.5. Product portfolio

    • 8.6. GLOWTEC LTD

      • 8.6.1. Company overview

      • 8.6.2. Key Executives

      • 8.6.3. Company snapshot

      • 8.6.4. Operating business segments

      • 8.6.5. Product portfolio

    • 8.7. Krylon Products Group

      • 8.7.1. Company overview

      • 8.7.2. Key Executives

      • 8.7.3. Company snapshot

      • 8.7.4. Operating business segments

      • 8.7.5. Product portfolio

    • 8.8. DayGlo Color Corp

      • 8.8.1. Company overview

      • 8.8.2. Key Executives

      • 8.8.3. Company snapshot

      • 8.8.4. Operating business segments

      • 8.8.5. Product portfolio

    • 8.9. Brilliant Group, Inc.

      • 8.9.1. Company overview

      • 8.9.2. Key Executives

      • 8.9.3. Company snapshot

      • 8.9.4. Operating business segments

      • 8.9.5. Product portfolio

      • 8.9.6. Key strategic moves and developments

    • 8.10. Vicome Corp.

      • 8.10.1. Company overview

      • 8.10.2. Key Executives

      • 8.10.3. Company snapshot

      • 8.10.4. Operating business segments

      • 8.10.5. Product portfolio

  • LIST OF TABLES

  • TABLE 01. GLOBAL FLUORESCENT PAINT MARKET, BY TYPE, 2021-2031 (REVENUE, $MILLION)
    TABLE 02. GLOBAL FLUORESCENT PAINT MARKET, BY TYPE, 2021-2031 (VOLUME, KILOLITRES)
    TABLE 03. FLUORESCENT PAINT MARKET FOR INORGANIC FLUORESCENTS, BY REGION, 2021-2031 (REVENUE, $MILLION)
    TABLE 04. FLUORESCENT PAINT MARKET FOR INORGANIC FLUORESCENTS, BY REGION, 2021-2031 (VOLUME, KILOLITRES)
    TABLE 05. FLUORESCENT PAINT MARKET FOR OPTICAL WHITENERS, BY REGION, 2021-2031 (REVENUE, $MILLION)
    TABLE 06. FLUORESCENT PAINT MARKET FOR OPTICAL WHITENERS, BY REGION, 2021-2031 (VOLUME, KILOLITRES)
    TABLE 07. FLUORESCENT PAINT MARKET FOR DAYLIGHT FLUORESCENTS, BY REGION, 2021-2031 (REVENUE, $MILLION)
    TABLE 08. FLUORESCENT PAINT MARKET FOR DAYLIGHT FLUORESCENTS, BY REGION, 2021-2031 (VOLUME, KILOLITRES)
    TABLE 09. GLOBAL FLUORESCENT PAINT MARKET, BY APPLICATION, 2021-2031 (REVENUE, $MILLION)
    TABLE 10. GLOBAL FLUORESCENT PAINT MARKET, BY APPLICATION, 2021-2031 (VOLUME, KILOLITRES)
    TABLE 11. FLUORESCENT PAINT MARKET FOR SAFETY EQUIPMENT, BY REGION, 2021-2031 (REVENUE, $MILLION)
    TABLE 12. FLUORESCENT PAINT MARKET FOR SAFETY EQUIPMENT, BY REGION, 2021-2031 (VOLUME, KILOLITRES)
    TABLE 13. FLUORESCENT PAINT MARKET FOR COMMERCIAL BUILDINGS, BY REGION, 2021-2031 (REVENUE, $MILLION)
    TABLE 14. FLUORESCENT PAINT MARKET FOR COMMERCIAL BUILDINGS, BY REGION, 2021-2031 (VOLUME, KILOLITRES)
    TABLE 15. FLUORESCENT PAINT MARKET FOR ROAD LINE MARKINGS, BY REGION, 2021-2031 (REVENUE, $MILLION)
    TABLE 16. FLUORESCENT PAINT MARKET FOR ROAD LINE MARKINGS, BY REGION, 2021-2031 (VOLUME, KILOLITRES)
    TABLE 17. FLUORESCENT PAINT MARKET FOR FACILITIES, BY REGION, 2021-2031 (REVENUE, $MILLION)
    TABLE 18. FLUORESCENT PAINT MARKET FOR FACILITIES, BY REGION, 2021-2031 (VOLUME, KILOLITRES)
    TABLE 19. FLUORESCENT PAINT MARKET FOR OTHERS, BY REGION, 2021-2031 (REVENUE, $MILLION)
    TABLE 20. FLUORESCENT PAINT MARKET FOR OTHERS, BY REGION, 2021-2031 (VOLUME, KILOLITRES)
    TABLE 21. FLUORESCENT PAINT MARKET, BY REGION, 2021-2031 (REVENUE, $MILLION)
    TABLE 22. FLUORESCENT PAINT MARKET, BY REGION, 2021-2031 (VOLUME, KILOLITRES)
    TABLE 23. NORTH AMERICA FLUORESCENT PAINT MARKET, BY TYPE, 2021-2031 (REVENUE, $MILLION)
    TABLE 24. NORTH AMERICA FLUORESCENT PAINT MARKET, BY TYPE, 2021-2031 (VOLUME, KILOLITRES)
    TABLE 25. NORTH AMERICA FLUORESCENT PAINT MARKET, BY APPLICATION, 2021-2031 (REVENUE, $MILLION)
    TABLE 26. NORTH AMERICA FLUORESCENT PAINT MARKET, BY APPLICATION, 2021-2031 (VOLUME, KILOLITRES)
    TABLE 27. NORTH AMERICA FLUORESCENT PAINT MARKET, BY COUNTRY, 2021-2031 (REVENUE, $MILLION)
    TABLE 28. NORTH AMERICA FLUORESCENT PAINT MARKET, BY COUNTRY, 2021-2031 (VOLUME, KILOLITRES)
    TABLE 29. U.S. FLUORESCENT PAINT MARKET, BY TYPE, 2021-2031 (REVENUE, $MILLION)
    TABLE 30. U.S. FLUORESCENT PAINT MARKET, BY TYPE, 2021-2031 (VOLUME, KILOLITRES)
    TABLE 31. U.S. FLUORESCENT PAINT MARKET, BY APPLICATION, 2021-2031 (REVENUE, $MILLION)
    TABLE 32. U.S. FLUORESCENT PAINT MARKET, BY APPLICATION, 2021-2031 (VOLUME, KILOLITRES)
    TABLE 33. CANADA FLUORESCENT PAINT MARKET, BY TYPE, 2021-2031 (REVENUE, $MILLION)
    TABLE 34. CANADA FLUORESCENT PAINT MARKET, BY TYPE, 2021-2031 (VOLUME, KILOLITRES)
    TABLE 35. CANADA FLUORESCENT PAINT MARKET, BY APPLICATION, 2021-2031 (REVENUE, $MILLION)
    TABLE 36. CANADA FLUORESCENT PAINT MARKET, BY APPLICATION, 2021-2031 (VOLUME, KILOLITRES)
    TABLE 37. MEXICO FLUORESCENT PAINT MARKET, BY TYPE, 2021-2031 (REVENUE, $MILLION)
    TABLE 38. MEXICO FLUORESCENT PAINT MARKET, BY TYPE, 2021-2031 (VOLUME, KILOLITRES)
    TABLE 39. MEXICO FLUORESCENT PAINT MARKET, BY APPLICATION, 2021-2031 (REVENUE, $MILLION)
    TABLE 40. MEXICO FLUORESCENT PAINT MARKET, BY APPLICATION, 2021-2031 (VOLUME, KILOLITRES)
    TABLE 41. EUROPE FLUORESCENT PAINT MARKET, BY TYPE, 2021-2031 (REVENUE, $MILLION)
    TABLE 42. EUROPE FLUORESCENT PAINT MARKET, BY TYPE, 2021-2031 (VOLUME, KILOLITRES)
    TABLE 43. EUROPE FLUORESCENT PAINT MARKET, BY APPLICATION, 2021-2031 (REVENUE, $MILLION)
    TABLE 44. EUROPE FLUORESCENT PAINT MARKET, BY APPLICATION, 2021-2031 (VOLUME, KILOLITRES)
    TABLE 45. EUROPE FLUORESCENT PAINT MARKET, BY COUNTRY, 2021-2031 (REVENUE, $MILLION)
    TABLE 46. EUROPE FLUORESCENT PAINT MARKET, BY COUNTRY, 2021-2031 (VOLUME, KILOLITRES)
    TABLE 47. GERMANY FLUORESCENT PAINT MARKET, BY TYPE, 2021-2031 (REVENUE, $MILLION)
    TABLE 48. GERMANY FLUORESCENT PAINT MARKET, BY TYPE, 2021-2031 (VOLUME, KILOLITRES)
    TABLE 49. GERMANY FLUORESCENT PAINT MARKET, BY APPLICATION, 2021-2031 (REVENUE, $MILLION)
    TABLE 50. GERMANY FLUORESCENT PAINT MARKET, BY APPLICATION, 2021-2031 (VOLUME, KILOLITRES)
    TABLE 51. FRANCE FLUORESCENT PAINT MARKET, BY TYPE, 2021-2031 (REVENUE, $MILLION)
    TABLE 52. FRANCE FLUORESCENT PAINT MARKET, BY TYPE, 2021-2031 (VOLUME, KILOLITRES)
    TABLE 53. FRANCE FLUORESCENT PAINT MARKET, BY APPLICATION, 2021-2031 (REVENUE, $MILLION)
    TABLE 54. FRANCE FLUORESCENT PAINT MARKET, BY APPLICATION, 2021-2031 (VOLUME, KILOLITRES)
    TABLE 55. ITALY FLUORESCENT PAINT MARKET, BY TYPE, 2021-2031 (REVENUE, $MILLION)
    TABLE 56. ITALY FLUORESCENT PAINT MARKET, BY TYPE, 2021-2031 (VOLUME, KILOLITRES)
    TABLE 57. ITALY FLUORESCENT PAINT MARKET, BY APPLICATION, 2021-2031 (REVENUE, $MILLION)
    TABLE 58. ITALY FLUORESCENT PAINT MARKET, BY APPLICATION, 2021-2031 (VOLUME, KILOLITRES)
    TABLE 59. UK FLUORESCENT PAINT MARKET, BY TYPE, 2021-2031 (REVENUE, $MILLION)
    TABLE 60. UK FLUORESCENT PAINT MARKET, BY TYPE, 2021-2031 (VOLUME, KILOLITRES)
    TABLE 61. UK FLUORESCENT PAINT MARKET, BY APPLICATION, 2021-2031 (REVENUE, $MILLION)
    TABLE 62. UK FLUORESCENT PAINT MARKET, BY APPLICATION, 2021-2031 (VOLUME, KILOLITRES)
    TABLE 63. SPAIN FLUORESCENT PAINT MARKET, BY TYPE, 2021-2031 (REVENUE, $MILLION)
    TABLE 64. SPAIN FLUORESCENT PAINT MARKET, BY TYPE, 2021-2031 (VOLUME, KILOLITRES)
    TABLE 65. SPAIN FLUORESCENT PAINT MARKET, BY APPLICATION, 2021-2031 (REVENUE, $MILLION)
    TABLE 66. SPAIN FLUORESCENT PAINT MARKET, BY APPLICATION, 2021-2031 (VOLUME, KILOLITRES)
    TABLE 67. REST OF EUROPE FLUORESCENT PAINT MARKET, BY TYPE, 2021-2031 (REVENUE, $MILLION)
    TABLE 68. REST OF EUROPE FLUORESCENT PAINT MARKET, BY TYPE, 2021-2031 (VOLUME, KILOLITRES)
    TABLE 69. REST OF EUROPE FLUORESCENT PAINT MARKET, BY APPLICATION, 2021-2031 (REVENUE, $MILLION)
    TABLE 70. REST OF EUROPE FLUORESCENT PAINT MARKET, BY APPLICATION, 2021-2031 (VOLUME, KILOLITRES)
    TABLE 71. ASIA-PACIFIC FLUORESCENT PAINT MARKET, BY TYPE, 2021-2031 (REVENUE, $MILLION)
    TABLE 72. ASIA-PACIFIC FLUORESCENT PAINT MARKET, BY TYPE, 2021-2031 (VOLUME, KILOLITRES)
    TABLE 73. ASIA-PACIFIC FLUORESCENT PAINT MARKET, BY APPLICATION, 2021-2031 (REVENUE, $MILLION)
    TABLE 74. ASIA-PACIFIC FLUORESCENT PAINT MARKET, BY APPLICATION, 2021-2031 (VOLUME, KILOLITRES)
    TABLE 75. ASIA-PACIFIC FLUORESCENT PAINT MARKET, BY COUNTRY, 2021-2031 (REVENUE, $MILLION)
    TABLE 76. ASIA-PACIFIC FLUORESCENT PAINT MARKET, BY COUNTRY, 2021-2031 (VOLUME, KILOLITRES)
    TABLE 77. CHINA FLUORESCENT PAINT MARKET, BY TYPE, 2021-2031 (REVENUE, $MILLION)
    TABLE 78. CHINA FLUORESCENT PAINT MARKET, BY TYPE, 2021-2031 (VOLUME, KILOLITRES)
    TABLE 79. CHINA FLUORESCENT PAINT MARKET, BY APPLICATION, 2021-2031 (REVENUE, $MILLION)
    TABLE 80. CHINA FLUORESCENT PAINT MARKET, BY APPLICATION, 2021-2031 (VOLUME, KILOLITRES)
    TABLE 81. INDIA FLUORESCENT PAINT MARKET, BY TYPE, 2021-2031 (REVENUE, $MILLION)
    TABLE 82. INDIA FLUORESCENT PAINT MARKET, BY TYPE, 2021-2031 (VOLUME, KILOLITRES)
    TABLE 83. INDIA FLUORESCENT PAINT MARKET, BY APPLICATION, 2021-2031 (REVENUE, $MILLION)
    TABLE 84. INDIA FLUORESCENT PAINT MARKET, BY APPLICATION, 2021-2031 (VOLUME, KILOLITRES)
    TABLE 85. JAPAN FLUORESCENT PAINT MARKET, BY TYPE, 2021-2031 (REVENUE, $MILLION)
    TABLE 86. JAPAN FLUORESCENT PAINT MARKET, BY TYPE, 2021-2031 (VOLUME, KILOLITRES)
    TABLE 87. JAPAN FLUORESCENT PAINT MARKET, BY APPLICATION, 2021-2031 (REVENUE, $MILLION)
    TABLE 88. JAPAN FLUORESCENT PAINT MARKET, BY APPLICATION, 2021-2031 (VOLUME, KILOLITRES)
    TABLE 89. SOUTH KOREA FLUORESCENT PAINT MARKET, BY TYPE, 2021-2031 (REVENUE, $MILLION)
    TABLE 90. SOUTH KOREA FLUORESCENT PAINT MARKET, BY TYPE, 2021-2031 (VOLUME, KILOLITRES)
    TABLE 91. SOUTH KOREA FLUORESCENT PAINT MARKET, BY APPLICATION, 2021-2031 (REVENUE, $MILLION)
    TABLE 92. SOUTH KOREA FLUORESCENT PAINT MARKET, BY APPLICATION, 2021-2031 (VOLUME, KILOLITRES)
    TABLE 93. AUSTRALIA FLUORESCENT PAINT MARKET, BY TYPE, 2021-2031 (REVENUE, $MILLION)
    TABLE 94. AUSTRALIA FLUORESCENT PAINT MARKET, BY TYPE, 2021-2031 (VOLUME, KILOLITRES)
    TABLE 95. AUSTRALIA FLUORESCENT PAINT MARKET, BY APPLICATION, 2021-2031 (REVENUE, $MILLION)
    TABLE 96. AUSTRALIA FLUORESCENT PAINT MARKET, BY APPLICATION, 2021-2031 (VOLUME, KILOLITRES)
    TABLE 97. REST OF ASIA-PACIFIC FLUORESCENT PAINT MARKET, BY TYPE, 2021-2031 (REVENUE, $MILLION)
    TABLE 98. REST OF ASIA-PACIFIC FLUORESCENT PAINT MARKET, BY TYPE, 2021-2031 (VOLUME, KILOLITRES)
    TABLE 99. REST OF ASIA-PACIFIC FLUORESCENT PAINT MARKET, BY APPLICATION, 2021-2031 (REVENUE, $MILLION)
    TABLE 100. REST OF ASIA-PACIFIC FLUORESCENT PAINT MARKET, BY APPLICATION, 2021-2031 (VOLUME, KILOLITRES)
    TABLE 101. LAMEA FLUORESCENT PAINT MARKET, BY TYPE, 2021-2031 (REVENUE, $MILLION)
    TABLE 102. LAMEA FLUORESCENT PAINT MARKET, BY TYPE, 2021-2031 (VOLUME, KILOLITRES)
    TABLE 103. LAMEA FLUORESCENT PAINT MARKET, BY APPLICATION, 2021-2031 (REVENUE, $MILLION)
    TABLE 104. LAMEA FLUORESCENT PAINT MARKET, BY APPLICATION, 2021-2031 (VOLUME, KILOLITRES)
    TABLE 105. LAMEA FLUORESCENT PAINT MARKET, BY COUNTRY, 2021-2031 (REVENUE, $MILLION)
    TABLE 106. LAMEA FLUORESCENT PAINT MARKET, BY COUNTRY, 2021-2031 (VOLUME, KILOLITRES)
    TABLE 107. BRAZIL FLUORESCENT PAINT MARKET, BY TYPE, 2021-2031 (REVENUE, $MILLION)
    TABLE 108. BRAZIL FLUORESCENT PAINT MARKET, BY TYPE, 2021-2031 (VOLUME, KILOLITRES)
    TABLE 109. BRAZIL FLUORESCENT PAINT MARKET, BY APPLICATION, 2021-2031 (REVENUE, $MILLION)
    TABLE 110. BRAZIL FLUORESCENT PAINT MARKET, BY APPLICATION, 2021-2031 (VOLUME, KILOLITRES)
    TABLE 111. SAUDI ARABIA FLUORESCENT PAINT MARKET, BY TYPE, 2021-2031 (REVENUE, $MILLION)
    TABLE 112. SAUDI ARABIA FLUORESCENT PAINT MARKET, BY TYPE, 2021-2031 (VOLUME, KILOLITRES)
    TABLE 113. SAUDI ARABIA FLUORESCENT PAINT MARKET, BY APPLICATION, 2021-2031 (REVENUE, $MILLION)
    TABLE 114. SAUDI ARABIA FLUORESCENT PAINT MARKET, BY APPLICATION, 2021-2031 (VOLUME, KILOLITRES)
    TABLE 115. SOUTH AFRICA FLUORESCENT PAINT MARKET, BY TYPE, 2021-2031 (REVENUE, $MILLION)
    TABLE 116. SOUTH AFRICA FLUORESCENT PAINT MARKET, BY TYPE, 2021-2031 (VOLUME, KILOLITRES)
    TABLE 117. SOUTH AFRICA FLUORESCENT PAINT MARKET, BY APPLICATION, 2021-2031 (REVENUE, $MILLION)
    TABLE 118. SOUTH AFRICA FLUORESCENT PAINT MARKET, BY APPLICATION, 2021-2031 (VOLUME, KILOLITRES)
    TABLE 119. REST OF LAMEA FLUORESCENT PAINT MARKET, BY TYPE, 2021-2031 (REVENUE, $MILLION)
    TABLE 120. REST OF LAMEA FLUORESCENT PAINT MARKET, BY TYPE, 2021-2031 (VOLUME, KILOLITRES)
    TABLE 121. REST OF LAMEA FLUORESCENT PAINT MARKET, BY APPLICATION, 2021-2031 (REVENUE, $MILLION)
    TABLE 122. REST OF LAMEA FLUORESCENT PAINT MARKET, BY APPLICATION, 2021-2031 (VOLUME, KILOLITRES)
    TABLE 123. RADIANT COLOR N.V.: KEY EXECUTIVES
    TABLE 124. RADIANT COLOR N.V.: COMPANY SNAPSHOT
    TABLE 125. RADIANT COLOR N.V.: PRODUCT SEGMENTS
    TABLE 126. RADIANT COLOR N.V.: PRODUCT PORTFOLIO
    TABLE 127. LUMINOCHEM: KEY EXECUTIVES
    TABLE 128. LUMINOCHEM: COMPANY SNAPSHOT
    TABLE 129. LUMINOCHEM: PRODUCT SEGMENTS
    TABLE 130. LUMINOCHEM: PRODUCT PORTFOLIO
    TABLE 131. LUMINOCHEM: KEY STRATERGIES
    TABLE 132. ARON UNIVERSAL LIMITED: KEY EXECUTIVES
    TABLE 133. ARON UNIVERSAL LIMITED: COMPANY SNAPSHOT
    TABLE 134. ARON UNIVERSAL LIMITED: PRODUCT SEGMENTS
    TABLE 135. ARON UNIVERSAL LIMITED: PRODUCT PORTFOLIO
    TABLE 136. RONAN PAINTS: KEY EXECUTIVES
    TABLE 137. RONAN PAINTS: COMPANY SNAPSHOT
    TABLE 138. RONAN PAINTS: PRODUCT SEGMENTS
    TABLE 139. RONAN PAINTS: PRODUCT PORTFOLIO
    TABLE 140. GLOW PAINT INDUSTRIES: KEY EXECUTIVES
    TABLE 141. GLOW PAINT INDUSTRIES: COMPANY SNAPSHOT
    TABLE 142. GLOW PAINT INDUSTRIES: PRODUCT SEGMENTS
    TABLE 143. GLOW PAINT INDUSTRIES: PRODUCT PORTFOLIO
    TABLE 144. GLOWTEC LTD: KEY EXECUTIVES
    TABLE 145. GLOWTEC LTD: COMPANY SNAPSHOT
    TABLE 146. GLOWTEC LTD: PRODUCT SEGMENTS
    TABLE 147. GLOWTEC LTD: PRODUCT PORTFOLIO
    TABLE 148. KRYLON PRODUCTS GROUP: KEY EXECUTIVES
    TABLE 149. KRYLON PRODUCTS GROUP: COMPANY SNAPSHOT
    TABLE 150. KRYLON PRODUCTS GROUP: PRODUCT SEGMENTS
    TABLE 151. KRYLON PRODUCTS GROUP: PRODUCT PORTFOLIO
    TABLE 152. DAYGLO COLOR CORP: KEY EXECUTIVES
    TABLE 153. DAYGLO COLOR CORP: COMPANY SNAPSHOT
    TABLE 154. DAYGLO COLOR CORP: PRODUCT SEGMENTS
    TABLE 155. DAYGLO COLOR CORP: PRODUCT PORTFOLIO
    TABLE 156. BRILLIANT GROUP, INC.: KEY EXECUTIVES
    TABLE 157. BRILLIANT GROUP, INC.: COMPANY SNAPSHOT
    TABLE 158. BRILLIANT GROUP, INC.: PRODUCT SEGMENTS
    TABLE 159. BRILLIANT GROUP, INC.: PRODUCT PORTFOLIO
    TABLE 160. BRILLIANT GROUP, INC.: KEY STRATERGIES
    TABLE 161. VICOME CORP.: KEY EXECUTIVES
    TABLE 162. VICOME CORP.: COMPANY SNAPSHOT
    TABLE 163. VICOME CORP.: PRODUCT SEGMENTS
    TABLE 164. VICOME CORP.: PRODUCT PORTFOLIO
  • LIST OF FIGURES

  • FIGURE 01. FLUORESCENT PAINT MARKET, 2021-2031
    FIGURE 02. SEGMENTATION OF FLUORESCENT PAINT MARKET, 2021-2031
    FIGURE 03. TOP INVESTMENT POCKETS IN FLUORESCENT PAINT MARKET (2022-2031)
    FIGURE 04. MODERATE BARGAINING POWER OF SUPPLIERS
    FIGURE 05. MODERATE BARGAINING POWER OF BUYERS
    FIGURE 06. MODERATE THREAT OF SUBSTITUTES
    FIGURE 07. MODERATE THREAT OF NEW ENTRANTS
    FIGURE 08. LOW INTENSITY OF RIVALRY
    FIGURE 09. DRIVERS, RESTRAINTS AND OPPORTUNITIES: GLOBALFLUORESCENT PAINT MARKET
    FIGURE 10. MARKET SHARE ANALYSIS: FLUORESCENT PAINT MARKET
    FIGURE 11. PATENT ANALYSIS BY COMPANY
    FIGURE 12. PATENT ANALYSIS BY COUNTRY
    FIGURE 13. PRICING ANALYSIS: FLUORESCENT PAINT MARKET 2021 AND 2031
    FIGURE 14. VALUE CHAIN ANALYSIS: FLUORESCENT PAINT MARKET
    FIGURE 15. FLUORESCENT PAINT MARKET, BY TYPE, 2021(%)
    FIGURE 16. COMPARATIVE SHARE ANALYSIS OF FLUORESCENT PAINT MARKET FOR INORGANIC FLUORESCENTS, BY COUNTRY 2021-2031(%)
    FIGURE 17. COMPARATIVE SHARE ANALYSIS OF FLUORESCENT PAINT MARKET FOR OPTICAL WHITENERS, BY COUNTRY 2021-2031(%)
    FIGURE 18. COMPARATIVE SHARE ANALYSIS OF FLUORESCENT PAINT MARKET FOR DAYLIGHT FLUORESCENTS, BY COUNTRY 2021-2031(%)
    FIGURE 19. FLUORESCENT PAINT MARKET, BY APPLICATION, 2021(%)
    FIGURE 20. COMPARATIVE SHARE ANALYSIS OF FLUORESCENT PAINT MARKET FOR SAFETY EQUIPMENT, BY COUNTRY 2021-2031(%)
    FIGURE 21. COMPARATIVE SHARE ANALYSIS OF FLUORESCENT PAINT MARKET FOR COMMERCIAL BUILDINGS, BY COUNTRY 2021-2031(%)
    FIGURE 22. COMPARATIVE SHARE ANALYSIS OF FLUORESCENT PAINT MARKET FOR ROAD LINE MARKINGS, BY COUNTRY 2021-2031(%)
    FIGURE 23. COMPARATIVE SHARE ANALYSIS OF FLUORESCENT PAINT MARKET FOR FACILITIES, BY COUNTRY 2021-2031(%)
    FIGURE 24. COMPARATIVE SHARE ANALYSIS OF FLUORESCENT PAINT MARKET FOR OTHERS, BY COUNTRY 2021-2031(%)
    FIGURE 25. FLUORESCENT PAINT MARKET BY REGION, 2021
    FIGURE 26. U.S. FLUORESCENT PAINT MARKET, 2021-2031 ($MILLION)
    FIGURE 27. CANADA FLUORESCENT PAINT MARKET, 2021-2031 ($MILLION)
    FIGURE 28. MEXICO FLUORESCENT PAINT MARKET, 2021-2031 ($MILLION)
    FIGURE 29. GERMANY FLUORESCENT PAINT MARKET, 2021-2031 ($MILLION)
    FIGURE 30. FRANCE FLUORESCENT PAINT MARKET, 2021-2031 ($MILLION)
    FIGURE 31. ITALY FLUORESCENT PAINT MARKET, 2021-2031 ($MILLION)
    FIGURE 32. UK FLUORESCENT PAINT MARKET, 2021-2031 ($MILLION)
    FIGURE 33. SPAIN FLUORESCENT PAINT MARKET, 2021-2031 ($MILLION)
    FIGURE 34. REST OF EUROPE FLUORESCENT PAINT MARKET, 2021-2031 ($MILLION)
    FIGURE 35. CHINA FLUORESCENT PAINT MARKET, 2021-2031 ($MILLION)
    FIGURE 36. INDIA FLUORESCENT PAINT MARKET, 2021-2031 ($MILLION)
    FIGURE 37. JAPAN FLUORESCENT PAINT MARKET, 2021-2031 ($MILLION)
    FIGURE 38. SOUTH KOREA FLUORESCENT PAINT MARKET, 2021-2031 ($MILLION)
    FIGURE 39. AUSTRALIA FLUORESCENT PAINT MARKET, 2021-2031 ($MILLION)
    FIGURE 40. REST OF ASIA-PACIFIC FLUORESCENT PAINT MARKET, 2021-2031 ($MILLION)
    FIGURE 41. BRAZIL FLUORESCENT PAINT MARKET, 2021-2031 ($MILLION)
    FIGURE 42. SAUDI ARABIA FLUORESCENT PAINT MARKET, 2021-2031 ($MILLION)
    FIGURE 43. SOUTH AFRICA FLUORESCENT PAINT MARKET, 2021-2031 ($MILLION)
    FIGURE 44. REST OF LAMEA FLUORESCENT PAINT MARKET, 2021-2031 ($MILLION)
    FIGURE 45. TOP WINNING STRATEGIES, BY YEAR
    FIGURE 46. TOP WINNING STRATEGIES, BY DEVELOPMENT
    FIGURE 47. TOP WINNING STRATEGIES, BY COMPANY
    FIGURE 48. PRODUCT MAPPING OF TOP 10 PLAYERS
    FIGURE 49. COMPETITIVE DASHBOARD
    FIGURE 50. COMPETITIVE HEATMAP: FLUORESCENT PAINT MARKET
    FIGURE 51. TOP PLAYER POSITIONING, 2021


According to the insights of the CXOs of leading companies, the global market for fluorescent paint has shown significant expansion in recent years, and the same trajectory is expected to be followed in the next 8-10 years. Key market drivers for fluorescent paint include the expanding paints and coatings market and its application in various end-use industries, rapid urbanization, the construction sector, the textile industry, the plastics industry, and the building material industry. In addition, the global manufacturers of fluorescent paint are prioritizing the use of considerable amounts of colorants, functional pigments, and extenders to formulate pigments that may be used in a variety of industries. Emerging economies, such as India and China, are anticipated to have a significant need for fluorescent paint. As a result of its durability, this fluorescent paint is also utilized in the automotive industry. The automobile industry in developing nations, as well as the coatings and plastics industries, are thriving at a rapid rate, particularly in growing economies such as India and China. As a result, the need for fluorescent paint is anticipated to increase in these nations. However, the adverse and harmful environmental impacts of fluorescent paint may act as a barrier to its global adoption.

PURCHASE OPTIONS

Call or Email us

U.S.-Canada Toll-free: +1-800-792-5285
Int'l : +1-503-894-6022
Europe : +44-845-528-1300
Email : help@alliedmarketresearch.com
 
FREQUENTLY ASKED QUESTIONS?

A. The fluorescent paint market attained $357.3 million in 2021 and is projected to reach $677.9 million by 2031, growing at a CAGR of 6.8% from 2022 to 2031.

A. The fluorescent paint market is segmented into type, application, and region. Depending on the type, the market is divided into Inorganic fluorescents, optical whiteners, and daylight fluorescents. On the basis of application, it is categorized into safety equipment, commercial buildings, road line markings, facilities, and others.

A. Radiant Color N.V., LuminoChem, Ronan Paints, Glow Paint Industries, GLOWTEC LTD, Krylon Products Group, DayGlo Color Corp, are the top companies to hold the market share in Fluorescent Paint.

A. The daylight fluorescents segment is the leading type of the Fluorescent Paint Market.

A. Increasing use of optical whiteners in coated and uncoated paper industry and increasing demand from building and construction industry are the driving factors of Fluorescent Paint Market .

A. Asia-Pacific is the largest regional market for Fluorescent Paint.

A. The safety equipment segment is the leading application of Fluorescent Paint Market.

Looking for Customization?

 Customization Request

Have a Question?

 Speak with Analyst

Any Confusion?

 Inquire Before Buying

Have a glance of the Report

  Request Sample
RELATED TAGS

Purchase Full Report of
Fluorescent Paint Market

Start reading instantly.
This Report and over 67,404+ more Reports, Available with Avenue Library. T&C*.

  • Online Only
  • $3,570
  • Online cloud access only
  • Restricted print, copy, paste & download
  • Read only
  • Free industry update
    (Within 180 days)
  • Free report update in next update cycle
    (Jan 2024 - Jan 2025)
  • Data Pack
  • $3,840
  • Restricted to one authorized user
  • One print only
  • Available in
    Excel
  • Free industry update
    (Within 180 days)
  •   Free report update in next update cycle
    (Jan 2024 - Jan 2025)
  • Single User
  • $5,730
  • Restricted to one authorized user
  • One print only
  • Available in
    PDF
  • Free industry update
    (Within 180 days)
  •   Free report update in next update cycle
    (Jan 2024 - Jan 2025)
  • Five Users
  • $6,450
  • Limited to five authorized users
  • Print upto five copies
  • Available in
    PDF
  • Free industry update
    (Within 180 days)
  •   Free report update in next update cycle
    (Jan 2024 - Jan 2025)
  • Enterprise
    License/PDF

  • $9,600
  • Unlimited
    within
    company/enterprise
  • Available in Excel & PDF
  • Free industry update
    (Within 180 days)
  •   Free report update in next update cycle
    (Jan 2024 - Jan 2025)
  • Library
    Membership

  • $999 $ 1,175
    Per User/ Per month/ Billed annually
  • Published Content
    E-access
  • Company Profiles
    E-access
  • Newly Added Content Access
  • 10 PDF
    Downloads
  • 5 Excel Data
    Pack Downloads
  • 250 Company Profiles PDF Downloads
  • Buy Now

*Taxes/Fees, if applicable will be added during checkout. All prices in USD

RELATED REPORTS
 

Why Allied Market Research?


Infallible Methodology

To ensure high-level data integrity, accurate analysis, and impeccable forecasts

Analyst Support

For complete satisfaction

Customization

On-demand customization of scope of the report to exactly meet your needs

TARGETED MARKET VIEW

Targeted market view to provide pertinent information and save time of readers

Get fresh content delivered

Get insights on topics that are crucial for your business. Stay abreast of your interest areas.

Get Industry Data Alerts

Why Allied Market Research?

Infallible Methodology

To ensure high-level data integrity, accurate analysis, and impeccable forecasts

Analyst Support

For complete satisfaction

Customization

On-demand customization of scope of the report to exactly meet your needs

TARGETED MARKET VIEW

Targeted market view to provide pertinent information and save time of readers