Fluoropolymers Market by Product Type (PTFE, FEP, PVDF, Fluoroelastomer, PVF, PFA, ETFE, and Others), Application (Film, Tube, Sheet, Pipe, Membrane, Sealant, Roofing, Additives, and Others), and End-Use Industry (Transportation Equipment, Electrical & Electronics, Construction, Industrial Equipment, and Others): Global Opportunity Analysis and Industry Forecast 2020–2027
A01979 | Pages: 491 | Aug 2020 | 7258 Views | | |
Author(s) : Snehal Mohite, Rutuja Danekar , Eswara Prasad | Tables: 321 | Charts: 15 | Formats*: | |
COVID-19
Pandemic disrupted the entire world and affected many industries.
Get detailed COVID-19 impact analysis on the Fluoropolymers Market
Request Now !Fluoropolymers Market Outlook - 2027
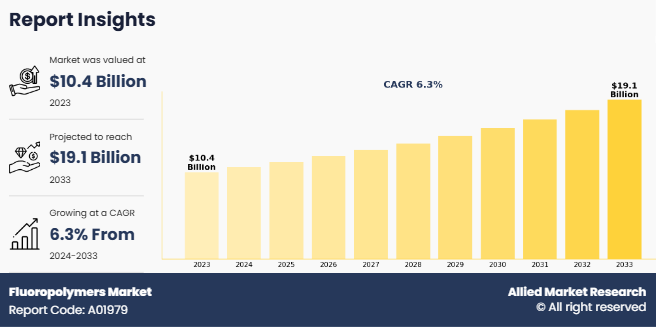
The global fluoropolymers market was valued at $7.7 billion in 2019, and is projected to reach $11.7 billion by 2027, growing at a CAGR of 6.5% from 2020 to 2027.
Due to the COVID -19 crisis the automotive and aerospace industries have experienced a significant decline owing to the lack of labor, production facility closures and so on. This resulted in decline of fluoropolymers demand globally.
Fluoropolymer is a chemical compound, containing bonds of carbon fluoride. It offers different properties such as chemical resistance, electrical and mechanical insulation, thermal resistance, stress cracking, and others. For many applications, these properties pave the way for fluoropolymers, from coatings to industrial films. It is also used in domestic uses, building, and electrical & electronics.
Get more information on this report : Request Sample Pages
The global market growth is driven primarily by rise in demand from the end-use application sectors. Fluoropolymers have various beneficial properties. They are highly lubricant, biocompatible, and have excellent dielectric applications. They are thus gaining growing demand from the medical sector, especially for medical surgery. Currently, it is common to use plastic items in many different surgeries, such as corneas or heart valves. Such products can affect the body toxically, as they are not biocompatible. This also raises significant long-term questions about the overall health of the patient. This made the use of fluoropolymers in such medical procedures extremely attractive.
The global fluoropolymers market is segmented on the basis of product type, application, end-use industry, and region. On the basis of product type, the market is divided into PTFE, FEP, PVDF, Fluoroelastomer, PVF, PFA, ETFE, and others. The others sub-segment is further divided into PCTFE, ECTFE, and others. Depending on application, the fluoropolymers market is divided into film, tube, sheet, pipe, membrane, sealant, roofing, additives, and others.
By end-use industry, the market is segmented into transportation equipment, electrical and electronics, construction, industrial equipment, and others. The transportation segment is further divided into automotive vehicles, aerospace, and others. Whereas, the electrical and electronics segment is divided into wire & cable, photovoltaic modules, batteries, and fuel cells. Industrial equipment is further separated into chemical & pharmaceutical equipment, semiconductor manufacturing equipment, and other industrial process. The others segment is categorized into cookware, textiles, lubricants, and others. Region wise, the fluoropolymers market is analyzed across North America, Europe, Asia-Pacific, and LAMEA.
The market players operating in the global fluoropolymers market are Arkema SA, Asahi Glass Company Limited, The Chemours Company, Daikin Industries, Dongue Group, Dupont, Honeywell, Mitsubishi Chemical, SABIC Innovative Plastics, Saint-Gobain, Shin-Etsu Chemical, Solvay SA, and 3M Company.
Fluoropolymers Market
By Type
PTFE is projected as the most lucrative segment.
Get more information on this report : Request Sample Pages
Fluoropolymers Market, By Product Type
By product type, the PTFE segment dominated the fluoropolymers market in 2019, and is projected to remain the fastest-growing segment. PTFE exhibits excellent chemical & thermal resistance, very low coefficient of friction, and high electrical insulation. It is used in a wide range of applications such as semiconductors, automotive components, electrical appliances, and non-stick frying pans.
Fluoropolymers Market
By Application
Pipe is projected as the most lucrative segment.
Get more information on this report : Request Sample Pages
Fluoropolymers Market, By Application
By application, the pipes segment accounted for the highest market share of around 30.1% in 2019, and is projected to maintain the same during the forecast period. Fluoropolymers pipes are commonly used by petrochemicals, pharmaceuticals, chemicals, and almost every business involved in the handling of extremely volatile and corrosive solvents and acids for their manufacturing needs.
Fluoropolymers Market
By End-use Industry
Industrial Equipment is projected as the most lucrative segment.
Get more information on this report : Request Sample Pages
Fluoropolymers Market, By End-Use Industry
By end-use industry, the industrial equipment segment accounted for around 39.8% of the fluoropolymers market share in 2019. Fluoropolymers are widely used in industrial processing industries for various applications such as pumps, impellers, tanks, heat exchanger coatings, reaction vessels, autoclaves, flue duct expansion joints, and others.
Fluoropolymers Market
By Region
Asia-Pacific holds a dominant position in 2019 and would continue to maintain the lead over the forecast period.
Get more information on this report : Request Sample Pages
Fluoropolymers Market, By Region
By region, Asia-Pacific is projected to be the fastest growing market, owing to rise in demand for fluoropolymers products. The presence of large manufacturing hubs in China and India drives the Asia-Pacific fluoropolymers market, owing to increase in demand for high-quality medical, automotive, consumer, and electronics products.
Key Benefits For Stakeholders
- The report provides an in-depth analysis of the fluoropolymers market trends along with the current and future market forecast.
- This report highlights the key drivers, opportunities, and restraints of the market along with the impact analyses during the forecast period.
- Porter’s five forces analysis helps analyze the potential of the buyers & suppliers and the competitive scenario of the fluoropolymers industry for strategy building.
- A comprehensive fluoropolymers market analysis covers factors that drive and restrain the market growth.
- The qualitative data in this report aims on market dynamics, trends, and developments.
Impact Of Covid-19 On The Fluoropolymers Market
- The COVID-19 fallout is unprecedented. There is uneven impact of COVID-19 pandemic on the fluoropolymers market, due to the lockdown implemented in almost every economy across the globe to break the chain of spreading of coronavirus. This resulted in shutting off the operations, manufacturing, distribution, and retail stores. Thus, there is decrease in demand for end products from the various end-use industries due to shutdown, which in turn resulted in the sluggish growth in the current year.
- The automotive and aerospace industries are the largest consumer’s fluoropolymers globally, and due to the current COVID -9 crisis these industries have experienced a significant decline. The automotive industry is dealing with a sudden and widespread cessation of economic activity as workers are ordered to stay at home, grind production chains to a halt, and close factories. The lockout restricting people's movement and the abrupt cessation of economic activity culminated in a significant contraction in sectorial production and GDP. Factory closures in Europe and North America are reported to have triggered the withdrawal of some millions of passenger vehicles from the production schedules. These declines in production have a cascading effect, which affects the OEMs and suppliers of material. Both of these factors have impacted fluoropolymer demand.
- The pandemic also had a significant influence on aviation manufacturing. For instance, Airbus-one of the largest commercial aircraft manufacturing firms worldwide, due to the COVID-19 pandemic has reduced its aircraft production levels by around one-third. Boeing had also posted a loss of USD 641 million in the first quarter. This greatly influenced the use of fluoropolymers used in the manufacture of new aircraft, as well as MRO operations.
- However, the demand for medical grade fluoropolymers is bombing at significant peace. Owing to corona outbreak there is high demand for testing and other health equipment. Which in turn to drive the global fluoropolymer market in near future.
Key Market Segments
By Product Type
- PTFE
- FEP
- PVDF
- Fluoroelastomer
- PVF
- PFA
- ETFE
- Others
- PCTFE
- ECTFE
- Others
By Application
- Film
- Tube
- Sheet
- Pipe
- Membrane
- Sealant
- Roofing
- Additives
- Others
By End-Use Industry
- Transportation Equipment
- Automotive Vehicles
- Aerospace
- Others
- Electrical and Electronics
- Wire and Cable
- Photovoltaic Modules
- Batteries
- Fuel Cells
- Construction
- Industrial Equipment
- Chemical and Pharmaceutical Equipment
- Semiconductor Manufacturing Equipment
- Other Industrial Process
- Others
- Cookware
- Textiles
- Lubricants
- Others
By Region
- North America
- U.S.
- Canada
- Mexico
- Europe
- Germany
- France
- Italy
- Spain
- UK
- Rest of Europe
- Asia-Pacific
- China
- Japan
- India
- South Korea
- Australia
- Rest of Asia-Pacific
- LAMEA
- Brazil
- Saudi Arabia
- South Africa
- UAE
- Argentina
- Rest of LAMEA
CHAPTER 1:INTRODUCTION
1.1.Report description
1.2.Key benefits for stakeholders
1.3.Key market segments
1.4.Research methodology
1.4.1.Primary research
1.4.2.Secondary research
1.4.3.Analyst tools and models
CHAPTER 2:EXECUTIVE SUMMARY
2.1.Key findings
2.1.1.Top investment pockets
2.2.CXO perspective
CHAPTER 3:MARKET OVERVIEW
3.1.Market definition and scope
3.2.Fluoropolymer types and properties
3.3.Key forces shaping the fluoropolymers market
3.4.Value chain analysis
3.5.Market share analysis
3.6.Patent analysis
3.6.1.By region (2013-2020)
3.7.Market dynamics
3.7.1.Drivers
3.7.1.1.Advancements in medical applications
3.7.1.2.High demand in the end-use industries
3.7.2.Restraints
3.7.2.1.Raising prices of PTFE
3.7.3.Opportunities
3.7.3.1.Increase in use of fluoropolymer films in the construction and energy sectors
3.8.Pricing analysis
3.9.Parent market outlook
3.10.Import–export outlook
3.10.1.Trade analysis of PTFE
3.10.2.Trade analysis of fluoropolymers (Excluding PTFE)
3.11.Production–consumption outlook
3.12.Impact of key regulation on the global fluoropolymers market
3.13.Impact of CORONA (COVID-19) outbreak on the global fluoropolymers market
CHAPTER 4:FLUOROPOLYMERS MARKET, BY PRODUCT TYPE
4.1.Overview
4.1.1.Market size and forecast
4.2.Polytetrafluoroethylene (PTFE)
4.2.1.Key market trends, growth factors, and opportunities
4.2.2.Market size and forecast, by region
4.2.3.Market share analysis, by country
4.3.Fluorinated ethylene-propylene (FEP)
4.3.1.Key market trends, growth factors, and opportunities
4.3.2.Market size and forecast, by region
4.3.3.Market share analysis, by country
4.4.Polyvinylidene fluoride (PVDF)
4.4.1.Key market trends, growth factors, and opportunities
4.4.2.Market size and forecast, by region
4.4.3.Market share analysis, by country
4.5.Fluoroelastomer
4.5.1.Key market trends, growth factors, and opportunities
4.5.2.Market size and forecast, by region
4.5.3.Market share analysis, by country
4.6.Polyvinyl fluoride (PVF)
4.6.1.Key market trends, growth factors, and opportunities
4.6.2.Market size and forecast, by region
4.6.3.Market share analysis, by country
4.7.Perfluoroalkoxy polymer (PFA)
4.7.1.Key market trends, growth factors, and opportunities
4.7.2.Market size and forecast, by region
4.7.3.Market share analysis, by country
4.8.Ethylene tetrafluoroethylene (ETFE)
4.8.1.Key market trends, growth factors, and opportunities
4.8.2.Market size and forecast, by region
4.8.3.Market share analysis, by country
4.9.Others
4.9.1.Key market trends, growth factors, and opportunities
4.9.1.1.PCTFE
4.9.1.2.ECTFE
4.9.1.3.Others
4.9.2.Market size and forecast, by region
4.9.3.Market size and forecast, by others type
4.9.4.Market share analysis, by country
CHAPTER 5:FLUOROPOLYMERS MARKET, BY APPLICATION
5.1.Overview
5.1.1.Market size and forecast
5.2.Film
5.2.1.Key market trends, growth factors, and opportunities
5.2.2.Market size and forecast, by region
5.2.3.Market share analysis, by country
5.3.Tube
5.3.1.Key market trends, growth factors, and opportunities
5.3.2.Market size and forecast, by region
5.3.3.Market share analysis, by country
5.4.Sheet
5.4.1.Key market trends, growth factors, and opportunities
5.4.2.Market size and forecast, by region
5.4.3.Market share analysis, by country
5.5.Pipe
5.5.1.Key market trends, growth factors, and opportunities
5.5.2.Market size and forecast, by region
5.5.3.Market share analysis, by country
5.6.Membrane
5.6.1.Key market trends, growth factors, and opportunities
5.6.2.Market size and forecast, by region
5.6.3.Market share analysis, by country
5.7.Sealant
5.7.1.Key market trends, growth factors, and opportunities
5.7.2.Market size and forecast, by region
5.7.3.Market share analysis, by country
5.8.Roofing
5.8.1.Key market trends, growth factors, and opportunities
5.8.2.Market size and forecast, by region
5.8.3.Market share analysis, by country
5.9.Additives
5.9.1.Key market trends, growth factors, and opportunities
5.9.2.Market size and forecast, by region
5.9.3.Market share analysis, by country
5.10.Others
5.10.1.Key market trends, growth factors, and opportunities
5.10.2.Market size and forecast, by region
5.10.3.Market share analysis, by country
CHAPTER 6:FLUOROPOLYMERS MARKET, BY END-USE INDUSTRY
6.1.Overview
6.1.1.Market size and forecast
6.2.Transportation equipment
6.2.1.Key market trends, growth factors, and opportunities
6.2.1.1.Automotive vehicles
6.2.1.2.Aerospace
6.2.1.3.Others
6.2.2.Market size and forecast, by region
6.2.3.Market share analysis, by country
6.2.4.Market size and forecast, by Transportation Equipment
6.3.Electrical and electronics
6.3.1.Key market trends, growth factors, and opportunities
6.3.1.1.Wire and cable
6.3.1.2.Photovoltaic modules
6.3.1.3.Batteries
6.3.1.4.Fuel cells
6.3.2.Market size and forecast, by region
6.3.3.Market share analysis, by country
6.3.4.Market size and forecast, by electrical and electronics
6.4.Construction
6.4.1.Key market trends, growth factors, and opportunities
6.4.2.Market size and forecast, by region
6.4.3.Market share analysis, by country
6.5.Industrial equipment
6.5.1.Key market trends, growth factors, and opportunities
6.5.1.1.Chemical and pharmaceutical equipment
6.5.1.2.Semiconductor manufacturing equipment
6.5.1.3.Others industrial processes
6.5.2.Market size and forecast, by region
6.5.3.Market share analysis, by country
6.5.4.Market size and forecast, by industrial equipment
6.6.Others
6.6.1.Key market trends, growth factors, and opportunities
6.6.1.1.Cookware
6.6.1.2.Textiles
6.6.1.3.Lubricants
6.6.1.4.Others
6.6.2.Market size and forecast, by region
6.6.3.Market share analysis, by country
6.6.4.Market size and forecast, by other types
CHAPTER 7:FLUOROPOLYMERS MARKET, BY REGION
7.1.Overview
7.1.1.Market size and forecast, by region
7.2.North America
7.2.1.Key market trends, growth factors, and opportunities
7.2.2.Market size and forecast, by product type
7.2.3.Market size and forecast, by others type
7.2.4.Market size and forecast, by application
7.2.5.Market size and forecast, by end-use industry
7.2.6.Market size and forecast, by Transportation Equipment
7.2.7.Market size and forecast, by electrical and electronics
7.2.8.Market size and forecast, by industrial equipment
7.2.9.Market size and forecast, by others type
7.2.10.Market size and forecast, by country
7.2.11.U.S.
7.2.11.1.Market size and forecast, by product type
7.2.11.2.Market size and forecast, by application
7.2.11.3.Market size and forecast, by end-use industry
7.2.12.Canada
7.2.12.1.Market size and forecast, by product type
7.2.12.2.Market size and forecast, by application
7.2.12.3.Market size and forecast, by end-use industry
7.2.13.Mexico
7.2.13.1.Market size and forecast, by product type
7.2.13.2.Market size and forecast, by application
7.2.13.3.Market size and forecast, by end-use industry
7.3.Europe
7.3.1.Key market trends, growth factors, and opportunities
7.3.2.Market size and forecast, by product type
7.3.3.Market size and forecast, by others type
7.3.4.Market size and forecast, by application
7.3.5.Market size and forecast, by end-use industry
7.3.6.Market size and forecast, by Transportation Equipment
7.3.7.Market size and forecast, by electrical and electronics
7.3.8.Market size and forecast, by industrial equipment
7.3.9.Market size and forecast, by others type
7.3.10.Market size and forecast, by country
7.3.11.Germany
7.3.11.1.Market size and forecast, by product type
7.3.11.2.Market size and forecast, by application
7.3.11.3.Market size and forecast, by end-use industry
7.3.12.UK
7.3.12.1.Market size and forecast, by product type
7.3.12.2.Market size and forecast, by application
7.3.12.3.Market size and forecast, by end-use industry
7.3.13.France
7.3.13.1.Market size and forecast, by product type
7.3.13.2.Market size and forecast, by application
7.3.13.3.Market size and forecast, by end-use industry
7.3.14.Italy
7.3.14.1.Market size and forecast, by product type
7.3.14.2.Market size and forecast, by application
7.3.14.3.Market size and forecast, by end-use industry
7.3.15.Spain
7.3.15.1.Market size and forecast, by product type
7.3.15.2.Market size and forecast, by application
7.3.15.3.Market size and forecast, by end-use industry
7.3.16.Rest of Europe
7.3.16.1.Market size and forecast, by product type
7.3.16.2.Market size and forecast, by application
7.3.16.3.Market size and forecast, by end-use industry
7.4.Asia-Pacific
7.4.1.Key market trends, growth factors, and opportunities
7.4.2.Market size and forecast, by product type
7.4.3.Market size and forecast, by others type
7.4.4.Market size and forecast, by application
7.4.5.Market size and forecast, by end-use industry
7.4.6.Market size and forecast, by Transportation Equipment
7.4.7.Market size and forecast, by electrical and electronics
7.4.8.Market size and forecast, by industrial equipment
7.4.9.Market size and forecast, by others type
7.4.10.Market size and forecast, by country
7.4.11.China
7.4.11.1.Market size and forecast, by product type
7.4.11.2.Market size and forecast, by application
7.4.11.3.Market size and forecast, by end-use industry
7.4.12.Japan
7.4.12.1.Market size and forecast, by product type
7.4.12.2.Market size and forecast, by application
7.4.12.3.Market size and forecast, by end-use industry
7.4.13.India
7.4.13.1.Market size and forecast, by product type
7.4.13.2.Market size and forecast, by application
7.4.13.3.Market size and forecast, by end-use industry
7.4.14.South Korea
7.4.14.1.Market size and forecast, by product type
7.4.14.2.Market size and forecast, by application
7.4.14.3.Market size and forecast, by end-use industry
7.4.15.Australia
7.4.15.1.Market size and forecast, by product type
7.4.15.2.Market size and forecast, by application
7.4.15.3.Market size and forecast, by end-use industry
7.4.16.Rest of Asia-Pacific
7.4.16.1.Market size and forecast, by product type
7.4.16.2.Market size and forecast, by application
7.4.16.3.Market size and forecast, by end-use industry
7.5.LAMEA
7.5.1.Key market trends, growth factors, and opportunities
7.5.2.Market size and forecast, by product type
7.5.3.Market size and forecast, by others type
7.5.4.Market size and forecast, by application
7.5.5.Market size and forecast, by end-use industry
7.5.6.Market size and forecast, by Transportation Equipment
7.5.7.Market size and forecast, by electrical and electronics
7.5.8.Market size and forecast, by industrial equipment
7.5.9.Market size and forecast, by others type
7.5.10.Market size and forecast, by country
7.5.11.Brazil
7.5.11.1.Market size and forecast, by product type
7.5.11.2.Market size and forecast, by application
7.5.11.3.Market size and forecast, by end-use industry
7.5.12.Saudi Arabia
7.5.12.1.Market size and forecast, by product type
7.5.12.2.Market size and forecast, by application
7.5.12.3.Market size and forecast, by end-use industry
7.5.13.South Africa
7.5.13.1.Market size and forecast, by product type
7.5.13.2.Market size and forecast, by application
7.5.13.3.Market size and forecast, by end-use industry
7.5.14.UAE
7.5.14.1.Market size and forecast, by product type
7.5.14.2.Market size and forecast, by application
7.5.14.3.Market size and forecast, by end-use industry
7.5.15.Argentina
7.5.15.1.Market size and forecast, by product type
7.5.15.2.Market size and forecast, by application
7.5.15.3.Market size and forecast, by end-use industry
7.5.16.Rest of LAMEA
7.5.16.1.Market size and forecast, by product type
7.5.16.2.Market size and forecast, by application
7.5.16.3.Market size and forecast, by end-use industry
CHAPTER 8:COMPETITIVE LANDSCAPE
8.1.Introduction
8.1.1.Market player positioning, 2019
8.2.Top winning strategies
8.2.1.Top winning strategies, by year
8.2.2.Top winning strategies, by development
8.2.3.Top winning strategies, by company
8.3.Product mapping of top 10 player
8.4.Competitive heatmap
8.5.Key developments
8.5.1.New product launches
8.5.2.Expansions
8.5.3.Agreement
CHAPTER 9:COMPANY PROFILES
9.1.ARKEMA S.A.
9.1.1.Company overview
9.1.2.Company snapshot
9.1.3.Operating business segments
9.1.4.Product portfolio
9.1.5.Business performance
9.1.6.Key strategic moves and developments
9.2.AGC INC.
9.2.1.Company overview
9.2.2.Company snapshot
9.2.3.Operating business segments
9.2.4.Product portfolio
9.2.5.Business performance
9.2.6.Key strategic moves and developments
9.3.THE CHEMOURS COMPANY
9.3.1.Company overview
9.3.2.Company snapshot
9.3.3.Operating business segments
9.3.4.Product portfolio
9.3.5.Business performance
9.4.DAIKIN INDUSTRIES, LTD.
9.4.1.Company overview
9.4.2.Company snapshot
9.4.3.Operating business segments
9.4.4.Product portfolio
9.4.5.Business performance
9.4.6.Key strategic moves and developments
9.5.DONGYUE GROUP CO., LTD.
9.5.1.Company overview
9.5.2.Company snapshot
9.5.3.Operating business segments
9.5.4.Product portfolio
9.5.5.Business performance
9.5.6.Key strategic moves and developments
9.6.DUPONT
9.6.1.Company overview
9.6.2.Company snapshot
9.6.3.Operating business segments
9.6.4.Product portfolio
9.6.5.Business performance
9.7.HONEYWELL INTERNATIONAL INC.
9.7.1.Company overview
9.7.2.Company snapshot
9.7.3.Operating business segments
9.7.4.Product portfolio
9.7.5.Business performance
9.8.MITSUBISHI CHEMICAL CORPORATION
9.8.1.Company overview
9.8.2.Company snapshot
9.8.3.Operating business segments
9.8.4.Product portfolio
9.8.5.Business performance
9.8.6.Key strategic moves and developments
9.9.SABIC
9.9.1.Company overview
9.9.2.Company snapshot
9.9.3.Operating business segments
9.9.4.Product portfolio
9.9.5.Business performance
9.10.SHIN-ETSU CHEMICAL CO., LTD.
9.10.1.Company overview
9.10.2.Company snapshot
9.10.3.Operating business segments
9.10.4.Product portfolio
9.10.5.Business performance
9.11.SAINT GOBAIN
9.11.1.Company overview
9.11.2.Company snapshot
9.11.3.Operating business segments
9.11.4.Product portfolio
9.11.5.Business performance
9.11.6.Key strategic moves and developments
9.12.SOLVAY SA
9.12.1.Company overview
9.12.2.Company snapshot
9.12.3.Operating business segments
9.12.4.Product portfolio
9.12.5.Business performance
9.12.6.Key strategic moves and developments
9.13.3M COMPANY
9.13.1.Company overview
9.13.2.Company snapshot
9.13.3.Operating business segments
9.13.4.Product portfolio
9.13.5.Business performance
LIST OF TABLES
TABLE 01.FLUOROPOLYMERS MARKET, BY PRODUCT TYPE, 2019–2027(TONS)
TABLE 02.FLUOROPOLYMERS MARKET, BY PRODUCT TYPE, 2019–2027 ($MILLION)
TABLE 03.FLUOROPOLYMERS MARKET FOR PTFE, BY REGION, 2019–2027(TONS)
TABLE 04.FLUOROPOLYMERS MARKET FOR PTFE, BY REGION, 2019–2027 ($MILLION)
TABLE 05.FLUOROPOLYMERS MARKET FOR FEP, BY REGION, 2019–2027(TONS)
TABLE 06.FLUOROPOLYMERS MARKET FOR FEP, BY REGION, 2019–2027 ($MILLION)
TABLE 07.FLUOROPOLYMERS MARKET FOR PVDF, BY REGION, 2019–2027(TONS)
TABLE 08.FLUOROPOLYMERS MARKET FOR PVDF, BY REGION, 2019–2027 ($MILLION)
TABLE 09.FLUOROPOLYMERS MARKET FOR FLUOROELASTOMER, BY REGION, 2019–2027(TONS)
TABLE 10.FLUOROPOLYMERS MARKET FOR FLUOROELASTOMER, BY REGION, 2019–2027 ($MILLION)
TABLE 11.FLUOROPOLYMERS MARKET FOR PVF, BY REGION, 2019–2027(TONS)
TABLE 12.FLUOROPOLYMERS MARKET FOR PVF, BY REGION, 2019–2027 ($MILLION)
TABLE 13.FLUOROPOLYMERS MARKET FOR PFA, BY REGION, 2019–2027(TONS)
TABLE 14.FLUOROPOLYMERS MARKET FOR PFA, BY REGION, 2019–2027 ($MILLION)
TABLE 15.FLUOROPOLYMERS MARKET FOR ETFE, BY REGION, 2019–2027(TONS)
TABLE 16.FLUOROPOLYMERS MARKET FOR ETFE, BY REGION, 2019–2027 ($MILLION)
TABLE 17.FLUOROPOLYMERS MARKET FOR OTHERS, BY REGION, 2019–2027(TONS)
TABLE 18.FLUOROPOLYMERS MARKET FOR OTHERS, BY REGION, 2019–2027 ($MILLION)
TABLE 19.FLUOROPOLYMERS MARKET FOR OTHERS BY TYPE, 2019–2027 (TONS)
TABLE 20.FLUOROPOLYMERS MARKET FOR OTHERS BY TYPE, 2019–2027 ($MILLION)
TABLE 21.FLUOROPOLYMERS MARKET, BY APPLICATION, 2019–2027(TONS)
TABLE 22.FLUOROPOLYMERS MARKET, BY APPLICATION, 2019–2027 ($MILLION)
TABLE 23.FLUOROPOLYMERS MARKET FOR FILM, BY REGION, 2019–2027(TONS)
TABLE 24.FLUOROPOLYMERS MARKET FOR FILM, BY REGION, 2019–2027 ($MILLION)
TABLE 25.FLUOROPOLYMERS MARKET FOR TUBE, BY REGION, 2019–2027(TONS)
TABLE 26.FLUOROPOLYMERS MARKET FOR EMOLLIENTS, BY REGION, 2019–2027 ($MILLION)
TABLE 27.FLUOROPOLYMERS MARKET FOR SHEET, BY REGION, 2019–2027(TONS)
TABLE 28.FLUOROPOLYMERS MARKET FOR SHEET, BY REGION, 2019–2027 ($MILLION)
TABLE 29.FLUOROPOLYMERS MARKET FOR PIPE, BY REGION, 2019–2027(TONS)
TABLE 30.FLUOROPOLYMERS MARKET FOR PIPE, BY REGION, 2019–2027 ($MILLION)
TABLE 31.FLUOROPOLYMERS MARKET FOR FLUOROPOLYMERS MARKET FOR MEMBRANE, BY REGION, 2019–2027(TONS)
TABLE 32.FLUOROPOLYMERS MARKET FOR MEMBRANE, BY REGION, 2019–2027 ($MILLION)
TABLE 33.FLUOROPOLYMERS MARKET FOR SEALANT, BY REGION, 2019–2027(TONS)
TABLE 34.FLUOROPOLYMERS MARKET FOR SEALANT, BY REGION, 2019–2027 ($MILLION)
TABLE 35.FLUOROPOLYMERS MARKET FOR ROOFING, BY REGION, 2019–2027(TONS)
TABLE 36.FLUOROPOLYMERS MARKET FOR HAIR FIXATIVE POLYMERS, BY REGION, 2019–2027 ($MILLION)
TABLE 37.FLUOROPOLYMERS MARKET FOR ADDITIVES, BY REGION, 2019–2027(TONS)
TABLE 38.FLUOROPOLYMERS MARKET FOR ADDITIVES, BY REGION, 2019–2027 ($MILLION)
TABLE 39.FLUOROPOLYMERS MARKET FOR OTHERS, BY REGION, 2019–2027(TONS)
TABLE 40.FLUOROPOLYMERS MARKET FOR OTHERS, BY REGION, 2019–2027 ($MILLION)
TABLE 41.FLUOROPOLYMERS MARKET, BY END-USE INDUSTRY, 2019–2027(TONS)
TABLE 42.FLUOROPOLYMERS MARKET, BY END-USE INDUSTRY, 2019–2027 ($MILLION)
TABLE 43.FLUOROPOLYMERS MARKET FOR TRANSPORTATION EQUIPMENT, BY REGION, 2019–2027(TONS)
TABLE 44.FLUOROPOLYMERS MARKET FOR TRANSPORTATION EQUIPMENT, BY REGION, 2019–2027 ($MILLION)
TABLE 45.FLUOROPOLYMERS MARKET FOR TRANSPORTATION EQUIPMENT BY TYPE, 2019–2027 (TONS)
TABLE 46.FLUOROPOLYMERS MARKET FOR TRANSPORTATION EQUIPMENT BY TYPE, 2019–2027 ($MILLION)
TABLE 47.FLUOROPOLYMERS MARKET FOR ELECTRICAL AND ELECTRONICS, BY REGION, 2019–2027(TONS)
TABLE 48.FLUOROPOLYMERS MARKET FOR ELECTRICAL AND ELECTRONICS, BY REGION, 2019–2027 ($MILLION)
TABLE 49.FLUOROPOLYMERS MARKET FOR ELECTRICAL AND ELECTRONICS BY TYPE, 2019–2027 (TONS)
TABLE 50.FLUOROPOLYMERS MARKET FOR ELECTRICAL AND ELECTRONICS BY TYPE, 2019–2027 ($MILLION)
TABLE 51.FLUOROPOLYMERS MARKET FOR CONSTRUCTION, BY REGION, 2019–2027(TONS)
TABLE 52.FLUOROPOLYMERS MARKET FOR CONSTRUCTION, BY REGION, 2019–2027 ($MILLION)
TABLE 53.FLUOROPOLYMERS MARKET FOR INDUSTRIAL EQUIPMENT, BY REGION, 2019–2027(TONS)
TABLE 54.FLUOROPOLYMERS MARKET FOR INDUSTRIAL EQUIPMENT, BY REGION, 2019–2027 ($MILLION)
TABLE 55.FLUOROPOLYMERS MARKET FOR INDUSTRIAL EQUIPMENT BY TYPE, 2019–2027 (TONS)
TABLE 56.FLUOROPOLYMERS MARKET FOR INDUSTRIAL EQUIPMENT BY TYPE, 2019–2027 ($MILLION)
TABLE 57.FLUOROPOLYMERS MARKET FOR OTHERS, BY REGION, 2019–2027(TONS)
TABLE 58.FLUOROPOLYMERS MARKET FOR OTHERS, BY REGION, 2019–2027 ($MILLION)
TABLE 59.FLUOROPOLYMERS MARKET FOR OTHERS BY TYPE, 2019–2027 (TONS)
TABLE 60.FLUOROPOLYMERS MARKET FOR OTHERS BY TYPE, 2019–2027 ($MILLION)
TABLE 61.FLUOROPOLYMERS MARKET, BY REGION 2019–2027(TONS)
TABLE 62.FLUOROPOLYMERS MARKET, BY REGION 2019–2027 ($MILLION)
TABLE 63.NORTH AMERICA FLUOROPOLYMERS MARKET, BY PRODUCT TYPE, 2019–2027(TONS)
TABLE 64.NORTH AMERICA FLUOROPOLYMERS MARKET, BY PRODUCT TYPE, 2019–2027 ($MILLION)
TABLE 65.NORTH AMERICA FLUOROPOLYMERS MARKET FOR OTHERS BY TYPE, 2019–2027 (TONS)
TABLE 66.NORTH AMERICA FLUOROPOLYMERS MARKET FOR OTHERS BY TYPE, 2019–2027 ($MILLION)
TABLE 67.NORTH AMERICA FLUOROPOLYMERS MARKET, BY APPLICATION, 2019–2027(TONS)
TABLE 68.NORTH AMERICA FLUOROPOLYMERS MARKET, BY APPLICATION, 2019–2027 ($MILLION)
TABLE 69.NORTH AMERICA FLUOROPOLYMERS MARKET, BY END-USE INDUSTRY, 2019–2027(TONS)
TABLE 70.NORTH AMERICA FLUOROPOLYMERS MARKET, BY END-USE INDUSTRY, 2019–2027 ($MILLION)
TABLE 71.NORTH AMERICA FLUOROPOLYMERS MARKET FOR TRANSPORTATION EQUIPMENT BY TYPE, 2019–2027 (TONS)
TABLE 72.NORTH AMERICA FLUOROPOLYMERS MARKET FOR TRANSPORTATION EQUIPMENT BY TYPE, 2019–2027 ($MILLION)
TABLE 73.NORTH AMERICA FLUOROPOLYMERS MARKET FOR ELECTRICAL AND ELECTRONICS BY TYPE, 2019–2027 (TONS)
TABLE 74.NORTH AMERICA FLUOROPOLYMERS MARKET FOR ELECTRICAL AND ELECTRONICS BY TYPE, 2019–2027 ($MILLION)
TABLE 75.NORTH AMERICA FLUOROPOLYMERS MARKET FOR INDUSTRIAL EQUIPMENT BY TYPE, 2019–2027 (TONS)
TABLE 76.NORTH AMERICA FLUOROPOLYMERS MARKET FOR INDUSTRIAL EQUIPMENT BY TYPE, 2019–2027 ($MILLION)
TABLE 77.NORTH AMERICA FLUOROPOLYMERS MARKET FOR OTHERS BY TYPE, 2019–2027 (TONS)
TABLE 78.NORTH AMERICA FLUOROPOLYMERS MARKET FOR OTHERS BY TYPE, 2019–2027 ($MILLION)
TABLE 79.NORTH AMERICA FLUOROPOLYMERS MARKET, BY COUNTRY 2019–2027(TONS)
TABLE 80.NORTH AMERICA FLUOROPOLYMERS MARKET, BY COUNTRY 2019–2027 ($MILLION)
TABLE 81.U.S. FLUOROPOLYMERS MARKET, BY PRODUCT TYPE, 2019–2027(TONS)
TABLE 82.U.S. FLUOROPOLYMERS MARKET, BY PRODUCT TYPE, 2019–2027 ($MILLION)
TABLE 83.U.S. FLUOROPOLYMERS MARKET, BY APPLICATION, 2019–2027(TONS)
TABLE 84.U.S. FLUOROPOLYMERS MARKET, BY APPLICATION, 2019–2027 ($MILLION)
TABLE 85.U.S. FLUOROPOLYMERS MARKET, BY END-USE INDUSTRY, 2019–2027(TONS)
TABLE 86.U.S. FLUOROPOLYMERS MARKET, BY END-USE INDUSTRY, 2019–2027 ($MILLION)
TABLE 87.CANADA FLUOROPOLYMERS MARKET, BY PRODUCT TYPE, 2019–2027(TONS)
TABLE 88.CANADA FLUOROPOLYMERS MARKET, BY PRODUCT TYPE, 2019–2027 ($MILLION)
TABLE 89.CANADA FLUOROPOLYMERS MARKET, BY APPLICATION, 2019–2027(TONS)
TABLE 90.CANADA FLUOROPOLYMERS MARKET, BY APPLICATION, 2019–2027 ($MILLION)
TABLE 91.CANADA FLUOROPOLYMERS MARKET, BY END-USE INDUSTRY, 2019–2027(TONS)
TABLE 92.CANADA FLUOROPOLYMERS MARKET, BY END-USE INDUSTRY, 2019–2027 ($MILLION)
TABLE 93.MEXICO FLUOROPOLYMERS MARKET, BY PRODUCT TYPE, 2019–2027(TONS)
TABLE 94.MEXICO FLUOROPOLYMERS MARKET, BY PRODUCT TYPE, 2019–2027 ($MILLION)
TABLE 95.MEXICO FLUOROPOLYMERS MARKET, BY APPLICATION, 2019–2027(TONS)
TABLE 96.MEXICO FLUOROPOLYMERS MARKET, BY APPLICATION, 2019–2027 ($MILLION)
TABLE 97.MEXICO FLUOROPOLYMERS MARKET, BY END-USE INDUSTRY, 2019–2027(TONS)
TABLE 98.MEXICO FLUOROPOLYMERS MARKET, BY END-USE INDUSTRY, 2019–2027 ($MILLION)
TABLE 99.EUROPE FLUOROPOLYMERS MARKET, BY PRODUCT TYPE, 2019–2027(TONS)
TABLE 100.EUROPE FLUOROPOLYMERS MARKET, BY PRODUCT TYPE, 2019–2027 ($MILLION)
TABLE 101.EUROPE FLUOROPOLYMERS MARKET FOR OTHERS BY TYPE, 2019–2027 (TONS)
TABLE 102.EUROPE FLUOROPOLYMERS MARKET FOR OTHERS BY TYPE, 2019–2027 ($MILLION)
TABLE 103.EUROPE FLUOROPOLYMERS MARKET, BY APPLICATION, 2019–2027(TONS)
TABLE 104.EUROPE FLUOROPOLYMERS MARKET, BY APPLICATION, 2019–2027 ($MILLION)
TABLE 105.EUROPE FLUOROPOLYMERS MARKET, BY END-USE INDUSTRY, 2019–2027(TONS)
TABLE 106.EUROPE FLUOROPOLYMERS MARKET, BY END-USE INDUSTRY, 2019–2027 ($MILLION)
TABLE 107.EUROPE FLUOROPOLYMERS MARKET FOR TRANSPORTATION EQUIPMENT BY TYPE, 2019–2027 (TONS)
TABLE 108.EUROPE FLUOROPOLYMERS MARKET FOR TRANSPORTATION EQUIPMENT BY TYPE, 2019–2027 ($MILLION)
TABLE 109.EUROPE FLUOROPOLYMERS MARKET FOR ELECTRICAL AND ELECTRONICS BY TYPE, 2019–2027 (TONS)
TABLE 110.EUROPE FLUOROPOLYMERS MARKET FOR ELECTRICAL AND ELECTRONICS BY TYPE, 2019–2027 ($MILLION)
TABLE 111.EUROPE FLUOROPOLYMERS MARKET FOR INDUSTRIAL EQUIPMENT BY TYPE, 2019–2027 (TONS)
TABLE 112.EUROPE FLUOROPOLYMERS MARKET FOR INDUSTRIAL EQUIPMENT BY TYPE, 2019–2027 ($MILLION)
TABLE 113.EUROPE FLUOROPOLYMERS MARKET FOR OTHERS BY TYPE, 2019–2027 (TONS)
TABLE 114.EUROPE FLUOROPOLYMERS MARKET FOR OTHERS BY TYPE, 2019–2027 ($MILLION)
TABLE 115.EUROPE FLUOROPOLYMERS MARKET, BY COUNTRY 2019–2027(TONS)
TABLE 116.EUROPE FLUOROPOLYMERS MARKET, BY COUNTRY 2019–2027 ($MILLION)
TABLE 117.GERMANY FLUOROPOLYMERS MARKET, BY PRODUCT TYPE, 2019–2027(TONS)
TABLE 118.GERMANY FLUOROPOLYMERS MARKET, BY PRODUCT TYPE, 2019–2027 ($MILLION)
TABLE 119.GERMANY FLUOROPOLYMERS MARKET, BY APPLICATION, 2019–2027(TONS)
TABLE 120.GERMANY FLUOROPOLYMERS MARKET, BY APPLICATION, 2019–2027 ($MILLION)
TABLE 121.GERMANY FLUOROPOLYMERS MARKET, BY END-USE INDUSTRY, 2019–2027(TONS)
TABLE 122.GERMANY FLUOROPOLYMERS MARKET, BY END-USE INDUSTRY, 2019–2027 ($MILLION)
TABLE 123.UK FLUOROPOLYMERS MARKET, BY PRODUCT TYPE, 2019–2027(TONS)
TABLE 124.UK FLUOROPOLYMERS MARKET, BY PRODUCT TYPE, 2019–2027 ($MILLION)
TABLE 125.UK FLUOROPOLYMERS MARKET, BY APPLICATION, 2019–2027(TONS)
TABLE 126.UK FLUOROPOLYMERS MARKET, BY APPLICATION, 2019–2027 ($MILLION)
TABLE 127.UK FLUOROPOLYMERS MARKET, BY END-USE INDUSTRY, 2019–2027(TONS)
TABLE 128.UK FLUOROPOLYMERS MARKET, BY END-USE INDUSTRY, 2019–2027 ($MILLION)
TABLE 129.FRANCE FLUOROPOLYMERS MARKET, BY PRODUCT TYPE, 2019–2027(TONS)
TABLE 130.FRANCE FLUOROPOLYMERS MARKET, BY PRODUCT TYPE, 2019–2027 ($MILLION)
TABLE 131.FRANCE FLUOROPOLYMERS MARKET, BY APPLICATION, 2019–2027(TONS)
TABLE 132.FRANCE FLUOROPOLYMERS MARKET, BY APPLICATION, 2019–2027 ($MILLION)
TABLE 133.FRANCE FLUOROPOLYMERS MARKET, BY END-USE INDUSTRY, 2019–2027(TONS)
TABLE 134.FRANCE FLUOROPOLYMERS MARKET, BY END-USE INDUSTRY, 2019–2027 ($MILLION)
TABLE 135.ITALY FLUOROPOLYMERS MARKET, BY PRODUCT TYPE, 2019–2027(TONS)
TABLE 136.ITALY FLUOROPOLYMERS MARKET, BY PRODUCT TYPE, 2019–2027 ($MILLION)
TABLE 137.ITALY FLUOROPOLYMERS MARKET, BY APPLICATION, 2019–2027(TONS)
TABLE 138.ITALY FLUOROPOLYMERS MARKET, BY APPLICATION, 2019–2027 ($MILLION)
TABLE 139.ITALYFLUOROPOLYMERS MARKET, BY END-USE INDUSTRY, 2019–2027(TONS)
TABLE 140.ITALYFLUOROPOLYMERS MARKET, BY END-USE INDUSTRY, 2019–2027 ($MILLION)
TABLE 141.SPAIN FLUOROPOLYMERS MARKET, BY PRODUCT TYPE, 2019–2027(TONS )
TABLE 142.SPAIN FLUOROPOLYMERS MARKET, BY PRODUCT TYPE, 2019–2027 ($MILLION)
TABLE 143.SPAIN FLUOROPOLYMERS MARKET, BY APPLICATION, 2019–2027(TONS )
TABLE 144.SPAIN FLUOROPOLYMERS MARKET, BY APPLICATION, 2019–2027 ($MILLION)
TABLE 145.SPAIN FLUOROPOLYMERS MARKET, BY END-USE INDUSTRY, 2019–2027(TONS )
TABLE 146.SPAIN FLUOROPOLYMERS MARKET, BY END-USE INDUSTRY, 2019–2027 ($MILLION)
TABLE 147.REST OF EUROPE FLUOROPOLYMERS MARKET, BY PRODUCT TYPE, 2019–2027(TONS )
TABLE 148.REST OF EUROPE FLUOROPOLYMERS MARKET, BY PRODUCT TYPE, 2019–2027 ($MILLION)
TABLE 149.REST OF EUROPE FLUOROPOLYMERS MARKET, BY APPLICATION, 2019–2027(TONS )
TABLE 150.REST OF EUROPE FLUOROPOLYMERS MARKET, BY APPLICATION, 2019–2027 ($MILLION)
TABLE 151.REST OF EUROPE FLUOROPOLYMERS MARKET, BY END-USE INDUSTRY, 2019–2027(TONS )
TABLE 152.REST OF EUROPE FLUOROPOLYMERS MARKET, BY END-USE INDUSTRY, 2019–2027 ($MILLION)
TABLE 153.ASIA-PACIFIC FLUOROPOLYMERS MARKET, BY PRODUCT TYPE, 2019–2027(TONS)
TABLE 154.ASIA-PACIFIC FLUOROPOLYMERS MARKET, BY PRODUCT TYPE, 2019–2027 ($MILLION)
TABLE 155.ASIA-PACIFIC FLUOROPOLYMERS MARKET FOR OTHERS BY TYPE, 2019–2027 (TONS)
TABLE 156.ASIA-PACIFIC FLUOROPOLYMERS MARKET FOR OTHERS BY TYPE, 2019–2027 ($MILLION)
TABLE 157.ASIA-PACIFIC FLUOROPOLYMERS MARKET, BY APPLICATION, 2019–2027(TONS)
TABLE 158.ASIA-PACIFIC FLUOROPOLYMERS MARKET, BY APPLICATION, 2019–2027 ($MILLION)
TABLE 159.ASIA-PACIFIC FLUOROPOLYMERS MARKET, BY END-USE INDUSTRY, 2019–2027(TONS)
TABLE 160.ASIA-PACIFIC FLUOROPOLYMERS MARKET, BY END-USE INDUSTRY, 2019–2027 ($MILLION)
TABLE 161.ASIA-PACIFIC FLUOROPOLYMERS MARKET FOR TRANSPORTATION EQUIPMENT BY TYPE, 2019–2027 (TONS)
TABLE 162.ASIA-PACIFIC FLUOROPOLYMERS MARKET FOR TRANSPORTATION EQUIPMENT BY TYPE, 2019–2027 ($MILLION)
TABLE 163.ASIA-PACIFIC FLUOROPOLYMERS MARKET FOR ELECTRICAL AND ELECTRONICS BY TYPE, 2019–2027 (TONS)
TABLE 164.ASIA-PACIFIC FLUOROPOLYMERS MARKET FOR ELECTRICAL AND ELECTRONICS BY TYPE, 2019–2027 ($MILLION)
TABLE 165.ASIA-PACIFIC FLUOROPOLYMERS MARKET FOR INDUSTRIAL EQUIPMENT BY TYPE, 2019–2027 (TONS)
TABLE 166.ASIA-PACIFIC FLUOROPOLYMERS MARKET FOR INDUSTRIAL EQUIPMENT BY TYPE, 2019–2027 ($MILLION)
TABLE 167.ASIA-PACIFIC FLUOROPOLYMERS MARKET FOR OTHERS BY TYPE, 2019–2027 (TONS)
TABLE 168.ASIA-PACIFIC FLUOROPOLYMERS MARKET FOR OTHERS BY TYPE, 2019–2027 ($MILLION)
TABLE 169.ASIA-PACIFIC FLUOROPOLYMERS MARKET, BY COUNTRY 2019–2027(TONS)
TABLE 170.ASIA-PACIFIC FLUOROPOLYMERS MARKET, BY COUNTRY 2019–2027 ($MILLION)
TABLE 171.CHINA FLUOROPOLYMERS MARKET, BY PRODUCT TYPE, 2019–2027(TONS)
TABLE 172.CHINA FLUOROPOLYMERS MARKET, BY PRODUCT TYPE, 2019–2027 ($MILLION)
TABLE 173.CHINA FLUOROPOLYMERS MARKET, BY APPLICATION, 2019–2027(TONS)
TABLE 174.CHINA FLUOROPOLYMERS MARKET, BY APPLICATION, 2019–2027 ($MILLION)
TABLE 175.CHINA FLUOROPOLYMERS MARKET, BY END-USE INDUSTRY, 2019–2027(TONS)
TABLE 176.CHINA FLUOROPOLYMERS MARKET, BY END-USE INDUSTRY, 2019–2027 ($MILLION)
TABLE 177.JAPAN FLUOROPOLYMERS MARKET, BY PRODUCT TYPE, 2019–2027(TONS)
TABLE 178.JAPAN FLUOROPOLYMERS MARKET, BY PRODUCT TYPE, 2019–2027 ($MILLION)
TABLE 179.JAPAN FLUOROPOLYMERS MARKET, BY APPLICATION, 2019–2027(TONS)
TABLE 180.JAPAN FLUOROPOLYMERS MARKET, BY APPLICATION, 2019–2027 ($MILLION)
TABLE 181.JAPAN FLUOROPOLYMERS MARKET, BY END-USE INDUSTRY, 2019–2027(TONS)
TABLE 182.JAPAN FLUOROPOLYMERS MARKET, BY END-USE INDUSTRY, 2019–2027 ($MILLION)
TABLE 183.INDIA FLUOROPOLYMERS MARKET, BY PRODUCT TYPE, 2019–2027(TONS)
TABLE 184.INDIA FLUOROPOLYMERS MARKET, BY PRODUCT TYPE, 2019–2027 ($MILLION)
TABLE 185.INDIA FLUOROPOLYMERS MARKET, BY APPLICATION, 2019–2027(TONS)
TABLE 186.INDIA FLUOROPOLYMERS MARKET, BY APPLICATION, 2019–2027 ($MILLION)
TABLE 187.INDIA FLUOROPOLYMERS MARKET, BY END-USE INDUSTRY, 2019–2027(TONS)
TABLE 188.INDIA FLUOROPOLYMERS MARKET, BY END-USE INDUSTRY, 2019–2027 ($MILLION)
TABLE 189.SOUTH KOREA FLUOROPOLYMERS MARKET, BY PRODUCT TYPE, 2019–2027(TONS)
TABLE 190.SOUTH KOREA FLUOROPOLYMERS MARKET, BY PRODUCT TYPE, 2019–2027 ($MILLION)
TABLE 191.SOUTH KOREA FLUOROPOLYMERS MARKET, BY APPLICATION, 2019–2027(TONS)
TABLE 192.SOUTH KOREA FLUOROPOLYMERS MARKET, BY APPLICATION, 2019–2027 ($MILLION)
TABLE 193.SOUTH KOREA FLUOROPOLYMERS MARKET, BY END-USE INDUSTRY, 2019–2027(TONS)
TABLE 194.SOUTH KOREA FLUOROPOLYMERS MARKET, BY END-USE INDUSTRY, 2019–2027 ($MILLION)
TABLE 195.AUSTRALIA FLUOROPOLYMERS MARKET, BY PRODUCT TYPE, 2019–2027(TONS)
TABLE 196.AUSTRALIA FLUOROPOLYMERS MARKET, BY PRODUCT TYPE, 2019–2027 ($MILLION)
TABLE 197.AUSTRALIA FLUOROPOLYMERS MARKET, BY APPLICATION, 2019–2027(TONS)
TABLE 198.AUSTRALIA FLUOROPOLYMERS MARKET, BY APPLICATION, 2019–2027 ($MILLION)
TABLE 199.AUSTRALIA FLUOROPOLYMERS MARKET, BY END-USE INDUSTRY, 2019–2027(TONS)
TABLE 200.AUSTRALIA FLUOROPOLYMERS MARKET, BY END-USE INDUSTRY, 2019–2027 ($MILLION)
TABLE 201.REST OF ASIA-PACIFIC FLUOROPOLYMERS MARKET, BY PRODUCT TYPE, 2019–2027(TONS)
TABLE 202.REST OF ASIA-PACIFIC FLUOROPOLYMERS MARKET, BY PRODUCT TYPE, 2019–2027 ($MILLION)
TABLE 203.REST OF ASIA-PACIFIC FLUOROPOLYMERS MARKET, BY APPLICATION, 2019–2027(TONS)
TABLE 204.REST OF ASIA-PACIFIC FLUOROPOLYMERS MARKET, BY APPLICATION, 2019–2027 ($MILLION)
TABLE 205.REST OF ASIA-PACIFIC FLUOROPOLYMERS MARKET, BY END-USE INDUSTRY, 2019–2027(TONS)
TABLE 206.REST OF ASIA-PACIFIC FLUOROPOLYMERS MARKET, BY END-USE INDUSTRY, 2019–2027 ($MILLION)
TABLE 207.LAMEA FLUOROPOLYMERS MARKET, BY PRODUCT TYPE, 2019–2027(TONS)
TABLE 208.LAMEA FLUOROPOLYMERS MARKET, BY PRODUCT TYPE, 2019–2027 ($MILLION)
TABLE 209.LAMEA FLUOROPOLYMERS MARKET FOR OTHERS BY TYPE, 2019–2027 (TONS)
TABLE 210.LAMEA FLUOROPOLYMERS MARKET FOR OTHERS BY TYPE, 2019–2027 ($MILLION)
TABLE 211.LAMEA FLUOROPOLYMERS MARKET, BY APPLICATION, 2019–2027(TONS)
TABLE 212.LAMEA FLUOROPOLYMERS MARKET, BY APPLICATION, 2019–2027 ($MILLION)
TABLE 213.LAMEA FLUOROPOLYMERS MARKET, BY END-USE INDUSTRY, 2019–2027(TONS)
TABLE 214.LAMEA FLUOROPOLYMERS MARKET, BY END-USE INDUSTRY, 2019–2027 ($MILLION)
TABLE 215.LAMEA FLUOROPOLYMERS MARKET FOR TRANSPORTATION EQUIPMENT BY TYPE, 2019–2027 (TONS)
TABLE 216.LAMEA FLUOROPOLYMERS MARKET FOR TRANSPORTATION EQUIPMENT BY TYPE, 2019–2027 ($MILLION)
TABLE 217.LAMEA FLUOROPOLYMERS MARKET FOR ELECTRICAL AND ELECTRONICS BY TYPE, 2019–2027 (TONS)
TABLE 218.LAMEA FLUOROPOLYMERS MARKET FOR ELECTRICAL AND ELECTRONICS BY TYPE, 2019–2027 ($MILLION)
TABLE 219.LAMEA FLUOROPOLYMERS MARKET FOR INDUSTRIAL EQUIPMENT BY TYPE, 2019–2027 (TONS)
TABLE 220.LAMEA FLUOROPOLYMERS MARKET FOR INDUSTRIAL EQUIPMENT BY TYPE, 2019–2027 ($MILLION)
TABLE 221.LAMEA FLUOROPOLYMERS MARKET FOR OTHERS BY TYPE, 2019–2027 (TONS)
TABLE 222.LAMEA FLUOROPOLYMERS MARKET FOR OTHERS BY TYPE, 2019–2027 ($MILLION)
TABLE 223.LAMEA FLUOROPOLYMERS MARKET, BY COUNTRY 2019–2027(TONS)
TABLE 224.LAMEA FLUOROPOLYMERS MARKET, BY COUNTRY 2019–2027 ($MILLION)
TABLE 225.BRAZIL FLUOROPOLYMERS MARKET, BY PRODUCT TYPE, 2019–2027(TONS)
TABLE 226.BRAZIL FLUOROPOLYMERS MARKET, BY PRODUCT TYPE, 2019–2027 ($MILLION)
TABLE 227.BRAZIL FLUOROPOLYMERS MARKET, BY APPLICATION, 2019–2027(TONS)
TABLE 228.BRAZIL FLUOROPOLYMERS MARKET, BY APPLICATION, 2019–2027 ($MILLION)
TABLE 229.BRAZIL FLUOROPOLYMERS MARKET, BY END-USE INDUSTRY, 2019–2027(TONS)
TABLE 230.BRAZIL FLUOROPOLYMERS MARKET, BY END-USE INDUSTRY, 2019–2027 ($MILLION)
TABLE 231.SAUDI ARABIA FLUOROPOLYMERS MARKET, BY PRODUCT TYPE, 2019–2027(TONS)
TABLE 232.SAUDI ARABIA FLUOROPOLYMERS MARKET, BY PRODUCT TYPE, 2019–2027 ($MILLION)
TABLE 233.SAUDI ARABIA FLUOROPOLYMERS MARKET, BY APPLICATION, 2019–2027(TONS)
TABLE 234.SAUDI ARABIA FLUOROPOLYMERS MARKET, BY APPLICATION, 2019–2027 ($MILLION)
TABLE 235.SAUDI ARABIA FLUOROPOLYMERS MARKET, BY END-USE INDUSTRY, 2019–2027(TONS)
TABLE 236.SAUDI ARABIA FLUOROPOLYMERS MARKET, BY END-USE INDUSTRY, 2019–2027 ($MILLION)
TABLE 237.SOUTH AFRICA FLUOROPOLYMERS MARKET, BY PRODUCT TYPE, 2019–2027(TONS)
TABLE 238.SOUTH AFRICA FLUOROPOLYMERS MARKET, BY PRODUCT TYPE, 2019–2027 ($MILLION)
TABLE 239.SOUTH AFRICA FLUOROPOLYMERS MARKET, BY APPLICATION, 2019–2027(TONS)
TABLE 240.SOUTH AFRICA FLUOROPOLYMERS MARKET, BY APPLICATION, 2019–2027 ($MILLION)
TABLE 241.SOUTH AFRICA FLUOROPOLYMERS MARKET, BY END-USE INDUSTRY, 2019–2027(TONS)
TABLE 242.SOUTH AFRICA FLUOROPOLYMERS MARKET, BY END-USE INDUSTRY, 2019–2027 ($MILLION)
TABLE 243.UAE FLUOROPOLYMERS MARKET, BY PRODUCT TYPE, 2019–2027(TONS)
TABLE 244.UAE FLUOROPOLYMERS MARKET, BY PRODUCT TYPE, 2019–2027 ($MILLION)
TABLE 245.UAE FLUOROPOLYMERS MARKET, BY APPLICATION, 2019–2027(TONS)
TABLE 246.UAE FLUOROPOLYMERS MARKET, BY APPLICATION, 2019–2027 ($MILLION)
TABLE 247.UAE FLUOROPOLYMERS MARKET, BY END-USE INDUSTRY, 2019–2027(TONS)
TABLE 248.UAE FLUOROPOLYMERS MARKET, BY END-USE INDUSTRY, 2019–2027 ($MILLION)
TABLE 249.ARGENTINA FLUOROPOLYMERS MARKET, BY PRODUCT TYPE, 2019–2027(TONS)
TABLE 250.ARGENTINA FLUOROPOLYMERS MARKET, BY PRODUCT TYPE, 2019–2027 ($MILLION)
TABLE 251.ARGENTINA FLUOROPOLYMERS MARKET, BY APPLICATION, 2019–2027(TONS)
TABLE 252.ARGENTINA FLUOROPOLYMERS MARKET, BY APPLICATION, 2019–2027 ($MILLION)
TABLE 253.ARGENTINA FLUOROPOLYMERS MARKET, BY END-USE INDUSTRY, 2019–2027(TONS)
TABLE 254.ARGENTINA FLUOROPOLYMERS MARKET, BY END-USE INDUSTRY, 2019–2027 ($MILLION)
TABLE 255.REST OF LAMEA FLUOROPOLYMERS MARKET, BY PRODUCT TYPE, 2019–2027(TONS)
TABLE 256.REST OF LAMEA FLUOROPOLYMERS MARKET, BY PRODUCT TYPE, 2019–2027 ($MILLION)
TABLE 257.REST OF LAMEA FLUOROPOLYMERS MARKET, BY APPLICATION, 2019–2027(TONS)
TABLE 258.REST OF LAMEA FLUOROPOLYMERS MARKET, BY APPLICATION, 2019–2027 ($MILLION)
TABLE 259.REST OF LAMEA FLUOROPOLYMERS MARKET, BY END-USE INDUSTRY, 2019–2027(TONS)
TABLE 260.REST OF LAMEA FLUOROPOLYMERS MARKET, BY END-USE INDUSTRY, 2019–2027 ($MILLION)
TABLE 261.KEY NEW PRODUCT LAUNCHES (2016-2020)
TABLE 262.KEY EXPANSIONS (2016-2020)
TABLE 263.KEY AGREEMENT (2016-2020)
TABLE 264.ARKEMA S.A.: COMPANY SNAPSHOT
TABLE 265.ARKEMA S.A.: OPERATING SEGMENTS
TABLE 266.ARKEMA S.A: PRODUCT PORTFOLIO
TABLE 267.OVERALL FINANCIAL STATUS ($MILLION)
TABLE 268.ARKEMA S.A.: KEY STRATEGIC MOVES AND DEVELOPMENTS
TABLE 269.AGC INC.: COMPANY SNAPSHOT
TABLE 270.AGC INC.: OPERATING SEGMENTS
TABLE 271.AGC INC.: PRODUCT PORTFOLIO
TABLE 272.OVERALL FINANCIAL STATUS ($MILLION)
TABLE 273.AGC INC.: KEY STRATEGIC MOVES AND DEVELOPMENTS
TABLE 274.THE CHEMOURS COMPANY: COMPANY SNAPSHOT
TABLE 275.THE CHEMOURS COMPANY: OPERATING SEGMENTS
TABLE 276.THE CHEMOURS COMPANY: PRODUCT PORTFOLIO
TABLE 277.OVERALL FINANCIAL STATUS ($MILLION)
TABLE 278.DAIKIN: COMPANY SNAPSHOT
TABLE 279.DAIKIN: OPERATING SEGMENTS
TABLE 280.DAIKIN: PRODUCT PORTFOLIO
TABLE 281.OVERALL FINANCIAL STATUS ($MILLION)
TABLE 282.DAIKIN: KEY STRATEGIC MOVES AND DEVELOPMENTS
TABLE 283.DONGYUE GROUP: COMPANY SNAPSHOT
TABLE 284.DONGYUE GROUP: OPERATING SEGMENTS
TABLE 285.DONGYUE GROUP: PRODUCT PORTFOLIO
TABLE 286.OVERALL FINANCIAL STATUS ($MILLION)
TABLE 287.DONGYUE GROUP: KEY STRATEGIC MOVES AND DEVELOPMENTS
TABLE 288.DUPONT: COMPANY SNAPSHOT
TABLE 289.DUPONT: OPERATING SEGMENTS
TABLE 290.DUPONT: PRODUCT PORTFOLIO
TABLE 291.OVERALL FINANCIAL STATUS ($MILLION)
TABLE 292.HONEYWELL: COMPANY SNAPSHOT
TABLE 293.HONEYWELL: OPERATING SEGMENTS
TABLE 294.HONEYWELL: PRODUCT PORTFOLIO
TABLE 295.OVERALL FINANCIAL STATUS ($MILLION)
TABLE 296.MITSUBISHI CHEMICAL: COMPANY SNAPSHOT
TABLE 297.MITSUBISHI CHEMICAL: OPERATING SEGMENTS
TABLE 298.MITSUBISHI CHEMICAL: PRODUCT PORTFOLIO
TABLE 299.OVERALL FINANCIAL STATUS ($MILLION)
TABLE 300.SABIC: COMPANY SNAPSHOT
TABLE 301.SABIC: OPERATING SEGMENTS
TABLE 302.SABIC: PRODUCT PORTFOLIO
TABLE 303.OVERALL FINANCIAL STATUS ($MILLION)
TABLE 304.SHIN-ETSU: COMPANY SNAPSHOT
TABLE 305.SHIN-ETSU: OPERATING SEGMENTS
TABLE 306.SHIN-ETSU: PRODUCT PORTFOLIO
TABLE 307.OVERALL FINANCIAL STATUS ($MILLION)
TABLE 308.SAINT GOBAIN: COMPANY SNAPSHOT
TABLE 309.SAINT GOBAIN: OPERATING SEGMENTS
TABLE 310.SAINT GOBAIN: PRODUCT PORTFOLIO
TABLE 311.OVERALL FINANCIAL STATUS ($MILLION)
TABLE 312.SAINT GOBAIN: KEY STRATEGIC MOVES AND DEVELOPMENTS
TABLE 313.SOLVAY: COMPANY SNAPSHOT
TABLE 314.SOLVAY: OPERATING SEGMENTS
TABLE 315.SOLVAY: PRODUCT PORTFOLIO
TABLE 316.OVERALL FINANCIAL STATUS ($MILLION)
TABLE 317.SOLVAY: KEY STRATEGIC MOVES AND DEVELOPMENTS
TABLE 318.3M: COMPANY SNAPSHOT
TABLE 319.3M: OPERATING SEGMENTS
TABLE 320.3M: PRODUCT PORTFOLIO
TABLE 321.OVERALL FINANCIAL STATUS ($MILLION)
LIST OF FIGURES
FIGURE 01.KEY MARKET SEGMENTS
FIGURE 02.TOP INVESTMENT POCKETS
FIGURE 03.FLUOROPOLYMER TYPES
FIGURE 04.TYPICAL PROPERTIES OF FLUROPOLYMERS
FIGURE 05.MODERATE BARGAINING POWER OF SUPPLIERS
FIGURE 06.MODERATE THREAT OF NEW ENTRANTS
FIGURE 07.MODERATE THREAT OF SUBSTITUTES
FIGURE 08.HIGH INTENSITY OF COMPETITIVE RIVALRY
FIGURE 09.MODERATE BARGAINING POWER OF BUYERS
FIGURE 10.VALUE CHAIN ANALYSIS
FIGURE 11.MARKET SHARE ANALYSIS
FIGURE 12.PATENT ANALYSIS, BY COMPANY
FIGURE 13.FLUOROPOLYMERS MARKET DYNAMICS
FIGURE 14.FLUOROPOLYMERS MARKET REVENUE, BY PRODUCT TYPE, 2019–2027($MILLION)
FIGURE 15.COMPARATIVE ANALYSIS OF FLUOROPOLYMERS MARKET FOR PTFE, BY COUNTRY, 2019 &
As per the CXO of the leading companies, the global fluoropolymers market is moving toward growth stabilization phase in its industry life cycle. Growth in demand from transportation equipment, electrical & electronics, construction, industrial equipment, and other sectors drives the global fluoropolymers market. PTFE has outstanding chemical & thermal resistance, exceptionally low friction coefficient and good electrical insulation. This is used in a wide range of applications including semiconductors, automotive parts, electronic devices, and non-stick frying pans. In addition, PTFE is also less costly than other forms of HPF which has powered its production. Industrial equipment is also the largest revenue-generating segment for fluoropolymers and is expected to remain dominant during the forecast period. Furthermore, the presence of major manufacturing hubs in China and India has driven the Asia-Pacific high-performance fluoropolymers industry due to the growing demand for high quality automotive, medical, consumer, and electronic goods. China, India, Japan, and South Korea are few of the world's leading & largest automobile manufacturers, which regularly generates demand for fluoropolymer products in the transport industry. Furthermore, these countries are the world's leading producers and exporters of various medical & pharmaceutical, telecommunications, automotive, and chemical industries.
Q1. Which are the factors that drives fluoropolymers market growth?
A. Factors that drive the growth of the fluoropolymers market include increasing demand for the fluropolymer from various end user applications
Q2. What is the market CAGR of fluoropolymers market?
A. The global fluoropolymers market anticipated to grow at CAGR of 6.5% during the forecast period.
Q3. What are the key trends in the fluoropolymers market?
A. The key trend observed in the global fluoropolymers market are involvement of players towards research and development of new fluoropolymers products.
Q4. Which region is expected to hold the highest market share in fluoropolymers market?
A. Asia-Pacific region is expected to provide lucrative growth opportunities to the global fluoropolymers market.
Q5. What are the key growth strategies of fluoropolymers market players?
A. New product launches, business expansions, and acquisition are the major growth strategies adopted by the players in this market.
Q6. What are the key strategies adopted by the market players
A. The market players are adopting various growth strategies and also investing in R&D extensively to develop technically advanced unique products which are expected to drive the market size.
Q7. Which is the leading segment in the fluoropolymers market?
A. PTFE is the largest segment in the global fluoropolymers market.
Q8. Who are the potential customers of fluoropolymers industry?
A. Major customer of the fluoropolymers are from transportation equipment, electrical and electronics, construction, and industrial equipment are the key potential consumers in the fluoropolymers market.
Download Sample
Purchase Full Report of
Fluoropolymers Market
- Online Only
- $3,456
- Online cloud access only
- Restricted print, copy, paste & download
- Read only
- Free quarterly industry update
- Free report update (Within 180 days)
- Subscription model sign in
- Data Pack
- $3,840
- Restricted to one authorized user
- One print only
- Available in
Excel - Free quarterly industry update
- Free report update (Within 180 days)
- Subscription model sign in
- Single User
- $5,769
- Restricted to one authorized user
- One print only
- Available in Excel & PDF
- Free quarterly industry update
- Free report update (Within 180 days)
- Subscription model sign in
- Five Users
- $6,450
- Limited to five authorized users
- Print upto five copies
- Available in Excel & PDF
- Free quarterly industry update
- Free report update (Within 180 days)
- Subscription model sign in
-
Enterprise
License/PDF - $8,995
- Unlimited
within
company/enterprise - Available in Excel & PDF
- Free quarterly industry update
- Free report update (Within 180 days)
- Subscription model sign in
- Library Membership
- $ 699/mo
- Published Content
E-access - Company Profiles
E-access - Newly Added Content Access
- 10 PDF
Downloads - 5 Excel Data
Pack Downloads - 250 Company Profiles PDF Downloads
-
Start reading instantly.
Buy Now
This title and over 12,000+ are available on the Avenue Library. T&C*.
*Taxes/Fees, if applicable will be added during checkout. All prices in USD
Why Allied Market Research?
Infallible Methodology
To ensure high-level data integrity, accurate analysis, and impeccable forecasts
Analyst Support
For complete satisfaction
Customization
On-demand customization of scope of the report to exactly meet your needs
TARGETED MARKET VIEW
Targeted market view to provide pertinent information and save time of readers
Featured Reports
Get fresh content delivered
Get insights on topics that are crucial for your business. Stay abreast of your interest areas.
Why Allied Market Research?
Infallible Methodology
To ensure high-level data integrity, accurate analysis, and impeccable forecasts
Analyst Support
For complete satisfaction
Customization
On-demand customization of scope of the report to exactly meet your needs
TARGETED MARKET VIEW
Targeted market view to provide pertinent information and save time of readers