Report Code: A11202 | May 2021 | Pages: 193 | ||
Tables: 126 | Charts: 42 |
|
Pandemic disrupted the entire world and affected many industries.
Get detailed COVID-19 impact analysis on the Fluoroscopy Equipment Market
Request Now !
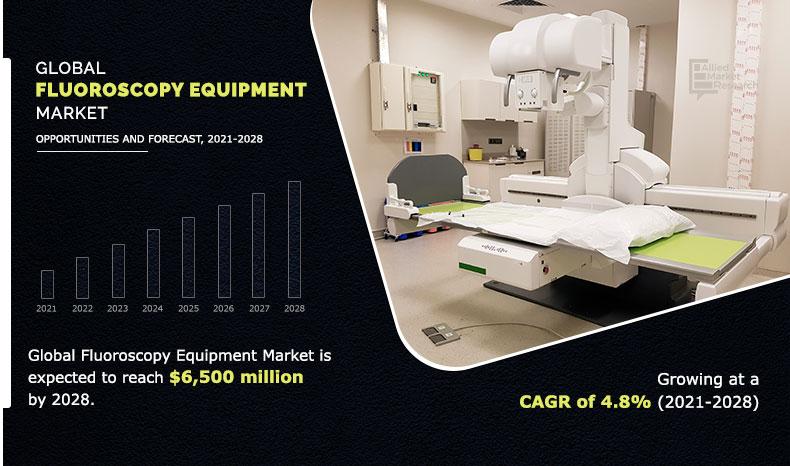
The fluoroscopy equipment market size was valued at $4,072.80 million in 2020, and is projected to reach $6,500.20 million by 2028, registering a CAGR of 4.8% from 2021 to 2028.
Fluoroscopy is a form of medical imaging that shows continuous X-ray image on a monitor. During a fluoroscopy operation, an X-ray pulse is passed through the body and the image is sent to a camera, which allows detailed analysis of movement of a body part, an instrument, or a contrast agent around the body. Fluoroscopy is a form of imaging that helps doctors diagnose illnesses and guide them through certain treatment procedures. Several fluoroscopy operations may be performed as outpatient procedures while patient is awake. For instance, a barium enema or an upper gastrointestinal series is done to investigate esophagus, liver, and small intestine. Other treatments are performed the same day or as inpatient procedures in a hospital, typically when patient is sedated. For instance, heart and coronary arteries that provide blood to heart muscle are examined using a procedure called cardiac catheterization. During surgery, other fluoroscopy operations can be done under general anesthesia.
Increase in incidences of pain management and trauma, gastrointestinal disorders, urological disorders, and other conditions, visualization of the targeted area with fluoroscopy equipment, and surge in geriatric population are the key factors that fuel growth of the global fluoroscopy equipment market. According to the International Osteoporosis Foundation, globally, osteoporosis causes more than 8.9 million fractures annually, which means that an osteoporosis fracture occurs in every 3 seconds. Moreover, growth in adoption of fluoroscopy equipment by patients, rise in awareness among healthcare professionals for use of fluoroscopy, and surge in incidences of cardiovascular diseases are other factors that contribute toward growth of the market. However, complications and side-effects associated with contrast agents and high cost associated with fluoroscopic equipment are expected to hinder growth of the market.
The World Health Organization (WHO) on January 30, 2021 declared COVID-19 outbreak a public health emergency of international concern. COVID-19 has affected around 210 countries across the globe. Nationwide lockdowns, government regulations, and continuous increase in infection rate across various countries have created a widespread financial impact on neurology hospitals and clinics. Large number of hospitals and clinics have witnessed a drop in number of patient visits amid COVID-19 ultimately reducing client contact. Furthermore, many diagnostic procedures through fluoroscopic equipment have been delayed due to the COVID-19 crisis. Moreover, to free-up limited space for people being treated for the virus, hospitals across the world have cancelled or postponed many diagnostic procedures, especially those deemed to be non-essential or non-urgent. At the same time, limited availability of healthcare staff across the globe is another factor that has an undesirable effect on the fluoroscopy equipment market
The fluoroscopy equipment market is segmented on the basis of product, application, and region to provide a detailed assessment of the market. By product, the market is bifurcated into fluoroscopy devices and c-arm. The c-arm segment is further divided into full size c-arm, and mobile c-arm. On the basis of application, the market is segregated into orthopedic, cardiovascular, pain management and trauma, neurology, gastrointestinal, urology, general surgery, and others. Region wise, it is analyzed across North America (U.S., Canada, Mexico) Europe (Germany, France, UK, Italy, Spain, Rest of Europe) Asia-Pacific (Japan, China, Australia, India, South Korea, Taiwan and rest of Asia-Pacific) and LAMEA (Brazil, Saudi Arabia, South Africa, and Rest of LAMEA).
Presently, on the basis of product, the fluoroscopic devices segment is the major revenue contributor, and is projected to grow significantly during the forecast period. Increase in adoption of fluoroscopic devices, surge in prevalence of cardiovascular diseases, need for pain management, rise in R&D investments over advancements in fluoroscopic equipment, increase in geriatric population, introduction of technologically advanced products, and surge in launch of new and advanced fluoroscopic devices are the key factors that boost growth of the segment.
Depending on application, the cardiovascular diseases segment is the expected to be a major shareholder in the fluoroscopy equipment market during the forecast period, owing to surge in prevalence of stroke, heart related diseases, government initiatives to modernize healthcare infrastructure, technological advancements in diagnostic equipment, and increase in product approvals of fluoroscopic equipment for better diagnosis of cardiovascular diseases than conventional diseases.
On the basis of region, North America gained highest market share in the fluoroscopy equipment market in 2020, owing to the surge in target diseases in the region such as cardiovascular diseases, orthopedic conditions, lung diseases and other conditions, and rise geriatric population who are susceptible to develop chronic conditions.
The key players profiled in this report include ADANI Systems Inc., Agfa-Gevaert Group, Canon Medical Systems, GE Healthcare, Hitachi Ltd., Koninklijke Philips N.V., Shimadzu Corporation, Siemens Healthineers, Toshiba Medical Systems Corporation and Ziehm Imaging GmbH
Key Benefits For Stakeholders
Key Market Segments
By Product
By Application
By Region
Fluoroscopy Equipment Market Report Highlights
Aspects | Details |
---|---|
By PRODUCT |
|
By APPLICATION |
|
By Region |
|
Key Market Players | Shimadzu Corporation, Ziehm Imaging GmbH, Agfa-Gevaert Group, GE Electric (GE Healthcare), Hitachi, Ltd., Medtronic, Inc., Koninklijke Philips N.V., Adani Systems Inc., Siemens Healthcare GmbH, Canon Medical Systems |
CHAPTER 1:INTRODUCTION
1.1.Report description
1.2.Key Benefits for Stakeholders
1.3.Key market segments
1.3.1.List of key players profiled in the report
1.4.Research methodology
1.4.1.Secondary research
1.4.2.Primary research
1.4.3.Analyst tools and models
CHAPTER 2:EXECUTIVE SUMMARY
2.1.Key findings of the study
2.2.CXO perspective
CHAPTER 3:MARKET LANDSCAPE
3.1.Market definition and scope
3.2.Key findings
3.2.1.Top investment pockets
3.2.2.Top winning strategies
3.3.Porter’s five force analysis
3.4.Top player positioning, 2020
3.5.Market dynamics
3.5.1.Drivers
3.5.1.1.Surge in geriatric population
3.5.1.2.Increase in prevalence of chronic diseases
3.5.1.3.Advantages of FPDs over other image intensifiers
3.5.2.Restraint
3.5.2.1.Exposure to radiation
3.5.2.2.Surge in adoption of refurbished diagnostic imaging systems
3.5.3.Opportunities
3.5.3.1.Growing demand for data integrated imaging systems
3.5.4.Impact analysis
3.6.COVID-19 Impact Analysis on Fluoroscopy equipment Market
CHAPTER 4:FLUOROSCOPIC EQUIPMENT MARKET, BY PRODUCT
4.1.Overview
4.1.1.Market size and forecast
4.2.Fluoroscopy devices
4.2.1.Key market trends, growth factors, and opportunities
4.2.2.Market size and forecast, by region
4.2.3.Market analysis, by country
4.3.C-Arm
4.3.1.Key market trends, growth factors, and opportunities
4.3.2.Market size and forecast
4.3.3.Market analysis, by country
4.3.4.Market size and forecast, by type
4.3.5.Full Size C-Arm
4.3.5.1.Market size and forecast
4.3.6.Mobile C-arm
4.3.6.1.Market size and forecast
4.3.7.Market size and forecast, by application
CHAPTER 5:FLUOROSCOPY EQUIPMENT MARKET, BY APPLICATION
5.1.Overview
5.1.1.Market size and forecast
5.2.Orthopedic
5.2.1.Market size and forecast, by region
5.2.2.Market analysis, by country
5.3.Cardiovascular
5.3.1.Market size and forecast, by region
5.3.2.Market analysis, by country
5.4.Pain Management and Trauma
5.4.1.Market size and forecast, by region
5.4.2.Market analysis, by country
5.5.Neurology
5.5.1.Market size and forecast, by region
5.5.2.Market analysis, by country
5.6.Gastrointestinal
5.6.1.Market size and forecast, by region
5.6.2.Market analysis, by country
5.7.Urology
5.7.1.Market size and forecast, by region
5.7.2.Market analysis, by country
5.8.General Surgery
5.8.1.Market size and forecast, by region
5.8.2.Market analysis, by country
5.9.Other Applications
5.9.1.Market size and forecast, by region
5.9.2.Market analysis, by country
CHAPTER 6:FLUOROSCOPY EQUIPMENT MARKET, BY REGION
6.1.Overview
6.1.1.Market size and forecast
6.2.North America
6.2.1.Key market trends, growth factors, and opportunities
6.2.2.Market size and forecast, by country
6.2.2.1.U.S.
6.2.2.1.1.U.S. fluoroscopy equipment market, by product
6.2.2.1.2.U.S. fluoroscopy equipment market, by application
6.2.2.1.3.U.S. fluoroscopy equipment market, by distribution channel
6.2.2.2.Canada
6.2.2.2.1.Canada fluoroscopy equipment market, by product
6.2.2.2.2.Canada fluoroscopy equipment market, by application
6.2.2.2.3.Canada fluoroscopy equipment market, by distribution channel
6.2.2.3.Mexico
6.2.2.3.1.Mexico fluoroscopy equipment market, by product
6.2.2.3.2.Mexico fluoroscopy equipment market, by application
6.2.2.3.3.Mexico fluoroscopy equipment market, by distribution channel
6.2.3.North America market size and forecast, by product
6.2.4.North America market size and forecast, by application
6.2.5.North America market size and forecast, by distribution channel
6.3.Europe
6.3.1.Key market trends, growth factors, and opportunities
6.3.2.Market size and forecast, by country
6.3.2.1.Germany
6.3.2.1.1.Germany fluoroscopy equipment market, by product
6.3.2.1.2.Germany fluoroscopy equipment market, by application
6.3.2.1.3.Germany fluoroscopy equipment market, by distribution channel
6.3.2.2.France
6.3.2.2.1.France fluoroscopy equipment market, by product
6.3.2.2.2.France fluoroscopy equipment market, by application
6.3.2.2.3.France fluoroscopy equipment market, by distribution channel
6.3.2.3.UK
6.3.2.3.1.UK fluoroscopy equipment market, by product
6.3.2.3.2.UK fluoroscopy equipment market, by application
6.3.2.3.3.UK fluoroscopy equipment market, by distribution channel
6.3.2.4.Italy
6.3.2.4.1.Italy fluoroscopy equipment market, by product
6.3.2.4.2.Italy fluoroscopy equipment market, by application
6.3.2.4.3.Italy fluoroscopy equipment market, by distribution channel
6.3.2.5.Spain
6.3.2.5.1.Spain fluoroscopy equipment market, by product
6.3.2.5.2.Spain fluoroscopy equipment market, by application
6.3.2.5.3.Spain fluoroscopy equipment market, by distribution channel
6.3.2.6.Rest of Europe
6.3.2.6.1.Rest of Europe fluoroscopy equipment market, by product
6.3.2.6.2.Rest of Europe fluoroscopy equipment market, by application
6.3.2.6.3.Rest of Europe fluoroscopy equipment market, by distribution channel
6.3.3.Europe market size and forecast, by product
6.3.4.Europe market size and forecast, by application
6.3.5.Europe market size and forecast, by distribution channel
6.4.Asia-Pacific
6.4.1.Key market trends, growth factors, and opportunities
6.4.2.Market size and forecast, by country
6.4.2.1.Japan
6.4.2.1.1.Japan fluoroscopy equipment market, by product
6.4.2.1.2.Japan fluoroscopy equipment market, by application
6.4.2.1.3.Japan fluoroscopy equipment market, by distribution channel
6.4.2.2.China
6.4.2.2.1.China fluoroscopy equipment market, by product
6.4.2.2.2.China fluoroscopy equipment market, by application
6.4.2.2.3.China fluoroscopy equipment market, by distribution channel
6.4.2.3.Australia
6.4.2.3.1.Australia fluoroscopy equipment market, by product
6.4.2.3.2.Australia fluoroscopy equipment market, by application
6.4.2.3.3.Australia fluoroscopy equipment market, by distribution channel
6.4.2.4.India
6.4.2.4.1.India fluoroscopy equipment market, by product
6.4.2.4.2.India fluoroscopy equipment market, by application
6.4.2.4.3.India fluoroscopy equipment market, by distribution channel
6.4.2.5.South Korea
6.4.2.5.1.South Korea fluoroscopy equipment market, by product
6.4.2.5.2.South Korea fluoroscopy equipment market, by application
6.4.2.5.3.South Korea fluoroscopy equipment market, by distribution channel
6.4.2.6.Rest of Asia-Pacific
6.4.2.6.1.Rest of Asia-Pacific fluoroscopy equipment market, by product
6.4.2.6.2.Rest of Asia-Pacific fluoroscopy equipment market, by application
6.4.2.6.3.Rest of Asia-Pacific fluoroscopy equipment market, by distribution channel
6.4.3.Asia-Pacific market size and forecast, by product
6.4.4.Asia-Pacific market size and forecast, by application
6.4.5.Asia-Pacific market size and forecast, by distribution channel
6.5.LAMEA
6.5.1.Key market trends, growth factors, and opportunities
6.5.2.Market size and forecast, by country
6.5.2.1.Brazil
6.5.2.1.1.Brazil fluoroscopy equipment market, by product
6.5.2.1.2.Brazil fluoroscopy equipment market, by application
6.5.2.1.3.Brazil fluoroscopy equipment market, by distribution channel
6.5.2.2.Saudi Arabia
6.5.2.2.1.Saudi Arabia fluoroscopy equipment market, by product
6.5.2.2.2.Saudi Arabia fluoroscopy equipment market, by application
6.5.2.2.3.Saudi Arabia fluoroscopy equipment market, by distribution channel
6.5.2.3.South Africa
6.5.2.3.1.South Africa fluoroscopy equipment market, by product
6.5.2.3.2.South Africa fluoroscopy equipment market, by application
6.5.2.3.3.South Africa fluoroscopy equipment market, by distribution channel
6.5.2.4.Rest of LAMEA
6.5.2.4.1.Rest of LAMEA fluoroscopy equipment market, by product
6.5.2.4.2.Rest of LAMEA fluoroscopy equipment market, by application
6.5.2.4.3.Rest of LAMEA fluoroscopy equipment market, by distribution channel
6.5.3.LAMEA market size and forecast, by product
6.5.4.LAMEA market size and forecast, by application
6.5.5.LAMEA market size and forecast, by distribution channel
CHAPTER 7:COMPANY PROFILES
7.1.Adani Systems Inc.
7.1.1.Company overview
7.1.2.Company snapshot
7.1.3.Operating business segments
7.1.4.Product portfolio
7.2.Agfa-Gevaert Group
7.2.1.Company overview
7.2.2.Company snapshot
7.2.3.Operating business segments
7.2.4.Product portfolio
7.2.5.Business performance
7.2.6.Key strategic moves and developments
7.3.Canon Medical Systems
7.3.1.Company overview
7.3.2.Company snapshot
7.3.3.Operating business segments
7.3.4.Product portfolio
7.3.5.Business performance
7.3.6.Key strategic moves and developments
7.4.GE Electric (GE Healthcare)
7.4.1.Company overview
7.4.2.Company snapshot
7.4.3.Operating business segments
7.4.4.Product portfolio
7.4.5.Business performance
7.4.6.Key strategic moves and developments
7.5.Hitachi, Ltd.
7.5.1.Company overview
7.5.2.Company snapshot
7.5.3.Operating business segments
7.5.4.Product portfolio
7.5.5.Business performance
7.6.Medtronic, Inc.
7.6.1.Company overview
7.6.2.Company snapshot
7.6.3.Operating business segments
7.6.4.Product portfolio
7.6.5.Business performance
7.6.6.Key strategic moves and developments
7.7.Koninklijke Philips N.V.
7.7.1.Company overview
7.7.2.Company snapshot
7.7.3.Operating business segments
7.7.4.Product portfolio
7.7.5.Business performance
7.7.6.Key strategic moves and developments
7.8.Shimadzu Corporation
7.8.1.Company overview
7.8.2.Company snapshot
7.8.3.Operating business segments
7.8.4.Product portfolio
7.8.5.Business performance
7.8.6.Key strategic moves and developments
7.9.Siemens Healthcare GmbH
7.9.1.Company overview
7.9.2.Company snapshot
7.9.3.Operating business segments
7.9.4.Product portfolio
7.9.5.Business performance
7.9.6.Key strategic moves and developments
7.10.Ziehm Imaging GmbH
7.10.1.Company overview
7.10.2.Company snapshot
7.10.3.Operating business segments
7.10.4.Product portfolio
7.10.5.Key strategic moves and developments
LIST OF TABLES
TABLE 01.GLOBAL FLUOROSCOPIC EQUIPMENT MARKET, BY PRODUCT, 2020–2028 ($MILLION)
TABLE 02.FLUOROSCOPY DEVICES, FLUOROSCOPIC EQUIPMENT MARKET, BY REGION, 2020–2028 ($MILLION)
TABLE 03.C-ARM FLUOROSCOPIC EQUIPMENT MARKET, BY REGION, 2020–2028 ($MILLION)
TABLE 04.C-ARM FLUOROSCOPIC EQUIPMENT MARKET, BY TYPE, 2020–2028, ($MILLION)
TABLE 05.MOBILE C-ARM FLUOROSCOPIC EQUIPMENT MARKET, BY APPLICATION, 2020–2028, ($MILLION)
TABLE 06.GLOBAL FLUOROSCOPY EQUIPMENT MARKET, BY APPLICATION, 2020–2028 ($MILLION)
TABLE 07.ORTHOPEDIC FLUOROSCOPY EQUIPMENT MARKET, BY REGION, 2020–2028 ($MILLION)
TABLE 08.CARDIOVASCULAR FLUOROSCOPY EQUIPMENT MARKET, BY REGION, 2020–2028 ($MILLION)
TABLE 09.PAIN MANAGEMENT AND TRAUMA FLUOROSCOPY EQUIPMENT MARKET, BY REGION, 2020–2028 ($MILLION)
TABLE 10.NEUROLOGY FLUOROSCOPY EQUIPMENT MARKET, BY REGION, 2020–2028 ($MILLION)
TABLE 11.GASTROINTESTINAL FLUOROSCOPY EQUIPMENT MARKET, BY REGION, 2020–2028 ($MILLION)
TABLE 12.UROLOGY FLUOROSCOPY EQUIPMENT MARKET, BY REGION, 2020–2028 ($MILLION)
TABLE 13.GENERAL SURGERYFLUOROSCOPY EQUIPMENT MARKET, BY REGION, 2020–2028 ($MILLION)
TABLE 14.OTHER APPLICATIONS FLUOROSCOPY EQUIPMENT MARKET, BY REGION, 2020–2028 ($MILLION)
TABLE 15.FLUOROSCOPY EQUIPMENT MARKET, BY REGION, 2020–2028 ($MILLION)
TABLE 16.NORTH AMERICA FLUOROSCOPY EQUIPMENT MARKET, BY COUNTRY, 2020–2028 ($MILLION)
TABLE 17.U.S. FLUOROSCOPY EQUIPMENT MARKET, BY PRODUCT, 2020–2028
TABLE 18.U.S. FLUOROSCOPY EQUIPMENT MARKET, BY APPLICATION, 2020–2028
TABLE 19.U.S. FLUOROSCOPY EQUIPMENT MARKET, BY DISTRIBUTION CHANNEL, 2020–2028
TABLE 20.CANADA FLUOROSCOPY EQUIPMENT MARKET, BY PRODUCT, 2020–2028
TABLE 21.CANADA FLUOROSCOPY EQUIPMENT MARKET, BY APPLICATION, 2020–2028
TABLE 22.CANADA FLUOROSCOPY EQUIPMENT MARKET, BY DISTRIBUTION CHANNEL, 2020–2028
TABLE 23.MEXICO FLUOROSCOPY EQUIPMENT MARKET, BY PRODUCT, 2020–2028
TABLE 24.MEXICO FLUOROSCOPY EQUIPMENT MARKET, BY APPLICATION, 2020–2028
TABLE 25.MEXICO FLUOROSCOPY EQUIPMENT MARKET, BY DISTRIBUTION CHANNEL, 2020–2028
TABLE 26.NORTH AMERICA FLUOROSCOPY EQUIPMENT MARKET, BY PRODUCT, 2020–2028
TABLE 27.NORTH AMERICA FLUOROSCOPY EQUIPMENT MARKET, BY APPLICATION, 2020–2028
TABLE 28.NORTH AMERICA FLUOROSCOPY EQUIPMENT MARKET, BY DISTRIBUTION CHANNEL, 2020–2028
TABLE 29.EUROPE FLUOROSCOPY EQUIPMENT MARKET, BY COUNTRY, 2020–2028 ($MILLION)
TABLE 30.GERMANY FLUOROSCOPY EQUIPMENT MARKET, BY PRODUCT, 2020–2028
TABLE 31.GERMANY FLUOROSCOPY EQUIPMENT MARKET, BY APPLICATION, 2020–2028
TABLE 32.GERMANY FLUOROSCOPY EQUIPMENT MARKET, BY DISTRIBUTION CHANNEL, 2020–2028
TABLE 33.FRANCE FLUOROSCOPY EQUIPMENT MARKET, BY PRODUCT, 2020–2028
TABLE 34.FRANCE FLUOROSCOPY EQUIPMENT MARKET, BY APPLICATION, 2020–2028
TABLE 35.FRANCE FLUOROSCOPY EQUIPMENT MARKET, BY DISTRIBUTION CHANNEL, 2020–2028
TABLE 36.UK FLUOROSCOPY EQUIPMENT MARKET, BY PRODUCT, 2020–2028
TABLE 37.UK FLUOROSCOPY EQUIPMENT MARKET, BY APPLICATION, 2020–2028
TABLE 38.UK FLUOROSCOPY EQUIPMENT MARKET, BY DISTRIBUTION CHANNEL, 2020–2028
TABLE 39.ITALY FLUOROSCOPY EQUIPMENT MARKET, BY PRODUCT, 2020–2028
TABLE 40.ITALY FLUOROSCOPY EQUIPMENT MARKET, BY APPLICATION, 2020–2028
TABLE 41.ITALY FLUOROSCOPY EQUIPMENT MARKET, BY DISTRIBUTION CHANNEL, 2020–2028
TABLE 42.SPAIN FLUOROSCOPY EQUIPMENT MARKET, BY PRODUCT, 2020–2028
TABLE 43.SPAIN FLUOROSCOPY EQUIPMENT MARKET, BY APPLICATION, 2020–2028
TABLE 44.SPAIN FLUOROSCOPY EQUIPMENT MARKET, BY DISTRIBUTION CHANNEL, 2020–2028
TABLE 45.REST OF EUROPE FLUOROSCOPY EQUIPMENT MARKET, BY PRODUCT, 2020–2028
TABLE 46.REST OF EUROPE FLUOROSCOPY EQUIPMENT MARKET, BY APPLICATION, 2020–2028
TABLE 47.REST OF EUROPE FLUOROSCOPY EQUIPMENT MARKET, BY DISTRIBUTION CHANNEL, 2020–2028
TABLE 48.EUROPE FLUOROSCOPY EQUIPMENT MARKET, BY PRODUCT, 2020–2028
TABLE 49.EUROPE FLUOROSCOPY EQUIPMENT MARKET, BY APPLICATION, 2020–2028
TABLE 50.EUROPE FLUOROSCOPY EQUIPMENT MARKET, BY DISTRIBUTION CHANNEL, 2020–2028
TABLE 51.ASIA-PACIFIC FLUOROSCOPY EQUIPMENT MARKET, BY COUNTRY, 2020–2028 ($MILLION)
TABLE 52.JAPAN FLUOROSCOPY EQUIPMENT MARKET, BY PRODUCT, 2020–2028
TABLE 53.JAPAN FLUOROSCOPY EQUIPMENT MARKET, BY APPLICATION, 2020–2028
TABLE 54.JAPAN FLUOROSCOPY EQUIPMENT MARKET, BY DISTRIBUTION CHANNEL, 2020–2028
TABLE 55.CHINA FLUOROSCOPY EQUIPMENT MARKET, BY PRODUCT, 2020–2028
TABLE 56.CHINA FLUOROSCOPY EQUIPMENT MARKET, BY APPLICATION, 2020–2028
TABLE 57.CHINA FLUOROSCOPY EQUIPMENT MARKET, BY DISTRIBUTION CHANNEL, 2020–2028
TABLE 58.AUSTRALIA FLUOROSCOPY EQUIPMENT MARKET, BY PRODUCT, 2020–2028
TABLE 59.AUSTRALIA FLUOROSCOPY EQUIPMENT MARKET, BY APPLICATION, 2020–2028
TABLE 60.AUSTRALIA FLUOROSCOPY EQUIPMENT MARKET, BY DISTRIBUTION CHANNEL, 2020–2028
TABLE 61.INDIA FLUOROSCOPY EQUIPMENT MARKET, BY PRODUCT, 2020–2028
TABLE 62.INDIA FLUOROSCOPY EQUIPMENT MARKET, BY APPLICATION, 2020–2028
TABLE 63.INDIA FLUOROSCOPY EQUIPMENT MARKET, BY DISTRIBUTION CHANNEL, 2020–2028
TABLE 64.SOUTH KOREA FLUOROSCOPY EQUIPMENT MARKET, BY PRODUCT, 2020–2028
TABLE 65.SOUTH KOREA FLUOROSCOPY EQUIPMENT MARKET, BY APPLICATION, 2020–2028
TABLE 66.SOUTH KOREA FLUOROSCOPY EQUIPMENT MARKET, BY DISTRIBUTION CHANNEL, 2020–2028
TABLE 67.REST OF ASIA-PACIFIC FLUOROSCOPY EQUIPMENT MARKET, BY PRODUCT, 2020–2028
TABLE 68.REST OF ASIA-PACIFIC FLUOROSCOPY EQUIPMENT MARKET, BY APPLICATION, 2020–2028
TABLE 69.REST OF ASIA-PACIFIC FLUOROSCOPY EQUIPMENT MARKET, BY DISTRIBUTION CHANNEL, 2020–2028
TABLE 70.ASIA-PACIFIC FLUOROSCOPY EQUIPMENT MARKET, BY PRODUCT, 2020–2028
TABLE 71.ASIA-PACIFIC FLUOROSCOPY EQUIPMENT MARKET, BY APPLICATION, 2020–2028
TABLE 72.ASIA-PACIFIC FLUOROSCOPY EQUIPMENT MARKET, BY DISTRIBUTION CHANNEL, 2020–2028
TABLE 73.LAMEA FLUOROSCOPY EQUIPMENT MARKET, BY COUNTRY, 2020–2028 ($MILLION)
TABLE 74.LAMEA FLUOROSCOPY EQUIPMENT MARKET, BY COUNTRY, 2020–2028 (UNITS)
TABLE 75.BRAZIL FLUOROSCOPY EQUIPMENT MARKET, BY PRODUCT, 2020–2028
TABLE 76.BRAZIL FLUOROSCOPY EQUIPMENT MARKET, BY APPLICATION, 2020–2028
TABLE 77.BRAZIL FLUOROSCOPY EQUIPMENT MARKET, BY DISTRIBUTION CHANNEL, 2020–2028
TABLE 78.SAUDI ARABIA FLUOROSCOPY EQUIPMENT MARKET, BY PRODUCT, 2020–2028
TABLE 79.SAUDI ARABIA FLUOROSCOPY EQUIPMENT MARKET, BY APPLICATION, 2020–2028
TABLE 80.SAUDI ARABIA FLUOROSCOPY EQUIPMENT MARKET, BY DISTRIBUTION CHANNEL, 2020–2028
TABLE 81.SOUTH AFRICA FLUOROSCOPY EQUIPMENT MARKET, BY PRODUCT, 2020–2028
TABLE 82.SOUTH AFRICA FLUOROSCOPY EQUIPMENT MARKET, BY APPLICATION, 2020–2028
TABLE 83.SOUTH AFRICA FLUOROSCOPY EQUIPMENT MARKET, BY DISTRIBUTION CHANNEL, 2020–2028
TABLE 84.REST OF LAMEA FLUOROSCOPY EQUIPMENT MARKET, BY PRODUCT, 2020–2028
TABLE 85.REST OF LAMEA FLUOROSCOPY EQUIPMENT MARKET, BY APPLICATION, 2020–2028
TABLE 86.REST OF LAMEA FLUOROSCOPY EQUIPMENT MARKET, BY DISTRIBUTION CHANNEL, 2020–2028
TABLE 87.LAMEA FLUOROSCOPY EQUIPMENT MARKET, BY PRODUCT, 2020–2028
TABLE 88.LAMEA FLUOROSCOPY EQUIPMENT MARKET, BY APPLICATION, 2020–2028
TABLE 89.LAMEA FLUOROSCOPY EQUIPMENT MARKET, BY DISTRIBUTION CHANNEL, 2020–2028
TABLE 90.ADANI: COMPANY SNAPSHOT
TABLE 91.ADANI: OPERATING SEGMENTS
TABLE 92.ADANI: PRODUCT PORTFOLIO
TABLE 93.AGFA: COMPANY SNAPSHOT
TABLE 94.AGFA: OPERATING SEGMENTS
TABLE 95.AGFA: PRODUCT PORTFOLIO
TABLE 96.AGFA: KEY STRATEGIC MOVES AND DEVELOPMENTS
TABLE 97.CANON: COMPANY SNAPSHOT
TABLE 98.CANON: OERATING SEGMENT
TABLE 99.CANON: PRODUCT PORTFOLIO
TABLE 100.CANON: KEY STRATEGIC MOVES AND DEVELOPMENTS
TABLE 101.GE ELECTRIC: COMPANY SNAPSHOT
TABLE 102.GE ELECTRIC: OPERATING SEGMENTS
TABLE 103.GE ELECTRIC: PRODUCT PORTFOLIO
TABLE 104.GE ELECTRIC: KEY STRATEGIC MOVES AND DEVELOPMENTS
TABLE 105.HITACHI: COMPANY SNAPSHOT
TABLE 106.HITACHI: OERATING SEGMENT
TABLE 107.HITACHI: PRODUCT PORTFOLIO
TABLE 108.MEDTRONIC: COMPANY SNAPSHOT
TABLE 109.MEDTRONIC: OPERATING SEGMENTS
TABLE 110.MEDTRONIC: PRODUCT PORTFOLIO
TABLE 111.MEDTRONIC: KEY STRATEGIC MOVES AND DEVELOPMENTS
TABLE 112.PHILIPS: COMPANY SNAPSHOT
TABLE 113.PHILIPS: OERATING SEGMENT
TABLE 114.PHILIPS: PRODUCT PORTFOLIO
TABLE 115.PHILIPS: KEY STRATEGIC MOVES AND DEVELOPMENTS
TABLE 116.SHIMADZU: COMPANY SNAPSHOT
TABLE 117.SHIMADZU: OERATING SEGMENTS
TABLE 118.SHIMADZU: PRODUCT PORTFOLIO
TABLE 119.SHIMADZU: KEY STRATEGIC MOVES AND DEVELOPMENTS
TABLE 120.SIEMENS: COMPANY SNAPSHOT
TABLE 121.SIEMENS: OERATING SEGMENTS
TABLE 122.SIEMENS: PRODUCT PORTFOLIO
TABLE 123.SIEMENS: KEY STRATEGIC MOVES AND DEVELOPMENTS
TABLE 124.ZIEHM: COMPANY SNAPSHOT
TABLE 125.ZIEHM: PRODUCT PORTFOLIO
TABLE 126.ZIEHM: KEY STRATEGIC MOVES AND DEVELOPMENTS
LIST OF FIGURES
FIGURE 01.GLOBAL FLUOROSCOPY EQUIPMENT MARKET SEGMENTATION
FIGURE 02.TOP INVESTMENT POCKETS
FIGURE 03.TOP WINNING STRATEGIES, BY YEAR, 2017-2021
FIGURE 04.TOP WINNING STRATEGIES, BY DEVELOPMENT, 2017-2021
FIGURE 05.TOP WINNING STRATEGIES, BY COMPANY, 2017-2021
FIGURE 01.MODERATE BARGAINING POWER OF SUPPLIERS
FIGURE 02.MODERATE BARGAINING POWER OF BUYERS
FIGURE 03.MODERATE THREAT OF SUBSTITUTES
FIGURE 04.MODERATE THREAT OF NEW ENTRANTS
FIGURE 05.MODERATE INTENSITY OF RIVALRY
FIGURE 06.TOP PLAYER POSITIONING, 2020
FIGURE 07.IMPACT ANALYSIS
FIGURE 08.COMPARATIVE ANALYSIS OF FLUOROSCOPY DEVICES, FLUOROSCOPIC EQUIPMENT MARKET, BY COUNTRY, 2020 & 2028 ($MILLION)
FIGURE 09.COMPARATIVE ANALYSIS OF C-ARM FLUOROSCOPIC EQUIPMENT MARKET, BY COUNTRY, 2020 & 2028 ($MILLION)
FIGURE 10.FULL SIZE C-ARM MARKET, 2020–2028, ($MILLION)
FIGURE 11.MOBILE C-ARM MARKET, 2020–2028, ($MILLION)
FIGURE 12.COMPARATIVE ANALYSIS OF ORTHOPEDIC FLUOROSCOPY EQUIPMENT MARKET, BY COUNTRY, 2020 & 2028 ($MILLION)
FIGURE 13.COMPARATIVE ANALYSIS OF CARDIOVASCULAR FLUOROSCOPY EQUIPMENT MARKET, BY COUNTRY, 2020 & 2028 ($MILLION)
FIGURE 14.COMPARATIVE ANALYSIS OF PAIN MANAGEMENT AND TRAUMA FLUOROSCOPY EQUIPMENT MARKET, BY COUNTRY, 2020 & 2028 ($MILLION)
FIGURE 15.COMPARATIVE ANALYSIS OF NEUROLOGY FLUOROSCOPY EQUIPMENT MARKET, BY COUNTRY, 2020 & 2028 ($MILLION)
FIGURE 16.COMPARATIVE ANALYSIS OF GASTROINTESTINAL FLUOROSCOPY EQUIPMENT MARKET, BY COUNTRY, 2020 & 2028 ($MILLION)
FIGURE 17.COMPARATIVE ANALYSIS OF UROLOGY FLUOROSCOPY EQUIPMENT MARKET, BY COUNTRY, 2020 & 2028 ($MILLION)
FIGURE 18.COMPARATIVE ANALYSIS OF GENERAL SURGERY FLUOROSCOPY EQUIPMENT MARKET, BY COUNTRY, 2020 & 2028 ($MILLION)
FIGURE 19.COMPARATIVE ANALYSIS OF OTHER APPLICATIONS FLUOROSCOPY EQUIPMENT MARKET, BY COUNTRY, 2020 & 2028 ($MILLION)
FIGURE 20.AGFA: NET SALES, 2018-2020 ($MILLION)
FIGURE 21.AGFA: REVENUE SHARE BY SEGMENT, 2020 (%)
FIGURE 22.AGFA: REVENUE SHARE BY REGION, 2020 (%)
FIGURE 23.CANON: NET SALES, 2018–2020 ($MILLION)
FIGURE 24.CANON: REVENUE SHARE BY SEGMENT, 2020 (%)
FIGURE 25.CANON: REVENUE SHARE BY REGION, 2020 (%)
FIGURE 26.GE ELECTRIC: NET SALES, 2018-2020 ($MILLION)
FIGURE 27.GE ELECTRIC: REVENUE SHARE BY SEGMENT, 2019 (%)
FIGURE 28.GE ELECTRIC: REVENUE SHARE BY REGION, 2019 (%)
FIGURE 29.HITACHI: NET SALES, 2018-2020 ($MILLION)
FIGURE 30.HITACHI: REVENUE SHARE BY SEGMENT, 2019 (%)
FIGURE 31.HITACHI: REVENUE SHARE BY REGION, 2019 (%)
FIGURE 32.MEDTRONIC: NET SALES, 2018-2020 ($MILLION)
FIGURE 33.MEDTRONIC: REVENUE SHARE BY SEGMENT, 2020 (%)
FIGURE 34.MEDTRONIC: REVENUE SHARE BY REGION, 2020 (%)
FIGURE 35.PHILIPS: NET SALES, 2018-2020 ($MILLION)
FIGURE 36.PHILIPS: REVENUE SHARE BY SEGMENT, 2020 (%)
FIGURE 37.PHILIPS: REVENUE SHARE BY REGION, 2020 (%)
FIGURE 38.SHIMADZU: NET SALES, 2017-2019 ($MILLION)
FIGURE 39.SHIMADZU: REVENUE SHARE BY SEGMENT, 2019 (%)
FIGURE 40.SIEMENS: NET SALES, 2018-2020 ($MILLION)
FIGURE 41.SIEMENS: REVENUE SHARE BY SEGMENT, 2020 (%)
FIGURE 42.SIEMENS: REVENUE SHARE BY REGION, 2020 (%)
Fluoroscopy equipment is used to diagnose and even monitor progression of disease. This device is mainly used to visualize live pictures to check whether surgical procedure is accurately performed and assists healthcare professionals to make quick corrections while performing a surgery. Moreover, it can be used to diagnose severity of conditions such as cardiovascular diseases, urology disorders, orthopedic condition, and other chronic conditions.
Increase in awareness toward usage of fluoroscopy, increase in prevalence of orthopedic conditions, surge in incidences of sports injuries and cardiovascular diseases, technological advancements in fluoroscopic equipment, rise in demand for fluoroscopic devices, and rise in geriatric population are expected to drive growth of the fluoroscopy equipment market. Furthermore, introduction of advanced fluoroscopy equipment and favorable reimbursement policies associated with these equipment are expected to propel the market growth. However, side-effects associated with usage of contrasting agents and higher cost associated with fluoroscopic equipment are expected to hinder growth of the market.
North America is expected to remain dominant during the forecast period, owing to increase in demand for fluoroscopy equipment, rise in incidences of chronic orthopedic conditions, and presence of major key players along with R&D centers. Moreover, Asia-Pacific and LAMEA are expected to offer lucrative opportunities to key players during the forecast period, owing to increase in number of hospitals equipped with advanced medical facilities along with surge in utilization of fluoroscopy equipment.
A. The total market value of Fluoroscopic Equipment Market is $4072.8 million in 2020
A. The forecast period in the report is from 2021 to 2028
A. The market value of Fluoroscopic Equipment Market in 2020 was $4683.7 Million
A. The base year for the report is 2020
A. Yes, Fluoroscopic Equipment companies are profiled in the report
A. The top companies that hold the market share in Fluoroscopic Equipment Market are ADANI Systems Inc., Agfa-Gevaert Group, Canon Medical Systems, GE Healthcare, Hitachi Ltd., Koninklijke Philips N.V., Shimadzu Corporation, Siemens Healthineers, Toshiba Medical Systems Corporation, and Ziehm Imaging GmbH.
A. No, there is no value chain analysis provided in the Fluoroscopic Equipment Market report
A. The key trends in the Fluoroscopic Equipment Market are increase in incidences of cancer, and other chronic conditions and surge in R&D of fluoroscopic equipment.
Start reading instantly.
This Report and over 68,113+ more Reports, Available with Avenue Library. T&C*.
Enterprise
License/PDF
Library
Membership
*Taxes/Fees, if applicable will be added during checkout. All prices in USD
To ensure high-level data integrity, accurate analysis, and impeccable forecasts
For complete satisfaction
On-demand customization of scope of the report to exactly meet your needs
Targeted market view to provide pertinent information and save time of readers
Get insights on topics that are crucial for your business. Stay abreast of your interest areas.
Get Industry Data AlertsTo ensure high-level data integrity, accurate analysis, and impeccable forecasts
For complete satisfaction
On-demand customization of scope of the report to exactly meet your needs
Targeted market view to provide pertinent information and save time of readers