Report Code: A04816 | Feb 2019 | Pages: 205 | ||
Tables: 92 | Charts: 47 |
|
Pandemic disrupted the entire world and affected many industries.
Get detailed COVID-19 impact analysis on the Food And Beverages Disinfection Market
Request Now !The global food and beverages disinfection market is estimated to reach $2,387.9 million by 2025 growing at a CAGR of 4.4% during the forecast period. Food disinfection can be achieved by means of chemical disinfectants or physical methods in the environment without compromising the food safety and quality. The selection criteria for a sanitizer/disinfectant vastly depends on the type of food products to be sanitized, the hardness of the water, the efficacy of disinfectants under site conditions, and cost of sanitizer.
Â
Growth in incidence of food borne disease due to unknown species (bacteria, viruses, fungi, prions, parasites), chemicals, radioactive substances are increasing healthcare burden on service provider & government authorities. According to WHO, 1 in 10 people suffer from contaminated food consumption annually with mortality of approximate 420,000 globally. Africa and Southeast Asia have prominent incidence rate of food borne illness and death. The incidence of food borne illness is high among new borne and pediatric population of Africa. The significant growth in food borne disease patient population due to contaminated raw vegetables, ready-to-eat meals, processed meats, and other packaged food products is expected to boost the growth of the food and beverages disinfection market.
Â
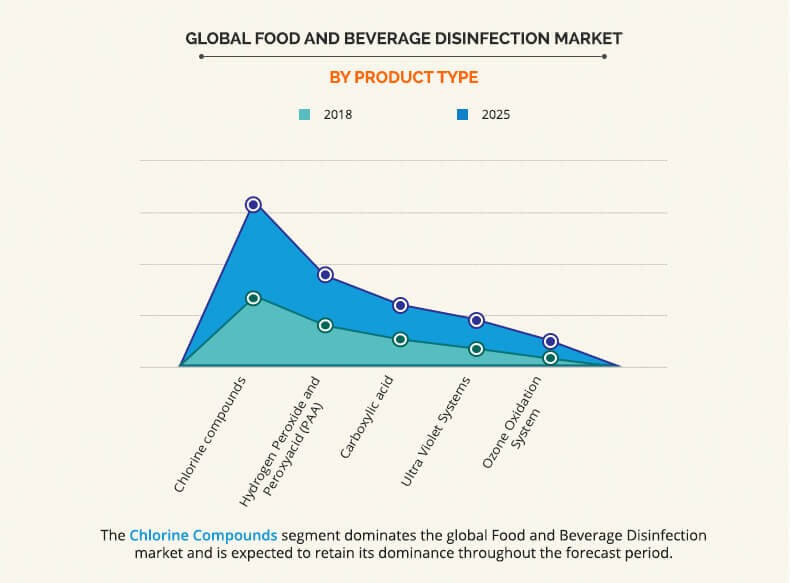
The chlorine compound segment exhibits highest revenue share in 2017 and is anticipated to remain dominant during the forecast period. The primary rational behind the significant growth of the segment in the market includes diversified application of various chlorine compounds. This is expected to boost the revenue growth of chlorine compound segment during the forecast period. Chlorine compound offers reliable and effective measure against various pathogens such as Campylobacter, Salmonella, E. coli, Protozoa, and others.
Ozone oxidation systems are largely used across retail food chains and large scale food processing companies in Europe region. European Food Safety Authority (EFSA) regulates the consumption and usage of chemical disinfectants in food and beverage industry. Food and food ingredients authorized for irradiation treatment are listed by Directive 1993/3/EC. EU5 countries holds maximum revenue share in overall Europe Food and Beverages Disinfection market owing to large consumption of packaged food products and local cuisine at full service restaurants.
Â
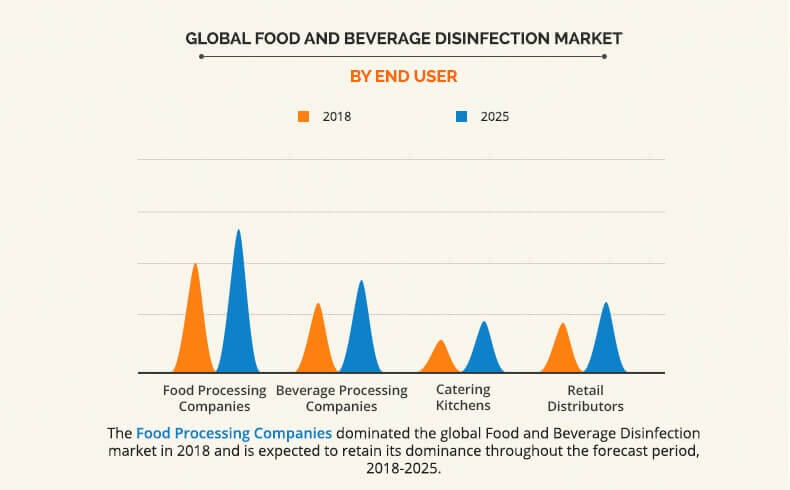
In 2017, the food processing companies segment accounts for the highest revenue share in the Food and Beverages Disinfection market. The segment is anticipated to exhibit significant revenue growth owing to rise in consumer awareness toward hygienic packaged food products and extensive focus from food safety authorities during supply chain and retail distribution during the forecast period. The companies currently operating in the food processing industry are now focusing on the implementation of more advance and next generation disinfection and sanitation technologies.
Emergence of e-Commerce distribution in packaged food industry has provided a competitive edge for food and beverage manufactures. These companies are suppling their products in global market which requires strict compliance in term of product hygiene during processing and transportation. The growing consumption of processed food from international market would be primary factor driving the adoption of disinfection technologies in retail food and distribution end user in Food and Beverages Disinfection market analysis.
Â
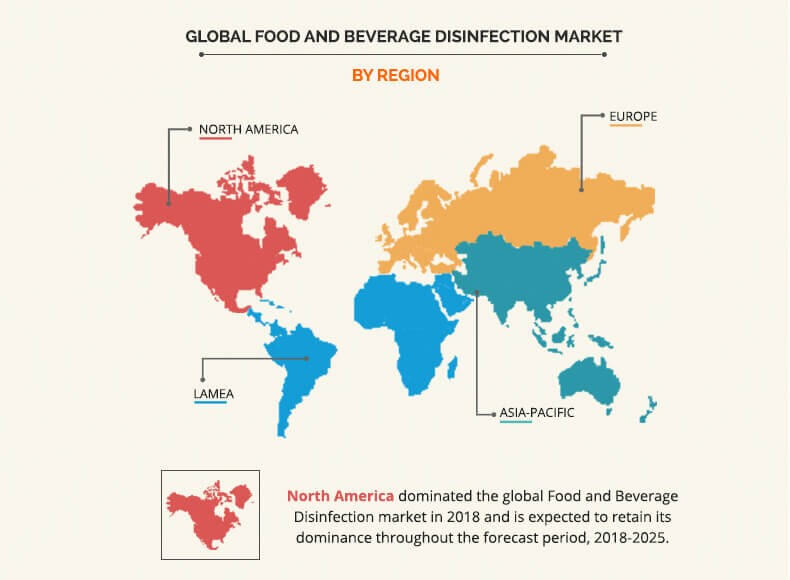
Asia-Pacific is expected to remain dominant in terms of growth with a CAGR of XX% during the forecast period in the Food and Beverages Disinfection market followed by LAMEA. The significant revenue growth in Asia-Pacific is attributed to the increase in expenditure on packaged food and beverages and fine dining services. Disposable income on fine dining in India and China is higher than other countries of the Asia-Pacific region. Most of the fine diners visiting premium restaurant in Asia-Pacific are millennials aged between 18 and 29. Such increase in popularity of fine dining has created a need to provide hygienic service to consumer. Moreover, increase in tourism activities in the ASEAN region has significantly increased the consumption of packaged food products in the region, which is expected to boost the revenue growth of the Food and Beverages Disinfection market in Asia-Pacific.
Beverage processing companies followed by quick service restaurants are the major end users of UV radiation systems in Europe market. Commission Regulation (EC) No 2073/2005 on microbiological criteria for foods has enforced food safety criteria for foodborne (toxins and metabolites). These criteria had defined the acceptability of a food product or a batch of food placed in the retail market. The regulatory imposition for food safety is expected to fuel Food and Beverages Disinfection market growth in Europe region
The key players profiled in the report include Toshiba, Evoqua Water Technologies, UV-Guard Australia, Evonik, Trojan Technologies, Entaco, Solvay, CCL Pentasol, Halma, and Xylem
Food and Beverages Disinfection Market Report Highlights
Aspects | Details |
---|---|
By Product Type |
|
By End User |
|
By Region |
|
Key Market Players | UV-Guard Australia, Entaco, Trojan Technologies, Evoqua Water Technologies, Xylem, CCL Pentasol, Evonik, Solvay, Halma, Toshiba |
CHAPTER 1:Â Â Â INTRODUCTION
1.1.   Report Description
1.2.   Key Benefits for Stakeholders
1.3.   Key Market Segments
1.4.   Research Methodology
1.4.1.   Primary Research
1.4.2.   Secondary Research
1.4.3.   Analyst Tools and Models
CHAPTER 2:Â Â Â EXECUTIVE SUMMARY
2.1.   Key Findings of The Study
2.2.   CXO Perspective
CHAPTER 3:Â Â Â MARKET OVERVIEW
3.1.   Market Definition and Scope
3.2.   Key Findings
3.2.1.   Top investment pocket
3.2.2.   Top winning strategies
3.2.3.   Top winning strategies, by year, 2015-2018*
3.2.4.   Top winning strategies, by development, 2015-2018* (%)
3.2.5.   Top winning strategies, by company, 2015-2018*
3.3.   Porter's Five Forces analysis
3.3.1.   Bargaining Power of Suppliers
3.3.2.   Bargaining power of buyers
3.3.3.   Threat of substitution
3.3.4.   Threat of new entrants
3.3.5.   Intensity of competitive rivalry
3.4.   Market dynamics
3.4.1.   Drivers
3.4.1.1.   • Growing incidence of food borne disease
3.4.1.2.   • Stronger penetration of UV disinfection equipment
3.4.1.3.   • Alternative solution to chemical disinfectants
3.4.2.   Restraints
3.4.2.1.   • Stringent regulatory guidelines for chemical disinfection & sanitation standards
3.4.2.2.   • Limited usage among Retail/Foodservice Establishments
3.4.3.   Opportunities
3.4.3.1.   • Food Disinfection equipment to hold key revenue opportunity
3.4.3.2.   • Increasing demand for packaged food products in Asia region
CHAPTER 4:Â Â Â FOOD AND BEVERAGE DISINFECTION MARKET, BY PRODUCT TYPE
4.1.   Overview
4.1.1.   Market size and forecast
4.2.   Chlorine compounds
4.2.1.   Key market trends, growth factors, and opportunities
4.2.2.   Market size and forecast
4.2.3.   Market analysis, by country
4.3.   Hydrogen Peroxide and Peroxyacid (PAA)
4.3.1.   Key market trends, growth factors, and opportunities
4.3.2.   Market size and forecast
4.3.3.   Market analysis, by country
4.4.   Carboxylic acid
4.4.1.   Key market trends, growth factors, and opportunities
4.4.2.   Market size and forecast
4.4.3.   Market analysis, by country
4.5.   Ultra Violet Systems
4.5.1.   Key market trends, growth factors, and opportunities
4.5.2.   Market size and forecast
4.5.3.   Market analysis, by country
4.6.   Ozone Oxidation System
4.6.1.   Key market trends, growth factors, and opportunities
4.6.2.   Market size and forecast
4.6.3.   Market analysis, by country
CHAPTER 5:Â Â Â FOOD AND BEVERAGE DISINFECTION MARKET, BY END USER
5.1.   Overview
5.1.1.   Market size and forecast
5.2.   Food Processing Companies
5.2.1.   Key market trends, growth factors, and opportunities
5.2.2.   Market size and forecast
5.2.3.   Market analysis, by country
5.3.   Beverage Processing Companies
5.3.1.   Key market trends, growth factors, and opportunities
5.3.2.   Market size and forecast
5.3.3.   Market analysis, by country
5.4.   Catering Kitchens
5.4.1.   Key market trends, growth factors, and opportunities
5.4.2.   Market size and forecast
5.4.3.   Market analysis, by country
5.5.   Retail Distributors
5.5.1.   Key market trends, growth factors, and opportunities
5.5.2.   Market size and forecast
5.5.3.   Market analysis, by country
CHAPTER 6:Â Â Â FOOD AND BEVERAGE DISINFECTION MARKET, BY REGION
6.1.   Overview
6.1.1.   Market size and forecast
6.2.   North America
6.2.1.   Key market trends, growth factors, and opportunities
6.2.2.   Market size and forecast, by Product Type
6.2.3.   Market size and forecast, by End User
6.2.4.   Market size and forecast, by Country
6.2.5.   U.S.
6.2.5.1.   Market size and forecast, by Product Type
6.2.5.2.   Market size and forecast, by End User
6.2.6.   Canada
6.2.6.1.   Market size and forecast, by Product Type
6.2.6.2.   Market size and forecast, by End User
6.2.7.   Mexico
6.2.7.1.   Market size and forecast, by Type
6.2.7.2.   Market size and forecast, by End User
6.3.   Europe
6.3.1.   Key market trends, growth factors, and opportunities
6.3.2.   Market size and forecast, by Product Type
6.3.3.   Market size and forecast, by End User
6.3.4.   Market size and forecast, by country
6.3.5.   Germany
6.3.5.1.   Market size and forecast, by Product Type
6.3.5.2.   Market size and forecast, by End User
6.3.6.   Spain
6.3.6.1.   Market size and forecast, by Type
6.3.6.2.   Market size and forecast, by End User
6.3.7.   UK
6.3.7.1.   Market size and forecast, by Type
6.3.7.2.   Market size and forecast, by End User
6.3.8.   Italy
6.3.8.1.   Market size and forecast, by Type
6.3.8.2.   Market size and forecast, by End User
6.3.9.   France
6.3.9.1.   Market size and forecast, by Type
6.3.9.2.   Market size and forecast, by End User
6.3.10.   Russia
6.3.10.1.   Market size and forecast, by Type
6.3.10.2.   Market size and forecast, by End User
6.3.11.   Rest of Europe
6.3.11.1.   Market size and forecast, by Type
6.3.11.2.   Market size and forecast, by End User
6.4.   Asia-Pacific
6.4.1.   Key market trends, growth factors, and opportunities
6.4.2.   Market size and forecast, by Type
6.4.3.   Market size and forecast, by End User
6.4.4.   Market size and forecast, by country
6.4.5.   China
6.4.5.1.   Market size and forecast, by Type
6.4.5.2.   Market size and forecast, by End User
6.4.6.   India
6.4.6.1.   Market size and forecast, by Type
6.4.6.2.   Market size and forecast, by End User
6.4.7.   Japan
6.4.7.1.   Market size and forecast, by Type
6.4.7.2.   Market size and forecast, by End User
6.4.8.   Australia
6.4.8.1.   Market size and forecast, by Type
6.4.8.2.   Market size and forecast, by End User
6.4.9.   Rest of Asia-Pacific
6.4.9.1.   Market size and forecast, by Type
6.4.9.2.   Market size and forecast, by Application
6.5.   LAMEA
6.5.1.   Key market trends, growth factors, and opportunities
6.5.2.   Market size and forecast, by Type
6.5.3.   Market size and forecast, by End User
6.5.4.   Market size and forecast, by country
6.5.5.   Latin America
6.5.5.1.   Market size and forecast, by Type
6.5.5.2.   Market size and forecast, by End User
6.5.6.   Middle East
6.5.6.1.   Market size and forecast, by Type
6.5.6.2.   Market size and forecast, by End User
6.5.7.   Africa
6.5.7.1.   Market size and forecast, by Type
6.5.7.2.   Market size and forecast, by End User
CHAPTER 7:Â Â Â COMPANY PROFILES
7.1.   Toshiba
7.1.1.   Company overview
7.1.2.   Company snapshot
7.1.3.   Operating business segments
7.2.   Evoqua Water Technologies
7.2.1.   Company overview
7.2.2.   Company snapshot
7.2.3.   Operating business segments
7.2.4.   Product portfolio
7.2.5.   Key strategic moves and developments
7.3.   UV-Guard Australia
7.3.1.   Company overview
7.3.2.   Company snapshot
7.3.3.   Operating business segments
7.4.   Evonik
7.4.1.   Company overview
7.4.2.   Company snapshot
7.4.3.   Operating business segments
7.5.   Trojan Technologies
7.5.1.   Company overview
7.5.2.   Company snapshot
7.5.3.   Operating business segments
7.5.4.   Product portfolio
7.5.5.   Business performance
7.5.6.   Key strategic moves and developments
7.6.   Entaco
7.6.1.   Company overview
7.6.2.   Company snapshot
7.6.3.   Operating business segments
7.6.4.   Product portfolio
7.7.   Solvay
7.7.1.   Company overview
7.7.2.   Company snapshot
7.7.3.   Operating business segments
7.7.4.   Product portfolio
7.7.5.   Business performance
7.7.6.   Key strategic moves and developments
7.8.   CCL Pentasol
7.8.1.   Company overview
7.8.2.   Company snapshot
7.8.3.   Operating business segments
7.8.4.   Product portfolio
7.8.5.   Business performance
7.9.   Halma
7.9.1.   Company overview
7.9.2.   Company snapshot
7.9.3.   Operating business segments
7.9.4.   Product portfolio
7.9.5.   Key strategic moves and developments
7.10.   Xylem
7.10.1.   Company overview
7.10.2.   Company snapshot
7.10.3.   Operating business segments
7.10.4.   Product portfolio
7.10.5.   Business performance
7.10.6.   Key strategic moves and developments
LIST OF TABLES
TABLE 01.   GLOBAL FOOD AND BEVERAGE DISINFECTION MARKET, BY PRODUCT TYPE, 2017-2025 ($MILLION)
TABLE 02.   CHLORINE COMPOUND FOOD AND BEVERAGE DISINFECTION MARKET, BY REGION, 2017-2025 ($MILLION)
TABLE 03.   HYDROGEN PEROXIDE AND PEROXYACID (PAA) FOOD AND BEVERAGE DISINFECTION MARKET, BY REGION, 2017-2025 ($MILLION)
TABLE 04.   CARBOXYLIC ACID FOOD AND BEVERAGE DISINFECTION MARKET, BY REGION, 2017-2025 ($MILLION)
TABLE 05.   ULTRA VIOLET SYSTEMS FOOD AND BEVERAGE DISINFECTION MARKET, BY REGION, 2017-2025 ($MILLION)
TABLE 06.   OZONE OXIDATION SYSTEMS FOOD AND BEVERAGE DISINFECTION MARKET, BY REGION, 2017-2025 ($MILLION)
TABLE 07.   GLOBAL FOOD AND BEVERAGE DISINFECTION MARKET, BY END USER, 2017-2025 ($MILLION)
TABLE 08.   FOOD PROCESSING COMPANIES FOOD AND BEVERAGE DISINFECTION MARKET, BY REGION, 2017-2025 ($MILLION)
TABLE 09.   BEVERAGE PROCESSING COMPANIES FOOD AND BEVERAGE DISINFECTION MARKET, BY REGION, 2017-2025 ($MILLION)
TABLE 10.   CATERING KITCHENS FOOD AND BEVERAGE DISINFECTION MARKET, BY REGION, 2017-2025 ($MILLION)
TABLE 11.   RETAIL DISTRIBUTORS FOOD AND BEVERAGE DISINFECTION MARKET, BY REGION, 2017-2025 ($MILLION)
TABLE 12.   GLOBAL FOOD AND BEVERAGE DISINFECTION MARKET REVENUE, BY REGION, 2017–2025 ($MILLION)
TABLE 13.   NORTH AMERICA FOOD AND BEVERAGE DISINFECTION MARKET, BY PRODUCT TYPE, 2017–2025 ($MILLION)
TABLE 14.   NORTH AMERICA FOOD AND BEVERAGE DISINFECTION MARKET, BY APPLICATION, 2017–2025 ($MILLION)
TABLE 15.   NORTH AMERICA FOOD AND BEVERAGE DISINFECTION MARKET, BY COUNTRY, 2017–2025 ($MILLION)
TABLE 16.   U.S. FOOD AND BEVERAGE DISINFECTION MARKET, BY PRODUCT TYPE, 2017–2025 ($MILLION)
TABLE 17.   U.S. FOOD AND BEVERAGE DISINFECTION MARKET, BY END USER, 2017–2025 ($MILLION)
TABLE 18.   CANADA. FOOD AND BEVERAGE DISINFECTION MARKET, BY PRODUCT TYPE, 2017–2025 ($MILLION)
TABLE 19.   CANADA. FOOD AND BEVERAGE DISINFECTION MARKET, BY END USER, 2017–2025 ($MILLION)
TABLE 20.   MEXICO. FOOD AND BEVERAGE DISINFECTION MARKET, BY TYPE, 2017–2025 ($MILLION)
TABLE 21.   MEXICO FOOD AND BEVERAGE DISINFECTION MARKET, BY END USER, 2017–2025 ($MILLION)
TABLE 22.   EUROPE FOOD AND BEVERAGE DISINFECTION MARKET, BY PRODUCT TYPE, 2017–2025 ($MILLION)
TABLE 23.   EUROPE FOOD AND BEVERAGE DISINFECTION MARKET, BY END USER, 2017–2025 ($MILLION)
TABLE 24.   EUROPE FOOD AND BEVERAGE DISINFECTION MARKET, BY COUNTRY, 2017–2025 ($MILLION)
TABLE 25.   GERMANY FOOD AND BEVERAGE DISINFECTION MARKET, BY PRODUCT TYPE, 2017–2025 ($MILLION)
TABLE 26.   GERMANY FOOD AND BEVERAGE DISINFECTION MARKET, BY END USER, 2017–2025 ($MILLION)
TABLE 27.   SPAIN FOOD AND BEVERAGE DISINFECTION MARKET, BY TYPE, 2017–2025 ($MILLION)
TABLE 28.   SPAIN FOOD AND BEVERAGE DISINFECTION MARKET, BY END USER, 2017–2025 ($MILLION)
TABLE 29.   UK FOOD AND BEVERAGE DISINFECTION MARKET, BY TYPE, 2017–2025 ($MILLION)
TABLE 30.   UK FOOD AND BEVERAGE DISINFECTION MARKET, BY END USER, 2017–2025 ($MILLION)
TABLE 31.   ITALY FOOD AND BEVERAGE DISINFECTION MARKET, BY TYPE, 2017–2025 ($MILLION)
TABLE 32.   ITALY FOOD AND BEVERAGE DISINFECTION MARKET, BY END USER, 2017–2025 ($MILLION)
TABLE 33.   FRANCE FOOD AND BEVERAGE DISINFECTION MARKET, BY TYPE, 2017–2025 ($MILLION)
TABLE 34.   FRANCE FOOD AND BEVERAGE DISINFECTION MARKET, BY END USER, 2017–2025 ($MILLION)
TABLE 35.   RUSSIA FOOD AND BEVERAGE DISINFECTION MARKET, BY TYPE, 2017–2025 ($MILLION)
TABLE 36.   RUSSIA FOOD AND BEVERAGE DISINFECTION MARKET, BY END USER, 2017–2025 ($MILLION)
TABLE 37.   REST OF EUROPE FOOD AND BEVERAGE DISINFECTION MARKET, BY TYPE, 2017–2025 ($MILLION)
TABLE 38.   REST OF EUROPE FOOD AND BEVERAGE DISINFECTION MARKET, BY END USER, 2017–2025 ($MILLION)
TABLE 39.   ASIA-PACIFIC FOOD AND BEVERAGE DISINFECTION MARKET, BY TYPE, 2017–2025 ($MILLION)
TABLE 40.   ASIA-PACIFIC FOOD AND BEVERAGE DISINFECTION MARKET, BY END USER, 2017–2025 ($MILLION)
TABLE 41.   ASIA-PACIFIC FOOD AND BEVERAGE DISINFECTION MARKET, BY COUNTRY, 2017–2025 ($MILLION)
TABLE 42.   CHINA FOOD AND BEVERAGE DISINFECTION MARKET, BY TYPE, 2017–2025 ($MILLION)
TABLE 43.   CHINA FOOD AND BEVERAGE DISINFECTION MARKET, BY END USER, 2017–2025 ($MILLION)
TABLE 44.   INDIA FOOD AND BEVERAGE DISINFECTION MARKET, BY TYPE, 2017–2025 ($MILLION)
TABLE 45.   INDIA FOOD AND BEVERAGE DISINFECTION MARKET, BY END USER, 2017–2025 ($MILLION)
TABLE 46.   JAPAN FOOD AND BEVERAGE DISINFECTION MARKET, BY TYPE, 2017–2025 ($MILLION)
TABLE 47.   JAPAN FOOD AND BEVERAGE DISINFECTION MARKET, BY END USER, 2017–2025 ($MILLION)
TABLE 48.   AUSTRALIA FOOD AND BEVERAGE DISINFECTION MARKET, BY TYPE, 2017–2025 ($MILLION)
TABLE 49.   AUSTRALIA FOOD AND BEVERAGE DISINFECTION MARKET, BY END USER, 2017–2025 ($MILLION)
TABLE 50.   REST OF ASIA-PACIFIC FOOD AND BEVERAGE DISINFECTION MARKET, BY TYPE, 2017–2025 ($MILLION)
TABLE 51.   REST OF ASIA-PACIFIC FOOD AND BEVERAGE DISINFECTION MARKET, BY APPLICATION, 2017–2025 ($MILLION)
TABLE 52.   LAMEA FOOD AND BEVERAGE DISINFECTION MARKET, BY TYPE, 2017–2025 ($MILLION)
TABLE 53.   LAMEA FOOD AND BEVERAGE DISINFECTION MARKET, BY END USER, 2017–2025 ($MILLION)
TABLE 54.   LAMEA FOOD AND BEVERAGE DISINFECTION MARKET, BY COUNTRY, 2017–2025 ($MILLION)
TABLE 55.   LATIN AMERICA FOOD AND BEVERAGE DISINFECTION MARKET, BY TYPE, 2017–2025 ($MILLION)
TABLE 56.   LATIN AMERICA FOOD AND BEVERAGE DISINFECTION MARKET, BY END USER, 2017–2025 ($MILLION)
TABLE 57.   MIDDLE EAST FOOD AND BEVERAGE DISINFECTION MARKET, BY TYPE, 2017–2025 ($MILLION)
TABLE 58.   MIDDLE EAST FOOD AND BEVERAGE DISINFECTION MARKET, BY END USER, 2017–2025 ($MILLION)
TABLE 59.   SOUTH AFRICA FOOD AND BEVERAGE DISINFECTION MARKET, BY TYPE, 2017–2025 ($MILLION)
TABLE 60.   SOUTH AFRICA FOOD AND BEVERAGE DISINFECTION MARKET, BY END USER, 2017–2025 ($MILLION)
TABLE 61.   TOSHIBA: COMPANY SNAPSHOT
TABLE 62.   TOSHIBA: OPERATING SEGMENTS
TABLE 63.   EVOQUA WATER TECHNOLOGIES: COMPANY SNAPSHOT
TABLE 64.   EVOQUA WATER TECHNOLOGIES: OPERATING SEGMENTS
TABLE 65.   EVOQUA WATER TECHNOLOGIES: PRODUCT PORTFOLIO
TABLE 66.   EVOQUA WATER TECHNOLOGIES: KEY STRATEGIC MOVES AND DEVELOPMENTS
TABLE 67.   UV-GUARD AUSTRALIA: COMPANY SNAPSHOT
TABLE 68.   UV-GUARD AUSTRALIA: OPERATING SEGMENTS
TABLE 69.   EVONIK: COMPANY SNAPSHOT
TABLE 70.   EVONIK: OPERATING SEGMENTS
TABLE 71.   TROJAN TECHNOLOGIES: COMPANY SNAPSHOT
TABLE 72.   TROJAN TECHNOLOGIES: OPERATING SEGMENTS
TABLE 73.   TROJAN TECHNOLOGIES: PRODUCT PORTFOLIO
TABLE 74.   TROJAN TECHNOLOGIES: KEY STRATEGIC MOVES AND DEVELOPMENTS
TABLE 75.   ENTACO: COMPANY SNAPSHOT
TABLE 76.   ENTACO: OPERATING SEGMENTS
TABLE 77.   ENTACO: PRODUCT PORTFOLIO
TABLE 78.   SOLVAY: COMPANY SNAPSHOT
TABLE 79.   SOLVAY: OPERATING SEGMENTS
TABLE 80.   SOLVAY: PRODUCT PORTFOLIO
TABLE 81.   SOLVAY: KEY STRATEGIC MOVES AND DEVELOPMENTS
TABLE 82.   CCL PENTASOL: COMPANY SNAPSHOT
TABLE 83.   CCL PENTASOL: OPERATING SEGMENTS
TABLE 84.   CCL PENTASOL: PRODUCT PORTFOLIO
TABLE 85.   HALMA: COMPANY SNAPSHOT
TABLE 86.   HALMA: OPERATING SEGMENTS
TABLE 87.   HALMA: PRODUCT PORTFOLIO
TABLE 88.   HALMA.: KEY STRATEGIC MOVES AND DEVELOPMENTS
TABLE 89.   XYLEM: COMPANY SNAPSHOT
TABLE 90.   XYLEM: OPERATING SEGMENTS
TABLE 91.   XYLEM: PRODUCT PORTFOLIO
TABLE 92.   XYLEM: KEY STRATEGIC MOVES AND DEVELOPMENTS
LIST OF FIGURES
FIGURE 01.   FOOD AND BEVERAGE DISINFECTION MARKET SNAPSHOT
FIGURE 02.   FOOD AND BEVERAGE DISINFECTION MARKET SEGMENTATION
FIGURE 03.   TOP INVESTMENT POCKET, 2017-2025
FIGURE 04.   LOWER BARGAINING POWER OF SUPPLIERS
FIGURE 05.   HIGH BARGAINING POWER OF BUYERS
FIGURE 06.   MODERATE THREAT OF SUBSTITUTION
FIGURE 07.   HIGHER THREAT OF NEW ENTRANTS
FIGURE 08.   MODERATE INTENSITY OF COMPETITIVE RIVALRY
FIGURE 09.   GLOBAL FOOD AND BEVERAGE DISINFECTION MARKET SHARE, BY TYPE, 2017 (%)
FIGURE 10.   COMPARATIVE SHARE ANALYSIS OF CHLORINE COMPOUND PRODUCTS, BY COUNTRY, 2017 & 2025 (%)
FIGURE 11.   COMPARATIVE SHARE ANALYSIS OF HYDROGEN PEROXIDE AND PEROXYACID (PAA) PRODUCTS, BY COUNTRY, 2017 & 2025 (%)
FIGURE 12.   COMPARATIVE SHARE ANALYSIS OF CARBOXYLIC ACID PRODUCTS, BY COUNTRY, 2017 & 2025 (%)
FIGURE 13.   COMPARATIVE SHARE ANALYSIS OF ULTRA VIOLET SYSTEMS, BY COUNTRY, 2017 & 2025 (%)
FIGURE 14.   COMPARATIVE SHARE ANALYSIS OF OZONE OXIDATION SYSTEMS, BY COUNTRY, 2017 & 2025 (%)
FIGURE 15.   GLOBAL FOOD AND BEVERAGE DISINFECTION MARKET SHARE, BY END USER, 2017 (%)
FIGURE 16.   COMPARATIVE SHARE ANALYSIS OF FOOD PROCESSING COMPANIES, BY COUNTRY, 2017 & 2025 (%)
FIGURE 17.   COMPARATIVE SHARE ANALYSIS OF FOOD & BEVERAGE, BEVERAGE PROCESSING COMPANIES, BY COUNTRY, 2017 & 2025 (%)
FIGURE 18.   COMPARATIVE SHARE ANALYSIS OF CATERING KITCHENS, BY COUNTRY, 2017 & 2025 (%)
FIGURE 19.   COMPARATIVE SHARE ANALYSIS OF RETAIL DISTRIBUTORS, BY COUNTRY, 2017 & 2025 (%)
FIGURE 20.   GLOBAL FOOD AND BEVERAGE DISINFECTION MARKET SHARE, BY REGION, 2017 (%)
FIGURE 21.   U.S. FOOD AND BEVERAGE DISINFECTION MARKET, 2017–2025 ($MILLION)
FIGURE 22.   CANADA FOOD AND BEVERAGE DISINFECTION MARKET, 2017–2025 ($MILLION)
FIGURE 23.   MEXICO FOOD AND BEVERAGE DISINFECTION MARKET, 2017–2025 ($MILLION)
FIGURE 24.   GERMANY FOOD AND BEVERAGE DISINFECTION MARKET, 2017–2025 ($MILLION)
FIGURE 25.   SPAIN FOOD AND BEVERAGE DISINFECTION MARKET, 2017–2025 ($MILLION)
FIGURE 26.   UK FOOD AND BEVERAGE DISINFECTION MARKET, 2017–2025 ($MILLION)
FIGURE 27.   ITALY FOOD AND BEVERAGE DISINFECTION MARKET, 2017–2025 ($MILLION)
FIGURE 28.   FRANCE FOOD AND BEVERAGE DISINFECTION MARKET, 2017–2025 ($MILLION)
FIGURE 29.   RUSSIA FOOD AND BEVERAGE DISINFECTION MARKET, 2017–2025 ($MILLION)
FIGURE 30.   REST OF EUROPE FOOD AND BEVERAGE DISINFECTION MARKET, 2017–2025 ($MILLION)
FIGURE 31.   CHINA FOOD AND BEVERAGE DISINFECTION MARKET, 2017–2025 ($MILLION)
FIGURE 32.   INDIA FOOD AND BEVERAGE DISINFECTION MARKET, 2017–2025 ($MILLION)
FIGURE 33.   JAPAN FOOD AND BEVERAGE DISINFECTION MARKET, 2017–2025 ($MILLION)
FIGURE 34.   AUSTRALIA FOOD AND BEVERAGE DISINFECTION MARKET, 2017–2025 ($MILLION)
FIGURE 35.   REST OF ASIA-PACIFIC FOOD AND BEVERAGE DISINFECTION MARKET, 2017–2025 ($MILLION)
FIGURE 36.   LATIN AMERICA FOOD AND BEVERAGE DISINFECTION MARKET, 2017–2025 ($MILLION)
FIGURE 37.   MIDDLE EAST FOOD AND BEVERAGE DISINFECTION MARKET, 2017–2025 ($MILLION)
FIGURE 38.   AFRICA FOOD AND BEVERAGE DISINFECTION MARKET, 2017–2025 ($MILLION)
FIGURE 39.   TROJAN TECHNOLOGIES: REVENUE, 2016–2018 ($MILLION)
FIGURE 40.   TROJAN TECHNOLOGIES: REVENUE SHARE BY REGION, 2018 (%)
FIGURE 41.   SOLVAY: REVENUE, 2015–2017 ($MILLION)
FIGURE 42.   SOLVAY: REVENUE SHARE BY SEGMENT, 2017 (%)
FIGURE 43.   SOLVAY: REVENUE SHARE BY REGION, 2017 (%)
FIGURE 44.   CCL PENTASOL: REVENUE, 2016–2018 ($MILLION)
FIGURE 45.   CCL PENTASOL: REVENUE SHARE BY SEGMENT, 2018 (%)
FIGURE 46.   CCL PENTASOL: REVENUE SHARE BY REGION, 2018 (%)
FIGURE 47.   XYLEM : REVENUE, 2015–2017 ($MILLION)
Stringent regulatory guidelines for the use of chemical disinfectants at food premises enable suppliers to cater with novel product line of chemical disinfectants. Manufacturers/suppliers of disinfectants are targeting retail food courts/small scale food and beverage processing plants through their strong distribution network. However, lower profit margins and predominant position of existing competitors limit the revenue growth of local suppliers in the chemical food disinfectants market
Adoption of food disinfectant equipment is expected to gain traction in large scale food processing companies. The manufactures of UV disinfection systems and ozone oxidation systems are currently focusing on large scale food and beverage processing industry. However, commercialization of portable UV disinfectant systems in food and beverage disinfection is expected to boost the market growth during the forecast period.
Start reading instantly.
This Report and over 67,404+ more Reports, Available with Avenue Library. T&C*.
Enterprise
License/PDF
Library
Membership
*Taxes/Fees, if applicable will be added during checkout. All prices in USD
To ensure high-level data integrity, accurate analysis, and impeccable forecasts
For complete satisfaction
On-demand customization of scope of the report to exactly meet your needs
Targeted market view to provide pertinent information and save time of readers
Get insights on topics that are crucial for your business. Stay abreast of your interest areas.
Get Industry Data AlertsTo ensure high-level data integrity, accurate analysis, and impeccable forecasts
For complete satisfaction
On-demand customization of scope of the report to exactly meet your needs
Targeted market view to provide pertinent information and save time of readers