Report Code: A01704 | Apr 2017 | Pages: 220 | ||
Tables: 134 | Charts: 28 |
|
Pandemic disrupted the entire world and affected many industries.
Get detailed COVID-19 impact analysis on the Food Stabilizer Market
Request Now !Global Food Stabilizer Market size was valued at $7,580 million in 2016, and is anticipated to grow at a CAGR of 4.1% to reach $10,100 million during 2017 to 2023. Food stabilizers are substances or chemicals that allow unblended food ingredients to remain homogenous. It maintains the physio-chemical state of a foodstuff to ensure homogeneous dispersion. It helps to retain the color, shape, texture, consistency, and stability of food products. The benefits have increased the use of food stabilizers, in a wide range of food products such as, bakery, confectionery, dairy product, beverage & convenience food, sauce, and others. Pectin, carrageenan, gelatin, agar-agar, and calcium chloride are some of the commonly used stabilizers used in food products. Presently, the use of food stabilizers has increased in the recent years, owing to the emergence of convenience food & organic food and influence of westernized food habits. The market is driven by rise in disposable income, growth in the convenience food sector, and increased demand for food stabilizers in the dairy & confectionery industry. However, limitations on the usage of certain stabilizer blends, stringent government regulations on usage & quantity, and consumer preference for fresh food hamper the market growth.
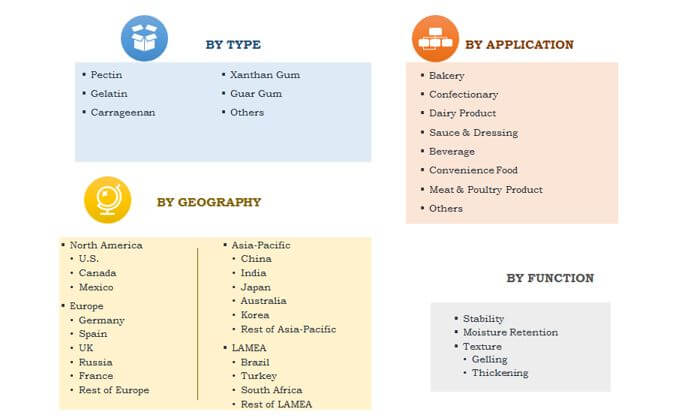
The report emphasizes on the different types of food stabilizers, which include pectin, gelatin, carrageenan, xanthan gum, guar gum, and others. Based on function, the market is classified into stability, texture, and moisture retention. On the basis of application, it is categorized into bakery, confectionery, dairy product, sauce & dressing, beverage & convenience food, meat & poultry product, and others. Geographically, it is analyzed across North America, Europe, Asia-Pacific, and LAMEA. In addition, the report highlights various factors that impact the growth of the global market, such as key drivers, restraints, growth opportunities, as well as the role of different key players. It presents the quantitative data, in terms of both value and volume, which have been obtained from the secondary sources such as company publications, Factiva, Hoovers, OneSource, and others.
Global Food Stabilizer Market Segmentation
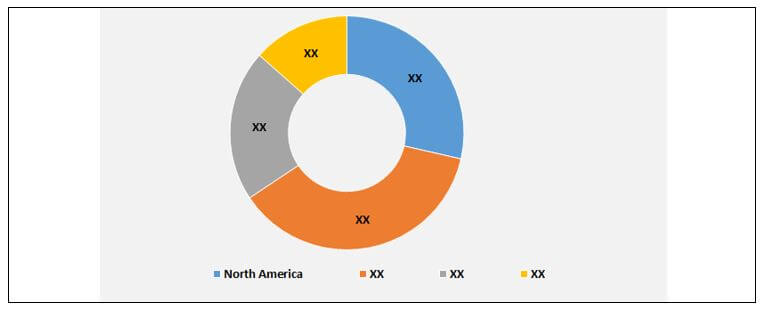
Europe dominates the global food stabilizer market, in terms of both value and volume. However, Asia-Pacific is expected to witness the highest growth rate during 2017-2023, owing to increase in population, rise in disposable income, reforms in food preferences, and increase in demand for convenience food.
Food Stabilizer Market Share,By Geography, 2016 (%)
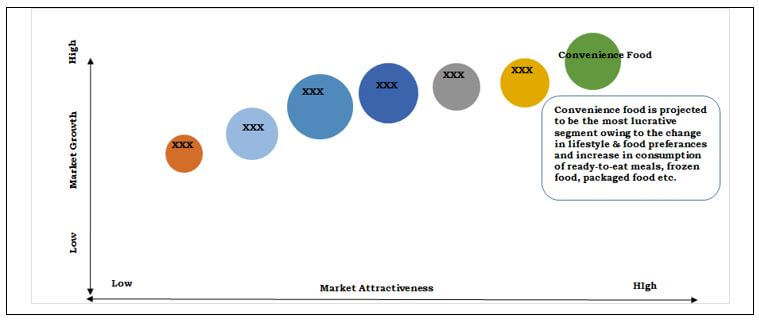
Food Stabilizer Market Top Investment Pockets
The convenience food segment is the most lucrative in the market, followed by sauces & dressings. There is an increase in acceptance among consumers for convenient food, such as ready-to-eat meals, frozen meals, packaged food, and commercialized fruit juices. Furthermore, change in lifestyle and food preferences are expected to increase the demand for convenience food in near future.
Top Investment Pocket
Europe Food Stabilizer Market Size
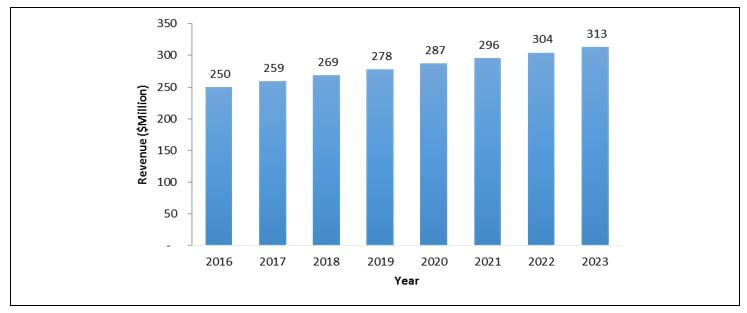
Europe witnessed the highest demand for food stabilizer, owing to the support of European Food Safety Authority and other government agencies for the approval of safe food additives & stabilizers. Germany dominated the Europe food stabilizer market in 2016, in terms of both value and volume.
Germany Food Stabilizer Market Growth, 2016-2023 ($Million)
The key players profiled in the report are Glanbia Nutritionals, E. I. DuPont de Nemours and Company, Kerry Inc., Cargill, Inc., Ashland Inc., Associated British Foods Plc., Koninklijke DSM N.V., Chemelco International B.V., Archer Daniels Midland Company, and Advanced food systems.
The other major players (not profiled in report) in the market include Palsgaard, Tate & Lyle, Celanese Corporation, Chr. Hansen A/S, and Nexira, Eurogum A/S, Unipektin Ingredients AG, Holton Food Products, Deosen Biochemical Ltd., and Naturex SA.
Key Market Benefits
Food Stabilizer Market Report Highlights
Aspects | Details |
---|---|
By Type |
|
By Functions |
|
By Application |
|
By Geography |
|
Key Market Players | KERRY INC., ARCHER DANIELS MIDLAND COMPANY, GLANBIA NUTRITIONALS, ADVANCED FOOD SYSTEMS, ASHLAND INC., CHEMELCO INTERNATIONAL B.V., CARGILL, INC., E. I. DUPONT DE NEMOURS AND COMPANY, KONINKLIJKE DSM N.V., ASSOCIATED BRITISH FOODS PLC. |
CHAPTER 1. INTRODUCTION
1.1. REPORT DESCRIPTION
1.2. KEY BENEFITS
1.3. KEY MARKET SEGMENT
1.4. RESEARCH METHODOLOGY
1.4.1. Secondary research
1.4.2. Primary research
1.4.3. Analyst tool & model
CHAPTER 2. EXECUTIVE SUMMARY
2.1. MARKET SNAPSHOT
2.2. CXO PERSPECTIVES
CHAPTER 3. MARKET OVERVIEW
3.1. MARKET DEFINITION AND SCOPE
3.2. KEY FINDINGS
3.2.1. Top investment pockets
3.2.2. Top winning strategies
3.3. PORTERS FIVE FORCES ANALYSIS
3.4. MARKET DYNAMICS
3.4.1. Drivers
3.4.1.1. Emergence of convenience food
3.4.1.2. Influence of modernize food consumption pattern
3.4.1.3. Rising disposable income
3.4.2. Restraints
3.4.2.1. Consumer preference for fresh food
3.4.2.2. Stringent government regulations on usage & quantity
3.4.3. Opportunities
3.4.3.1. Increasing demand for food stabilizer in dairy products
3.5. MARKET SHARE ANALYSIS, 2016 (%)
CHAPTER 4. GLOBAL FOOD STABILIZER MARKET, BY TYPE
4.1. INTRODUCTION
4.1.1. Market size and forecast
4.2. PECTIN
4.2.1. Key market trends, growth factors, and opportunities
4.2.2. Market size and forecast
4.3. GELATIN
4.3.1. Key market trends, growth factors, and opportunities
4.3.2. Market size and forecast
4.4. CARRAGEENAN
4.4.1. Key market trends, growth factors, and opportunities
4.4.2. Market size and forecast
4.5. XANTHAN GUM
4.5.1. Key market trends, growth factors, and opportunities
4.5.2. Market size and forecast
4.6. GUAR GUM
4.6.1. Key market trends, growth factors, and opportunities
4.6.2. Market size and forecast
4.7. OTHERS
4.7.1. Key market trends, growth factors, and opportunities
4.7.2. Market size and forecast
CHAPTER 5. GLOBAL FOOD STABILIZER MARKET, BY FUNCTION
5.1. INTRODUCTION
5.1.1. Market size and forecast
5.2. STABILITY
5.2.1. Key market trends, growth factors, and opportunities
5.2.2. Market size and forecast
5.3. TEXTURE
5.3.1. Gelling
5.3.2. Thickening
5.3.3. Key market trends, growth factors, and opportunities
5.3.4. Market size and forecast
5.4. MOISTURE RETENTION
5.4.1. Key market trends, growth factors, and opportunities
5.4.2. Market size and forecast
CHAPTER 6. GLOBAL FOOD STABILIZER MARKET, BY APPLICATION
6.1. INTRODUCTION
6.1.1. Market size and forecast
6.2. BAKERY
6.2.1. Key market trends, growth factors, and opportunities
6.2.2. Market size and forecast
6.3. CONFECTIONERY
6.3.1. Key market trends, growth factors, and opportunities
6.3.2. Market size and forecast
6.4. DAIRY PRODUCTS
6.4.1. Key market trends, growth factors, and opportunities
6.4.2. Market size and forecast
6.5. SAUCES & DRESSINGS
6.5.1. Key market trends, growth factors, and opportunities
6.5.2. Market size and forecast
6.6. BEVERAGES & CONVENIENCE FOOD
6.6.1. Key market trends, growth factors, and opportunities
6.6.2. Market size and forecast
6.7. MEAT & POULTRY PRODUCTS
6.7.1. Key market trends, growth factors, and opportunities
6.7.2. Market size and forecast
6.8. OTHERS
6.8.1. Key market trends, growth factors, and opportunities
6.8.2. Market size and forecast
CHAPTER 7. GLOBAL FOOD STABILIZER MARKET, BY GEOGRAPHY
7.1. INTRODUCTION
7.1.1. Market size and forecast
7.2. NORTH AMERICA
7.2.1. Key market trends, growth factors, and opportunities
7.2.2. Market size and forecast
7.2.3. U.S.
7.2.3.1. Market size and forecast, by application
7.2.4. Canada
7.2.4.1. Market size and forecast, by application
7.2.5. Mexico
7.2.5.1. Market size and forecast, by application
7.3. EUROPE
7.3.1. Key market trends, growth factors, and opportunities
7.3.2. Market size and forecast
7.3.3. Germany
7.3.3.1. Market size and forecast, by application
7.3.4. Spain
7.3.4.1. Market size and forecast, by application
7.3.5. UK
7.3.5.1. Market size and forecast, by application
7.3.6. Russia
7.3.6.1. Market size and forecast, by application
7.3.7. France
7.3.7.1. Market size and forecast, by application
7.3.8. Rest of Europe
7.3.8.1. Market size and forecast, by application
7.4. ASIA-PACIFIC
7.4.1. Key market trends, growth factors, and opportunities
7.4.2. Market size and forecast
7.4.3. China
7.4.3.1. Market size and forecast, by application
7.4.4. India
7.4.4.1. Market size and forecast, by application
7.4.5. Japan
7.4.5.1. Market size and forecast, by application
7.4.6. Australia
7.4.6.1. Market size and forecast, by application
7.4.7. Korea
7.4.7.1. Market size and forecast, by application
7.4.8. Rest of Asia-Pacific
7.4.8.1. Market size and forecast, by application
7.5. LAMEA
7.5.1. Key market trends, growth factors, and opportunities
7.5.2. Market size and forecast
7.5.3. Brazil
7.5.3.1. Market size and forecast, by application
7.5.4. Turkey
7.5.4.1. Market size and forecast, by application
7.5.5. South Africa
7.5.5.1. Market size and forecast, by application
7.5.6. Rest of LAMEA
7.5.6.1. Market size and forecast, by application
CHAPTER 8. COMPANY PROFILES
8.1. GLANBIA NUTRITIONALS
8.1.1. Company overview
8.1.2. Company snapshot
8.1.3. Operating business segments
8.1.4. Business performance
8.1.5. Key strategic moves and developments
8.2. E. I. DUPONT DE NEMOURS AND COMPANY
8.2.1. Company overview
8.2.2. Company snapshot
8.2.3. Operating business segments
8.2.4. Business performance
8.2.5. Key strategic moves and developments
8.3. KERRY INC.
8.3.1. Company overview
8.3.2. Company snapshot
8.3.3. Operating business segments
8.3.4. Business performance
8.3.5. Key strategic moves and developments
8.4. CARGILL, INC.
8.4.1. Company overview
8.4.2. Company snapshot
8.4.3. Operating business segments
8.4.4. Business performance
8.4.5. Key strategic moves and developments
8.5. ASHLAND INC.
8.5.1. Company overview
8.5.2. Company snapshot
8.5.3. Operating business segments
8.5.4. Business performance
8.5.5. Key strategic moves and developments
8.6. ASSOCIATED BRITISH FOODS PLC.
8.6.1. Company overview
8.6.2. Company snapshot
8.6.3. Operating business segments
8.6.4. Business performance
8.6.5. Key strategic moves and developments
8.7. KONINKLIJKE DSM N.V.
8.7.1. Company overview
8.7.2. Company snapshot
8.7.3. Operating business segments
8.7.4. Business performance
8.7.5. Key strategic moves and developments
8.8. CHEMELCO INTERNATIONAL B.V.
8.8.1. Company overview
8.8.2. Company snapshot
8.8.3. Operating business segments
8.8.4. Business performance
8.8.5. Key strategic moves and developments
8.9. ARCHER DANIELS MIDLAND COMPANY
8.9.1. Company overview
8.9.2. Company snapshot
8.9.3. Operating business segments
8.9.4. Business performance
8.9.5. Key strategic moves and developments
8.10. ADVANCED FOOD SYSTEMS
8.10.1. Company overview
8.10.2. Company snapshot
8.10.3. Operating business segments
8.10.4. Business performance
8.10.5. Key strategic moves and developments
List of Tables
TABLE 1. GLOBAL FOOD STABILIZER MARKET VALUE, BY TYPE, 2015-2023 ($MILLION)
TABLE 2. GLOBAL FOOD STABILIZER MARKET VOLUME, BY TYPE, 2015-2023 (KILOTONS)
TABLE 3. GLOBAL PECTIN FOOD STABILIZER MARKET VALUE, BY REGION, 2015-2023 ($MILLION)
TABLE 4. GLOBAL PECTIN FOOD STABILIZER MARKET VOLUME, BY REGION, 2015-2023 (KILOTONS)
TABLE 5. GLOBAL GELATIN FOOD STABILIZER MARKET VALUE, BY REGION, 2015-2023 ($MILLION)
TABLE 6. GLOBAL GELATIN FOOD STABILIZER MARKET VOLUME, BY REGION, 2015-2023 (KILOTONS)
TABLE 7. GLOBAL CARRAGEENAN FOOD STABILIZER MARKET VALUE, BY REGION, 2015-2023 ($MILLION)
TABLE 8. GLOBAL CARRAGEENAN FOOD STABILIZER MARKET VOLUME, BY REGION, 2015-2023 (KILOTONS)
TABLE 9. GLOBAL XANTHAN GUM FOOD STABILIZER MARKET VALUE, BY REGION, 2015-2023 ($MILLION)
TABLE 10. GLOBAL XANTHAN GUM FOOD STABILIZER MARKET VOLUME, BY REGION, 2015-2023 (KILOTONS)
TABLE 11. GLOBAL GUAR GUM FOOD STABILIZER MARKET VALUE, BY REGION, 2015-2023 ($MILLION)
TABLE 12. GLOBAL GUAR GUM FOOD STABILIZER MARKET VOLUME, BY REGION, 2015-2023 (KILOTONS)
TABLE 13. GLOBAL OTHERS FOOD STABILIZER MARKET VALUE, BY REGION, 2015-2023 ($MILLION)
TABLE 14. GLOBAL OTHERS FOOD STABILIZER MARKET VOLUME, BY REGION, 2015-2023 (KILOTONS)
TABLE 15. GLOBAL FOOD STABILIZER MARKET VALUE, BY FUNCTION, 2015-2023 ($MILLION)
TABLE 16. GLOBAL FOOD STABILIZER MARKET VOLUME, BY FUNCTION, 2015-2023 (KILOTONS)
TABLE 17. GLOBAL STABILITY FOOD STABILIZER MARKET VALUE, BY REGION, 2015-2023 ($MILLION)
TABLE 18. GLOBAL STABILITY FOOD STABILIZER MARKET VOLUME, BY REGION, 2015-2023 (KILOTONS)
TABLE 19. GLOBAL TEXTURE FOOD STABILIZER MARKET VALUE, BY REGION, 2015-2023 ($MILLION)
TABLE 20. GLOBAL TEXTURE FOOD STABILIZER MARKET VOLUME, BY REGION, 2015-2023 (KILOTONS)
TABLE 21. GLOBAL GELLING FOOD STABILIZER MARKET VALUE, BY REGION, 2015-2023 ($MILLION)
TABLE 22. GLOBAL GELLING FOOD STABILIZER MARKET VOLUME, BY REGION, 2015-2023 (KILOTONS)
TABLE 23. GLOBAL THICKENING FOOD STABILIZER MARKET VALUE, BY REGION, 2015-2023 ($MILLION)
TABLE 24. GLOBAL THICKENING FOOD STABILIZER MARKET VOLUME, BY REGION, 2015-2023 (KILOTONS)
TABLE 25. GLOBAL MOISTURE RETENTION FOOD STABILIZER MARKET VALUE, BY REGION, 2015-2023 ($MILLION)
TABLE 26. GLOBAL MOISTURE RETENTION FOOD STABILIZER MARKET VOLUME, BY REGION, 2015-2023 (KILOTONS)
TABLE 27. GLOBAL FOOD STABILIZER MARKET VALUE, BY APPLICATION, 2015-2023 ($MILLION)
TABLE 28. GLOBAL FOOD STABILIZER MARKET VOLUME, BY APPLICATION, 2015-2023 (KILOTONS)
TABLE 29. GLOBAL FOOD STABILIZER IN BAKERY MARKET VALUE, BY REGION, 2015-2023 ($MILLION)
TABLE 30. GLOBAL FOOD STABILIZER IN BAKERY MARKET VOLUME, BY REGION, 2015-2023 (KILOTONS)
TABLE 31. GLOBAL FOOD STABILIZER IN CONFECTIONERY MARKET VALUE, BY REGION, 2015-2023 ($MILLION)
TABLE 32. GLOBAL FOOD STABILIZER IN CONFECTIONERY MARKET VOLUME, BY REGION, 2015-2023 (KILOTONS)
TABLE 33. GLOBAL FOOD STABILIZER IN DAIRY PRODUCTS MARKET VALUE, BY REGION, 2015-2023 ($MILLION)
TABLE 34. GLOBAL FOOD STABILIZER IN DAIRY PRODUCTS MARKET VOLUME, BY REGION, 2015-2023 (KILOTONS)
TABLE 35. GLOBAL FOOD STABILIZER IN SAUCES & DRESSINGS MARKET VALUE, BY REGION, 2015-2023 ($MILLION)
TABLE 36. GLOBAL FOOD STABILIZER IN SAUCES & DRESSINGS MARKET VOLUME, BY REGION, 2015-2023 (KILOTONS)
TABLE 37. GLOBAL FOOD STABILIZER IN BEVERAGES & CONVENIENCE FOOD MARKET VALUE, BY REGION, 2015-2023 ($MILLION)
TABLE 38. GLOBAL FOOD STABILIZER IN BEVERAGES & CONVENIENCE FOOD MARKET VOLUME, BY REGION, 2015-2023 (KILOTONS)
TABLE 39. GLOBAL FOOD STABILIZER IN MEAT & POULTRY PRODUCTS MARKET VALUE, BY REGION, 2015-2023 ($MILLION)
TABLE 40. GLOBAL FOOD STABILIZER IN MEAT & POULTRY PRODUCTS MARKET VOLUME, BY REGION, 2015-2023 (KILOTONS)
TABLE 41. GLOBAL FOOD STABILIZER IN OTHERS MARKET VALUE, BY REGION, 2015-2023 ($MILLION)
TABLE 42. GLOBAL FOOD STABILIZER IN OTHERS MARKET VOLUME, BY REGION, 2015-2023 (KILOTONS)
TABLE 43. GLOBAL FOOD STABILIZER MARKET VALUE, BY REGION, 2015-2023 ($MILLION)
TABLE 44. GLOBAL FOOD STABILIZER MARKET VOLUME, BY REGION, 2015-2023 (KILOTONS)
TABLE 45. NORTH AMERICA FOOD STABILIZER MARKET VALUE, BY TYPE, 2015-2023 ($MILLION)
TABLE 46. NORTH AMERICA FOOD STABILIZER MARKET VOLUME, BY TYPE, 2015-2023 (KILOTONS)
TABLE 47. NORTH AMERICA FOOD STABILIZER MARKET VALUE, BY FUNCTION, 2015-2023 ($MILLION)
TABLE 48. NORTH AMERICA FOOD STABILIZER MARKET VOLUME, BY FUNCTION, 2015-2023 (KILOTONS)
TABLE 49. NORTH AMERICA FOOD STABILIZER MARKET VALUE, BY APPLICATION, 2015-2023 ($MILLION)
TABLE 50. NORTH AMERICA FOOD STABILIZER MARKET VOLUME, BY APPLICATION, 2015-2023 (KILOTONS)
TABLE 51. NORTH AMERICA FOOD STABILIZER MARKET VALUE, BY COUNTRY, 2015-2023 ($MILLION)
TABLE 52. NORTH AMERICA FOOD STABILIZER MARKET VOLUME, BY COUNTRY, 2015-2023 (KILOTONS)
TABLE 53. U.S. FOOD STABILIZER MARKET VALUE, BY APPLICATION, 2015-2023 ($MILLION)
TABLE 54. U.S. FOOD STABILIZER MARKET VOLUME, BY APPLICATION, 2015-2023 (KILOTONS)
TABLE 55. CANADA FOOD STABILIZER MARKET VALUE, BY APPLICATION, 2015-2023 ($MILLION)
TABLE 56. CANADA FOOD STABILIZER MARKET VOLUME, BY APPLICATION, 2015-2023 (KILOTONS)
TABLE 57. MEXICO FOOD STABILIZER MARKET VALUE, BY APPLICATION, 2015-2023 ($MILLION)
TABLE 58. MEXICO FOOD STABILIZER MARKET VOLUME, BY APPLICATION, 2015-2023 (KILOTONS)
TABLE 59. EUROPE FOOD STABILIZER MARKET VALUE, BY TYPE, 2015-2023 ($MILLION)
TABLE 60. EUROPE FOOD STABILIZER MARKET VOLUME, BY TYPE, 2015-2023 (KILOTONS)
TABLE 61. EUROPE FOOD STABILIZER MARKET VALUE, BY FUNCTION, 2015-2023 ($MILLION)
TABLE 62. EUROPE FOOD STABILIZER MARKET VOLUME, BY FUNCTION, 2015-2023 (KILOTONS)
TABLE 63. EUROPE FOOD STABILIZER MARKET VALUE, BY APPLICATION, 2015-2023 ($MILLION)
TABLE 64. EUROPE FOOD STABILIZER MARKET VOLUME, BY APPLICATION, 2015-2023 (KILOTONS)
TABLE 65. EUROPE FOOD STABILIZER MARKET VALUE, BY COUNTRY, 2015-2023 ($MILLION)
TABLE 66. EUROPE FOOD STABILIZER MARKET VOLUME, BY COUNTRY, 2015-2023 (KILOTONS)
TABLE 67. GERMANY FOOD STABILIZER MARKET VALUE, BY APPLICATION, 2015-2023 ($MILLION)
TABLE 68. GERMANY FOOD STABILIZER MARKET VOLUME, BY APPLICATION, 2015-2023 (KILOTONS)
TABLE 69. SPAIN FOOD STABILIZER MARKET VALUE, BY APPLICATION, 2015-2023 ($MILLION)
TABLE 70. SPAIN FOOD STABILIZER MARKET VOLUME, BY APPLICATION, 2015-2023 (KILOTONS)
TABLE 71. UK FOOD STABILIZER MARKET VALUE, BY APPLICATION, 2015-2023 ($MILLION)
TABLE 72. UK FOOD STABILIZER MARKET VOLUME, BY APPLICATION, 2015-2023 (KILOTONS)
TABLE 73. RUSSIA FOOD STABILIZER MARKET VALUE, BY APPLICATION, 2015-2023 ($MILLION)
TABLE 74. RUSSIA FOOD STABILIZER MARKET VOLUME, BY APPLICATION, 2015-2023 (KILOTONS)
TABLE 75. FRANCE FOOD STABILIZER MARKET VALUE, BY APPLICATION, 2015-2023 ($MILLION)
TABLE 76. FRANCE FOOD STABILIZER MARKET VOLUME, BY APPLICATION, 2015-2023 (KILOTONS)
TABLE 77. REST OF EUROPE FOOD STABILIZER MARKET VALUE, BY APPLICATION, 2015-2023 ($MILLION)
TABLE 78. REST OF EUROPE FOOD STABILIZER MARKET VOLUME, BY APPLICATION, 2015-2023 (KILOTONS)
TABLE 79. ASIA-PACIFIC FOOD STABILIZER MARKET VALUE, BY TYPE, 2015-2023 ($MILLION)
TABLE 80. ASIA-PACIFIC FOOD STABILIZER MARKET VOLUME, BY TYPE, 2015-2023 (KILOTONS)
TABLE 81. ASIA-PACIFIC FOOD STABILIZER MARKET VALUE, BY FUNCTION, 2015-2023 ($MILLION)
TABLE 82. ASIA-PACIFIC FOOD STABILIZER MARKET VOLUME, BY FUNCTION, 2015-2023 (KILOTONS)
TABLE 83. ASIA-PACIFIC FOOD STABILIZER MARKET VALUE, BY APPLICATION, 2015-2023 ($MILLION)
TABLE 84. ASIA-PACIFIC FOOD STABILIZER MARKET VOLUME, BY APPLICATION, 2015-2023 (KILOTONS)
TABLE 85. ASIA-PACIFIC FOOD STABILIZER MARKET VALUE, BY COUNTRY, 2015-2023 ($MILLION)
TABLE 86. ASIA-PACIFIC FOOD STABILIZER MARKET VOLUME, BY COUNTRY, 2015-2023 (KILOTONS)
TABLE 87. CHINA FOOD STABILIZER MARKET VALUE, BY APPLICATION, 2015-2023 ($MILLION)
TABLE 88. CHINA FOOD STABILIZER MARKET VOLUME, BY APPLICATION, 2015-2023 (KILOTONS)
TABLE 89. INDIA FOOD STABILIZER MARKET VALUE, BY APPLICATION, 2015-2023 ($MILLION)
TABLE 90. INDIA FOOD STABILIZER MARKET VOLUME, BY APPLICATION, 2015-2023 (KILOTONS)
TABLE 91. JAPAN FOOD STABILIZER MARKET VALUE, BY APPLICATION, 2015-2023 ($MILLION)
TABLE 92. JAPAN FOOD STABILIZER MARKET VOLUME, BY APPLICATION, 2015-2023 (KILOTONS)
TABLE 93. AUSTRALIA FOOD STABILIZER MARKET VALUE, BY APPLICATION, 2015-2023 ($MILLION)
TABLE 94. AUSTRALIA FOOD STABILIZER MARKET VOLUME, BY APPLICATION, 2015-2023 (KILOTONS)
TABLE 95. KOREA FOOD STABILIZER MARKET VALUE, BY APPLICATION, 2015-2023 ($MILLION)
TABLE 96. KOREA FOOD STABILIZER MARKET VOLUME, BY APPLICATION, 2015-2023 (KILOTONS)
TABLE 97. REST OF ASIA-PACIFIC FOOD STABILIZER MARKET VALUE, BY APPLICATION, 2015-2023 ($MILLION)
TABLE 98. REST OF ASIA-PACIFIC FOOD STABILIZER MARKET VOLUME, BY APPLICATION, 2015-2023 (KILOTONS)
TABLE 99. LAMEA FOOD STABILIZER MARKET VALUE, BY TYPE, 2015-2023 ($MILLION)
TABLE 100. LAMEA FOOD STABILIZER MARKET VOLUME, BY TYPE, 2015-2023 (KILOTONS)
TABLE 101. LAMEA FOOD STABILIZER MARKET VALUE, BY FUNCTION, 2015-2023 ($MILLION)
TABLE 102. LAMEA FOOD STABILIZER MARKET VOLUME, BY FUNCTION, 2015-2023 (KILOTONS)
TABLE 103. LAMEA FOOD STABILIZER MARKET VALUE, BY APPLICATION, 2015-2023 ($MILLION)
TABLE 104. LAMEA FOOD STABILIZER MARKET VOLUME, BY APPLICATION, 2015-2023 (KILOTONS)
TABLE 105. LAMEA FOOD STABILIZER MARKET VALUE, BY COUNTRY, 2015-2023 ($MILLION)
TABLE 106. LAMEA FOOD STABILIZER MARKET VOLUME, BY COUNTRY, 2015-2023 (KILOTONS)
TABLE 107. BRAZIL FOOD STABILIZER MARKET VALUE, BY APPLICATION, 2015-2023 ($MILLION)
TABLE 108. BRAZIL FOOD STABILIZER MARKET VOLUME, BY APPLICATION, 2015-2023 (KILOTONS)
TABLE 109. TURKEY FOOD STABILIZER MARKET VALUE, BY APPLICATION, 2015-2023 ($MILLION)
TABLE 110. TURKEY FOOD STABILIZER MARKET VOLUME, BY APPLICATION, 2015-2023 (KILOTONS)
TABLE 111. SOUTH AFRICA FOOD STABILIZER MARKET VALUE, BY APPLICATION, 2015-2023 ($MILLION)
TABLE 112. SOUTH AFRICA FOOD STABILIZER MARKET VOLUME, BY APPLICATION, 2015-2023 (KILOTONS)
TABLE 113. REST OF LAMEA FOOD STABILIZER MARKET VALUE, BY APPLICATION, 2015-2023 ($MILLION)
TABLE 114. REST OF LAMEA FOOD STABILIZER MARKET VOLUME, BY APPLICATION, 2015-2023 (KILOTONS)
TABLE 115. GLANBIA NUTRITIONALS: COMPANY SNAPSHOT
TABLE 116. GLANBIA NUTRITIONALS: OPERATING SEGMENTS
TABLE 117. E. I. DUPONT DE NEMOURS AND COMPANY: COMPANY SNAPSHOT
TABLE 118. E. I. DUPONT DE NEMOURS AND COMPANY: OPERATING SEGMENTS
TABLE 119. KERRY INC.: COMPANY SNAPSHOT
TABLE 120. KERRY INC.: OPERATING SEGMENTS
TABLE 121. CARGILL, INC.: COMPANY SNAPSHOT
TABLE 122. CARGILL, INC.: OPERATING SEGMENTS
TABLE 123. ASHLAND INC.: COMPANY SNAPSHOT
TABLE 124. ASHLAND INC.: OPERATING SEGMENTS
TABLE 125. ASSOCIATED BRITISH FOODS PLC.: COMPANY SNAPSHOT
TABLE 126. ASSOCIATED BRITISH FOODS PLC.: OPERATING SEGMENTS
TABLE 127. KONINKLIJKE DSM N.V.: COMPANY SNAPSHOT
TABLE 128. KONINKLIJKE DSM N.V.: OPERATING SEGMENTS
TABLE 129. CHEMELCO INTERNATIONAL B.V.: COMPANY SNAPSHOT
TABLE 130. CHEMELCO INTERNATIONAL B.V.: OPERATING SEGMENTS
TABLE 131. ARCHER DANIELS MIDLAND COMPANY: COMPANY SNAPSHOT
TABLE 132. ARCHER DANIELS MIDLAND COMPANY: OPERATING SEGMENTS
TABLE 133. ADVANCED FOOD SYSTEMS: COMPANY SNAPSHOT
TABLE 134. ADVANCED FOOD SYSTEMS: OPERATING SEGMENTS
List of Figures
FIGURE 1. GLOBAL FOOD STABILIZER MARKET: SEGMENTATION
FIGURE 2. GLOBAL FOOD STABILIZER MARKET SHARE, BY TYPE, 2016 (%)
FIGURE 3. TOP INVESTMENT POCKETS, BY APPLICATION
FIGURE 4. TOP WINNING STRATEGIES
FIGURE 5. BARGAINING POWER OF SUPPLIERS
FIGURE 6. BARGAINING POWER OF BUYERS
FIGURE 7. THREAT OF NEW ENTRANTS
FIGURE 8. THREAT OF SUBSTITUTES
FIGURE 9. COMPETITIVE RIVALRY
FIGURE 10. U.S. FOOD STABILIZER MARKET VALUE, 2015-2023 ($MILLION)
FIGURE 11. CANADA FOOD STABILIZER MARKET VALUE, 2015-2023 ($MILLION)
FIGURE 12. MEXICO FOOD STABILIZER MARKET VALUE, 2015-2023 ($MILLION)
FIGURE 13. GERMANY FOOD STABILIZER MARKET VALUE, 2015-2023 ($MILLION)
FIGURE 14. SPAIN FOOD STABILIZER MARKET VALUE, 2015-2023 ($MILLION)
FIGURE 15. UK FOOD STABILIZER MARKET VALUE, 2015-2023 ($MILLION)
FIGURE 16. RUSSIA FOOD STABILIZER MARKET VALUE, 2015-2023 ($MILLION)
FIGURE 17. FRANCE FOOD STABILIZER MARKET VALUE, 2015-2023 ($MILLION)
FIGURE 18. REST OF EUROPE FOOD STABILIZER MARKET VALUE, 2015-2023 ($MILLION)
FIGURE 19. CHINA FOOD STABILIZER MARKET VALUE, 2015-2023 ($MILLION)
FIGURE 20. INDIA FOOD STABILIZER MARKET VALUE, 2015-2023 ($MILLION)
FIGURE 21. JAPAN FOOD STABILIZER MARKET VALUE, 2015-2023 ($MILLION)
FIGURE 22. AUSTRALIA FOOD STABILIZER MARKET VALUE, 2015-2023 ($MILLION)
FIGURE 23. KOREA FOOD STABILIZER MARKET VALUE, 2015-2023 ($MILLION)
FIGURE 24. REST OF ASIA-PACIFIC FOOD STABILIZER MARKET VALUE, 2015-2023 ($MILLION)
FIGURE 25. BRAZIL FOOD STABILIZER MARKET VALUE, 2015-2023 ($MILLION)
FIGURE 26. TURKEY FOOD STABILIZER MARKET VALUE, 2015-2023 ($MILLION)
FIGURE 27. SOUTH AFRICA FOOD STABILIZER MARKET VALUE, 2015-2023 ($MILLION)
FIGURE 28. REST OF LAMEA FOOD STABILIZER MARKET VALUE, 2015-2023 ($MILLION)
Food stabilizers are food additives that are added to food items to smoothen the texture of the food and provide shape to the food. It helps to maintain color, shape, texture, consistency, and stability of food products. Pectin, carrageenan, gelatin, agar-agar, xanthan gum, and calcium chloride are some of the commonly used stabilizers in food products. These food stabilizers are used in a wide range of food applications, such as bakery, confectionery, beverage, convenience food, and meat & poultry product including many others. In 2016, the gelatin segment accounted for one-third share of the global market.
The pectin food stabilizer segment is expected to witness the highest growth rate, registering a CAGR of 4.9% during the forecast period. Pectin occurs naturally in citrus fruits and are able to form a gel at varying conditions. Pectin is commonly used in highly sugared, low-pH frozen desserts such as sherbets, water ices, and sorbets. Moreover, in protein beverages, pectin provides suspension and stability when combined with thickeners, such as guar gum and xanthan gum. The bakery application segment accounted for the highest share in 2016, with almost one-fifth share in global market. The texture by function segment dominated the global market in 2016, with almost half of the market share.
Europe is the most significant market for food stabilizers, in terms of both revenue and volume. Germany dominated the European food stabilizer market in 2016, in terms of both value and volume. The support of European Food Safety Authority and other government agencies for the approval of safe food additives & stabilizers are the major factors driving the global food stabilizers market.
Start reading instantly.
This Report and over 68,418+ more Reports, Available with Avenue Library. T&C*.
Enterprise
License/PDF
Library
Membership
*Taxes/Fees, if applicable will be added during checkout. All prices in USD
To ensure high-level data integrity, accurate analysis, and impeccable forecasts
For complete satisfaction
On-demand customization of scope of the report to exactly meet your needs
Targeted market view to provide pertinent information and save time of readers
Get insights on topics that are crucial for your business. Stay abreast of your interest areas.
Get Industry Data AlertsTo ensure high-level data integrity, accurate analysis, and impeccable forecasts
For complete satisfaction
On-demand customization of scope of the report to exactly meet your needs
Targeted market view to provide pertinent information and save time of readers