Friction Products and Materials Market by Product (Pads, Lining, discs, blocks, and Others), Business Type (Original Equipment and Aftersales), End User (Brakes, Clutches, and Industrial Brake & Transmission Systems), and Application (Automotive, Railway, Construction, Aerospace & Marine, and Others): Global Opportunity Analysis and Industry Forecast, 2018-2025 Update Available On-Demand
A04888 | Pages: 157 | Apr 2019 | 3963 Views | | |
Author(s) : Vivek Banik , Supradip Baul | Tables: 37 | Charts: 46 | Formats*: | |
COVID-19
Pandemic disrupted the entire world and affected many industries.
Get detailed COVID-19 impact analysis on the Friction Products And Materials Market
Request Now !
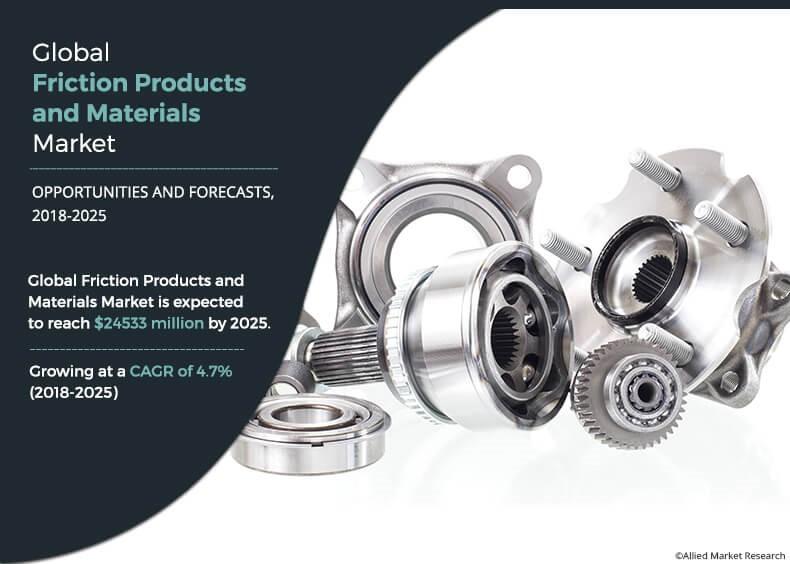
Friction Products and Materials Market Outlook - 2025
The global friction products and materials market size was valued at $17,046 million in 2017, and is projected to reach $24,533 million by 2025, growing at a CAGR of 4.7% from 2018 to 2025. Friction product and materials are used to induce friction in various situations where decreased or slow movement is necessary. Friction is the resistance that aims to oppose the movement of objects. It occurs when solid object comes in contact with diverging surface. Frictions products and materials majorly find their application in operating systems, brake & clutch systems, industrial machinery, and gear tooth systems that all need to slow down or stop their processes. The process of friction is required in the brake system, clutch, and grinding. In braking process, brake pads or brake shoes are pressed against the rotating brake disc or drum. Brake system is used to slow down and stop moving motor vehicles and to hold vehicle stationary when in parking position.
Get more information on this report : Request Sample Pages
The growth of the market is driven by increase in demand for friction products and materials from the automotive end-user industry. This in turn also drives the global friction materials market. In addition, manufacturers are focusing on launching new friction products as part of their business strategy to gain a stronger foothold in the friction products and materials market. For example, in July 2017, TMD Friction launched a premium brake pad with dampening shim under its brand name, Textar. This brake pad aims to provide noise reduction, thereby delivering enhanced braking performance. In addition, it prevents direct contact between backing plates and brake pistons thereby dampening the vibration transfer. Hence, increase in demand for friction products in the automotive industry is expected to fuel the growth of the global friction products and materials market during the forecast period.
Get more information on this report : Request Sample Pages
Furthermore, upsurge in demand for passenger and commercial vehicles boost the demand for these products, which fuels the market growth. In addition, development of the aerospace, machinery, and construction industries is expected to drive the need for friction products and materials during the forecast period. TMD Friction deals with various brake friction technologies and aims to provide reliable, effective, and safe braking solutions for racing cars, passenger and commercial cars, and other industrial applications. Moreover, manufacturers are focusing on implementing various restrictions on substances that are used in brake friction materials. For example, in California, U.S., the use of friction materials containing more than 0.5% copper is expected to get prohibited in new vehicles from the beginning of 2025. Akebono focuses on the development, production, and distribution of friction materials to comply with the new law. Thus, compliance of law by these small players significantly contributes toward the expansion of the global market in developing countries and low-end international market.
Get more information on this report : Request Sample Pages
The industry players are focusing toward creating better and cost-effective ways to develop highly efficient friction materials. For example, in April 2017, Federal-Mogul Motorparts launched Jurid replacement brake pads for German vehicles registered in North America. Jurid pads offers coverage of approximately 98% of German passenger vehicles registered in the U.S. and Canada.
Get more information on this report : Request Sample Pages
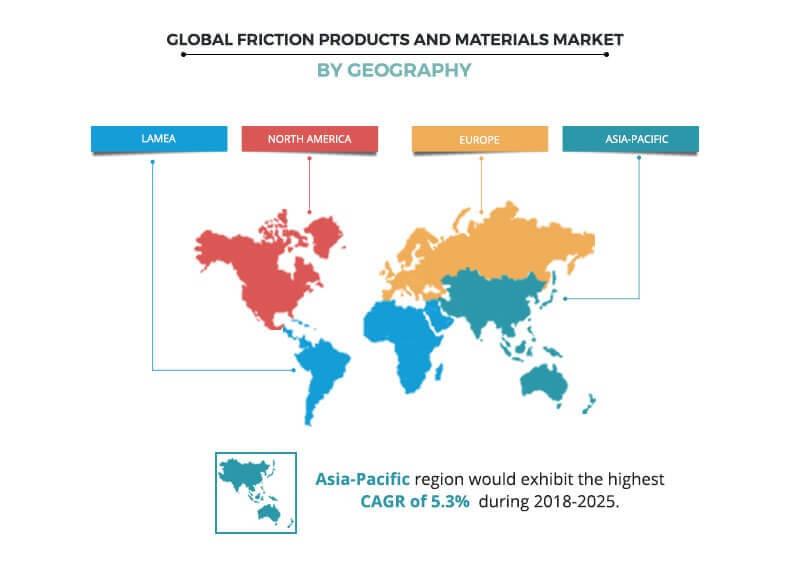
Asia-Pacific is anticipated to remain the fastest growing sector due to increase in demand for automotive vehicles.Countries such as China, India, Japan, the U.S., and Germany are expected to be the key demand areas, which supplements the global friction products and materials market growth. However, some countries such as Germany, Sweden, Austria, Netherlands, Denmark, Switzerland, and U.S. have banned the use of asbestos as friction material. Such factor is expected to hinder the growth of the global market.
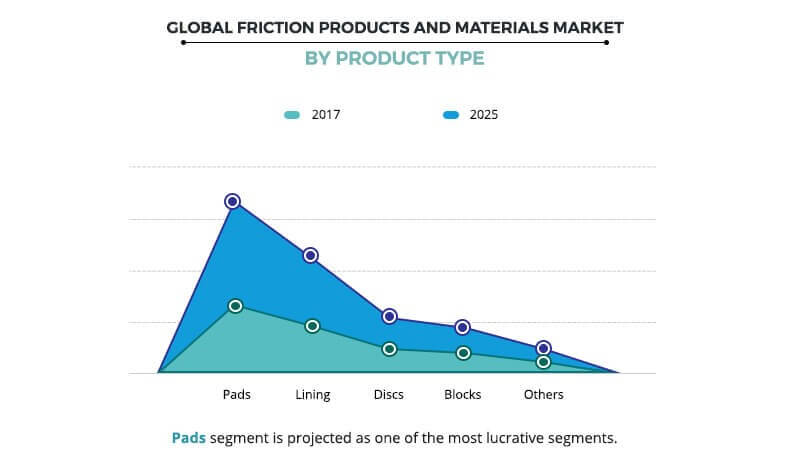
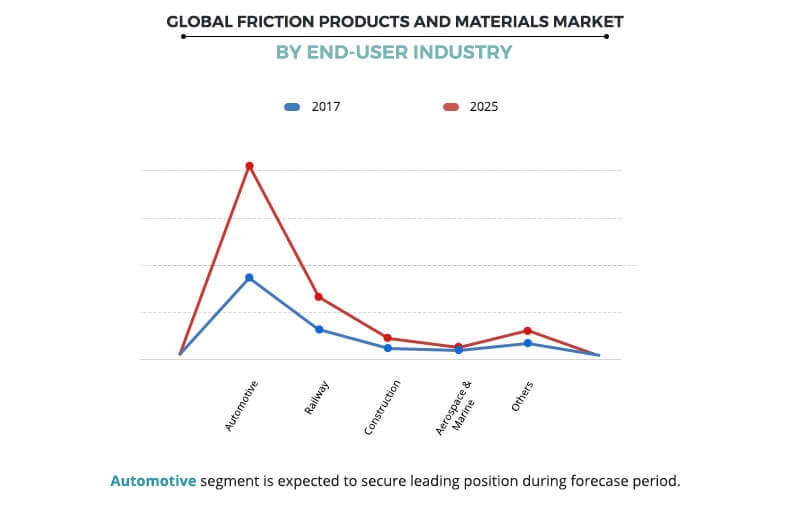
The global friction products and materials market is segmented into product, business type, application, end-use industry, and region. Based on product, the friction products and materials market is divided into pads, lining, discs, blocks, and others. In 2017, the pads segment held the largest market share due to increase in demand for various friction pads in braking systems and development of the automotive industry. On the basis of business type, the market is classified into original equipment (OE) and aftersales. In 2017, the aftersales segment garnered the highest share, due to increase in demand for lightweight carbon-free friction materials. Moreover, increase in demand for industrial and construction equipment is expected to boost the growth of the friction products market. The applications covered in the market include brakes, clutches, and industrial brakes & transmission systems. In 2017, brakes segment occupied the highest share in the market, due to growth in safety concerns, rise in vehicle production, stringent government regulations for vehicle safety & increase in road accidents. Depending on end-use industry, the friction products and materials market are fragmented into automotive, construction, railway, aerospace & mining, and others. In 2017, the automotive segment contributed significantly toward the growth of the friction products and materials market, owing to increase in demand for brake and clutch systems.
Region wise, the market is analyzed across North America, Europe, Asia-Pacific, and LAMEA. In 2017, Asia-Pacific accounted for the highest share, and is anticipated to secure the leading position during the forecast period. China is a pioneer in the friction products and materials market. Therefore, global friction products and materials market share is highest among the Asia-Pacific countries.
Competition Analysis
The major players operating in the global friction products and materials market include Nisshinbo Holdings Inc., Akebono Brake Industry, Federal-Mogul Holdings, MIBA AG, Carlisle Brake & Friction (CBF), ABS FRICTION CORP., European Friction Industries Ltd., Fras-le, Hindustan Composites Ltd., and GMP Friction Products.
Key Benefits for Friction Products and Materials Market:
- The friction products and materials market report provides an extensive analysis of the current and emerging market trends and dynamics in the global friction products and materials market.
- In-depth friction products and materials market analysis is conducted by constructing market estimations for the key market segments between 2018 and 2025.
- Extensive analysis of the market is conducted by following key product positioning and monitoring of the top competitors within the market framework.
- A comprehensive analysis of all regions is provided to determine the prevailing opportunities.
- Key market players within the friction products and materials market are profiled in this report and their strategies are analyzed thoroughly, which help to understand the competitive outlook of the global friction products and materials industry.
- Friction products and materials market forecast analysis from 2018 to 2025 is included in the report.
Global Friction Products and Materials Market Segemets:
By Product
- Pads
- Lining  Â
- Discs
- Blocks  Â
- Others
By Business Type
- Original Equipment (OE)
- Aftersales
By Application
- Brakes
- Clutches
- Industrial Brake & Transmission Systems
By End-User Industry
- Automotive
- Railway
- Construction
- Aerospace & Marine
- Others
By Region
- North America
- U.S.
- Canada
- Mexico
- Europe
- UK
- France
- Germany
- Spain
- Italy
- Rest of Europe
- Asia-Pacific
- China
- India
- Japan
- South Korea
- Thailand
- Rest of Asia-Pacific
- LAMEA
- Latin America
- Middle East
- Africa
Key Players
- ABS FRICTION CORP.
- Akebono Brake Industry
- Carlisle Brake & Friction (CBF)
- European Friction Industries Ltd
- Fras-le
- GMP Friction Products
- Hindustan Composites Ltd.
- MIBA AG
- Nisshinbo Holdings Inc.
- Tenneco (Federal-Mogul Holding)
CHAPTER 1: INTRODUCTION
1.1. Report description
1.2. Key benefits for stakeholders
1.3. Key market segments
1.4. Research methodology
1.4.1. Primary research
1.4.2. Secondary research
1.4.3. Analyst tools and models
CHAPTER 2: EXECUTIVE SUMMARY
2.1. CXO perspective
CHAPTER 3: ATTRACTIVE GROWTH OPPORTUNITIES
3.1. Friction products and materials market, by region
3.2. Friction products and materials market, by end-use industry
3.3. Friction products and materials market, by product type
3.4. Friction products and materials market, by application
CHAPTER 4: MARKET OVERVIEW
4.1. Market definition and scope
4.2. Market dynamics
4.2.1. Drivers
4.2.1.1. Upsurge in demand for passenger and commercial vehicles
4.2.1.2. Increase in demand for effective friction products in automotive industry
4.2.2. Restraint
4.2.2.1. Stringent regulations associated with friction materials
4.2.3. Opportunity
4.2.3.1. Upsurge in demand for lightweight friction products in automotive end-use industry
4.2.4. Challenge
4.2.4.1. Advancements in braking technologies to eradicate the use of friction material
4.3. Porter’s five forces analysis
4.4. Value chain analysis
4.5. Key player positioning, 2018
4.6. Friction materials: material overview
4.6.1. Non-asbestos organic (Nao)
4.6.2. Low steel
4.6.3. Semi-metallic
4.6.4. Sintered metals
4.6.5. Ceramic
4.6.6. Asbestos
4.6.7. Others
4.7. Macroeconomic indicator
4.7.1. Automotive
4.7.2. Construction
CHAPTER 5: FRICTION PRODUCTS AND MATERIALS MARKET, BY PRODUCT TYPE
5.1. Introduction
5.1.1. Market size and forecast, by product type
5.2. Pads
5.3. Lining
5.4. Discs
5.5. Blocks
5.6. Others
CHAPTER 6: FRICTION PRODUCTS AND MATERIALS MARKET, BY BUSINESS TYPE
6.1. Introduction
6.1.1. Market size and forecast, by business type
6.2. Original Equipment (OE)
6.3. Aftersales
CHAPTER 7: FRICTION PRODUCTS AND MATERIALS MARKET, BY APPLICATION
7.1. Introduction
7.1.1. Market size and forecast, by application
7.2. Brakes
7.3. Clutches
7.4. Industrial brake & transmission systems
CHAPTER 8: FRICTION PRODUCTS AND MATERIALS MARKET, BY END-USE INDUSTRY
8.1. Introduction
8.1.1. Market size and forecast, by end-use industry
8.2. Automotive
8.3. Railway
8.4. Construction
8.5. Aerospace & Marine
8.6. Others
CHAPTER 9: FRICTION PRODUCTS AND MATERIALS MARKET, BY REGION
9.1. Introduction
9.1.1. Market size and forecast, by region
9.2. North America
9.2.1. North America market size and forecast, by country
9.2.1.1. U.S.
9.2.1.2. Canada
9.2.1.3. Mexico
9.3. Europe
9.3.1. Europe market size and forecast, by country
9.3.1.1. UK
9.3.1.2. France
9.3.1.3. Germany
9.3.1.4. Spain
9.3.1.5. Italy
9.3.1.6. Rest of Europe
9.4. Asia-Pacific
9.4.1. Asia-Pacific market size and forecast, by country
9.4.1.1. China
9.4.1.2. India
9.4.1.3. Japan
9.4.1.4. South Korea
9.4.1.5. Thailand
9.4.1.6. Rest of Asia-Pacific
9.5. LAMEA
9.5.1. LAMEA market size and forecast, by country
9.5.1.1. Latin America
9.5.1.2. Middle East
9.5.1.3. Africa
CHAPTER 10: COMPANY PROFILES
10.1. ABS Friction, Inc.
10.1.1. Company overview
10.1.2. Company snapshot
10.1.3. Product portfolio
10.2. Akebono Brake Industry Co., Ltd.
10.2.1. Company overview
10.2.2. Company snapshot
10.2.3. Operating business segments
10.2.4. Product portfolio
10.2.5. Business performance
10.3. Carlisle Companies Incorporated
10.3.1. Company overview
10.3.2. Company snapshot
10.3.3. Operating business segments
10.3.4. Product portfolio
10.3.5. Business performance
10.4. European Friction Industries Ltd.
10.4.1. Company overview
10.4.2. Company snapshot
10.4.3. Operating business segments
10.4.4. Product portfolio
10.5. Fras-le S.A.
10.5.1. Company overview
10.5.2. Company snapshot
10.5.3. Operating business segments
10.5.4. Product portfolio
10.5.5. Key strategic moves and developments
10.6. GMP Friction Products
10.6.1. Company overview
10.6.2. Company snapshot
10.6.3. Product portfolio
10.7. Hindustan Composites Limited
10.7.1. Company overview
10.7.2. Company snapshot
10.7.3. Operating business segments
10.7.4. Product portfolio
10.7.5. Business performance
10.8. Miba AG
10.8.1. Company overview
10.8.2. Company snapshot
10.8.3. Operating business segments
10.8.4. Product portfolio
10.8.5. Business performance
10.9. Nisshinbo Holdings Inc.
10.9.1. Company overview
10.9.2. Company snapshot
10.9.3. Operating business segments
10.9.4. Product portfolio
10.9.5. Business performance
10.10. Tenneco Inc. (Federal-Mogul Motorparts LLC)
10.10.1. Company overview
10.10.2. Company snapshot
10.10.3. Operating business segments
10.10.4. Product portfolio
10.10.5. Business performance
10.10.6. Key strategic moves and developments
LIST OF TABLES
TABLE 01. GLOBAL FRICTION PRODUCTS AND MATERIALS MARKET, BY PRODUCT, 2017-2025($MILLION)
TABLE 02. GLOBAL FRICTION PRODUCTS AND MATERIALS MARKET, BY BUSINESS TYPE, 2017-2025($MILLION)
TABLE 03. GLOBAL FRICTION PRODUCTS AND MATERIALS MARKET, BY APPLICATION, 2017-2025($MILLION)
TABLE 04. GLOBAL FRICTION PRODUCTS AND MATERIALS MARKET, BY END-USE INDUSTRY, 2017-2025($MILLION)
TABLE 05. GLOBAL FRICTION PRODUCTS AND MATERIALS MARKET, BY REGION, 2017-2025($MILLION)
TABLE 06. NORTH AMERICA FRICTION MATERIALS, BY COUNTRY, 2017–2025 ($MILLION)
TABLE 07. EUROPE FRICTION PRODUCTS AND MATERIALS MARKET, BY COUNTRY, 2017–2025 ($MILLION)
TABLE 08. ASIA-PACIFIC FRICTION MATERIALS, BY COUNTRY, 2017–2025 ($MILLION)
TABLE 09. LAMEA FRICTION MATERIALS, BY COUNTRY, 2017–2025 ($MILLION)
TABLE 10. ABS FRICTION, INC.: COMPANY SNAPSHOT
TABLE 11. ABS FRICTION, INC: PRODUCT PORTFOLIO
TABLE 12. AKEBONO BRAKE INDUSTRY CO., LTD.: COMPANY SNAPSHOT
TABLE 13. AKEBONO BRAKE INDUSTRY CO., LTD.: PRODUCT CATEGORIES
TABLE 14. AKEBONO BRAKE INDUSTRY CO., LTD: PRODUCT PORTFOLIO
TABLE 15. CARLISLE COMPANIES INCORPORATED: COMPANY SNAPSHOT
TABLE 16. CARLISLE COMPANIES INCORPORATED: OPERATING SEGMENTS
TABLE 17. CARLISLE COMPANIES INCORPORATED: PRODUCT PORTFOLIO
TABLE 18. EUROPEAN FRICTION INDUSTRIES LTD.: COMPANY SNAPSHOT
TABLE 19. EUROPEAN FRICTION INDUSTRIES LTD: OPERATING SEGMENTS
TABLE 20. ABC: PRODUCT PORTFOLIO
TABLE 21. FRAS-LE S.A.: COMPANY SNAPSHOT
TABLE 22. FRAS-LE S.A.: PRODUCT CATEGORIES
TABLE 23. FRAS-LE S.A.: PRODUCT PORTFOLIO
TABLE 24. GMP FRICTION PRODUCTS: COMPANY SNAPSHOT
TABLE 25. GMP FRICTION PRODUCTS: PRODUCT PORTFOLIO
TABLE 26. HINDUSTAN COMPOSITES LIMITED: COMPANY SNAPSHOT
TABLE 27. HINDUSTAN COMPOSITES LIMITED: OPERATING SEGMENTS
TABLE 28. HINDUSTAN COMPOSITES LIMITED: PRODUCT PORTFOLIO
TABLE 29. MIBA AG: COMPANY SNAPSHOT
TABLE 30. MIBA AG: OPERATING DIVISION
TABLE 31. MIBA AG: PRODUCT PORTFOLIO
TABLE 32. NISSHINBO HOLDINGS INC.: COMPANY SNAPSHOT
TABLE 33. NISSHINBO HOLDINGS INC.: OPERATING SEGMENTS
TABLE 34. NISSHINBO HOLDINGS INC.: PRODUCT PORTFOLIO
TABLE 35. TENNECO INC: COMPANY SNAPSHOT
TABLE 36. TENNECO INC.: PRODUCT CATEGORIES
TABLE 37. TENNECO INC.: PRODUCT PORTFOLIO
LIST OF FIGURES
FIGURE 01. GLOBAL FRICTION PRODUCTS AND MATERIALS, 2017–2025
FIGURE 02. GLOBAL FRICTION PRODUCTS AND MATERIALS, BY COUNTRY, 2017–2025
FIGURE 03. TOP INVESTMENT POCKETS, BY REGION
FIGURE 04. TOP INVESTMENT POCKETS, BY END-USE INDUSTRY
FIGURE 05. TOP INVESTMENT POCKETS, BY PRODUCT TYPE
FIGURE 06. TOP INVESTMENT POCKETS, BY APPLICATION
FIGURE 07. GLOBAL FRICTION PRODUCTS AND MATERIALS MARKET: DRIVERS, RESTRAINTS, OPPORTUNITIES, AND CHALLENGES
FIGURE 08. VEHICLE SALES DATA, 2005–2017 (MILLION UNITS)
FIGURE 09. MODERATE BARGAINING POWER OF SUPPLIERS
FIGURE 10. HIGH THREAT OF NEW ENTRANTS
FIGURE 11. MODERATE THREAT OF SUBSTITUTES
FIGURE 12. HIGH INTENSITY OF RIVALRY
FIGURE 13. HIGH BARGAINING POWER OF BUYERS
FIGURE 14. VALUE CHAIN OF FRICTION PRODUCTS AND MATERIALS MARKET
FIGURE 15. KEY PLAYER POSITIONING
FIGURE 16. GLOBAL AUTO PARTS & ACCESSORIES MANUFACTURING INDUSTRY MARKET, 2014–2018 ($TRILLION)
FIGURE 17. GLOBAL VEHICLE PRODUCTION, 2014–2017 (UNITS)
FIGURE 18. U.S. FRICTION PRODUCTS AND MATERIALS MARKET, 2017–2025 ($MILLION)
FIGURE 19. CANADA FRICTION PRODUCTS AND MATERIALS MARKET, 2017–2025 ($MILLION)
FIGURE 20. MEXICO FRICTION PRODUCTS AND MATERIALS MARKET, 2017–2025 ($MILLION)
FIGURE 21. U.K FRICTION PRODUCTS AND MATERIALS MARKET, 2017–2025 ($MILLION)
FIGURE 22. FRANCE FRICTION PRODUCTS AND MATERIALS MARKET, 2017–2025 ($MILLION)
FIGURE 23. GERMANY FRICTION PRODUCTS AND MATERIALS MARKET, 2017–2025 ($MILLION)
FIGURE 24. SPAIN FRICTION PRODUCTS AND MATERIALS MARKET, 2017–2025 ($MILLION)
FIGURE 25. ITALY FRICTION PRODUCTS AND MATERIALS MARKET, 2017–2025 ($MILLION)
FIGURE 26. REST OF EUROPE FRICTION PRODUCTS AND MATERIALS MARKET, 2017–2025 ($MILLION)
FIGURE 27. CHINA FRICTION PRODUCTS AND MATERIALS MARKET, 2017–2025 ($MILLION)
FIGURE 28. INDIA FRICTION PRODUCTS AND MATERIALS MARKET, 2017–2025 ($MILLION)
FIGURE 29. JAPAN FRICTION PRODUCTS AND MATERIALS MARKET, 2017–2025 ($MILLION)
FIGURE 30. SOUTH KOREA FRICTION PRODUCTS AND MATERIALS MARKET, 2017–2025 ($MILLION)
FIGURE 31. THAILAND FRICTION PRODUCTS AND MATERIALS MARKET, 2017–2025 ($MILLION)
FIGURE 32. REST OF ASIA-PACIFIC FRICTION PRODUCTS AND MATERIALS MARKET, 2017–2025 ($MILLION)
FIGURE 33. LATIN AMERICA FRICTION PRODUCTS AND MATERIALS MARKET, 2017–2025 ($MILLION)
FIGURE 34. MIDDLE EAST FRICTION PRODUCTS AND MATERIALS MARKET, 2017–2025 ($MILLION) 109
FIGURE 35. AFRICA FRICTION PRODUCTS AND MATERIALS MARKET, 2017–2025 ($MILLION)
FIGURE 36. AKEBONO BRAKE INDUSTRY CO., LTD.: REVENUE, 2016–2018 ($MILLION)
FIGURE 37. AKEBONO BRAKE INDUSTRY CO., LTD.: REVENUE SHARE BY REGION, 2018 (%)
FIGURE 38. CARLISLE COMPANIES INCORPORATED: REVENUE, 2016–2018 ($MILLION)
FIGURE 39. CARLISLE COMPANIES INCORPORATED: REVENUE SHARE BY SEGMENT, 2018 (%)
FIGURE 40. CARLISLE COMPANIES INCORPORATED: REVENUE SHARE BY REGION, 2018 (%)
FIGURE 41. HINDUSTAN COMPOSITES LIMITED: REVENUE, 2016–2018 ($MILLION)
FIGURE 42. HINDUSTAN COMPOSITES LIMITED: REVENUE SHARE BY SEGMENT, 2018 (%)
FIGURE 43. MIBA AG: REVENUE, 2016–2018 ($MILLION)
FIGURE 44. NISSHINBO HOLDINGS INC.: REVENUE, 2016–2018 ($MILLION)
FIGURE 45. NISSHINBO HOLDINGS INC.: REVENUE SHARE BY SEGMENT, 2018 (%)
FIGURE 46. TENNECO INC.: REVENUE, 2015–2017 ($MILLION)
The global friction products and materials market is witnessing considerable growth in the emerging markets such as India, China, and others. This growth is attributable to the development of the automotive, aerospace, machinery, and construction industries and high demand for better brakes and linings. In addition, increase in demand for passenger cars, particularly in emerging markets, is further expected to fuel the market growth. However, rise in use of eco-friendly and nontoxic brake friction products is anticipated to hinder the market growth.
Asia-Pacific is witnessing the highest demand for friction material products, followed by Europe, North America, and LAMEA. The highest share of the Asia-Pacific market is attributable to increase in demand for increased construction activities and growth in automotive industry.
In addition, various leading manufacturers such as ABS Friction Corp, Akebono Brake Industry, Carlisle Brake & Friction (CBF), European Friction Industries Ltd, Fras-le, GMP Friction Products, Hindustan Composites Ltd., MIBA AG, Nisshinbo Holdings Inc., and Tenneco (Federal-Mogul Holding) occupy a prominent revenue share in the friction products and materials market.
Access from any device, anywhere
Clients can easily download both quantitative as well as
qualitative reports in PDF and excel formats.
Download Sample
Purchase Full Report of
Friction Products and Materials Market
- Online Only
- $3,456
- Online cloud access only
- Restricted print, copy, paste & download
- Read only
- Free quarterly industry update
- Free report update (Within 180 days)
- Subscription model sign in
- Data Pack
- $3,840
- Restricted to one authorized user
- One print only
- Available in
Excel - Free quarterly industry update
- Free report update (Within 180 days)
- Subscription model sign in
- Single User
- $5,769
- Restricted to one authorized user
- One print only
- Available in Excel & PDF
- Free quarterly industry update
- Free report update (Within 180 days)
- Subscription model sign in
- Five Users
- $6,450
- Limited to five authorized users
- Print upto five copies
- Available in Excel & PDF
- Free quarterly industry update
- Free report update (Within 180 days)
- Subscription model sign in
-
Enterprise
License/PDF - $8,995
- Unlimited
within
company/enterprise - Available in Excel & PDF
- Free quarterly industry update
- Free report update (Within 180 days)
- Subscription model sign in
- Library Membership
- $ 699/mo
- Published Content
E-access - Company Profiles
E-access - Newly Added Content Access
- 10 PDF
Downloads - 5 Excel Data
Pack Downloads - 250 Company Profiles PDF Downloads
-
Start reading instantly.
Buy Now
This title and over 12,000+ are available on the Avenue Library. T&C*.
*Taxes/Fees, if applicable will be added during checkout. All prices in USD
Why Allied Market Research?
Infallible Methodology
To ensure high-level data integrity, accurate analysis, and impeccable forecasts
Analyst Support
For complete satisfaction
Customization
On-demand customization of scope of the report to exactly meet your needs
TARGETED MARKET VIEW
Targeted market view to provide pertinent information and save time of readers
Featured Reports
Get fresh content delivered
Get insights on topics that are crucial for your business. Stay abreast of your interest areas.
Why Allied Market Research?
Infallible Methodology
To ensure high-level data integrity, accurate analysis, and impeccable forecasts
Analyst Support
For complete satisfaction
Customization
On-demand customization of scope of the report to exactly meet your needs
TARGETED MARKET VIEW
Targeted market view to provide pertinent information and save time of readers