0
2022
Fuel Ethanol Market

Fuel Ethanol Market

by Source (Synthetic, Natural), by Product (Starch Based, Sugar Based, Cellulosic), by Application (Conventional Vehicles, Flexible Fuel Vehicles), by End Use Industry (Automotive, Oil and Gas, Others): Global Opportunity Analysis and Industry Forecast, 2021-2031

Report Code: A16349
May 2022 | Pages: 363
Tables: 285
Charts: 67
  • Formats*:

  • pdf

    Single User License, Five User
    License & Enterprise User License

  • xls

    Data Pack Excel License

  • ppt

    It comes with the additional cost
    of $2500.00 contact sales.


Fuel Ethanol Market Research, 2031

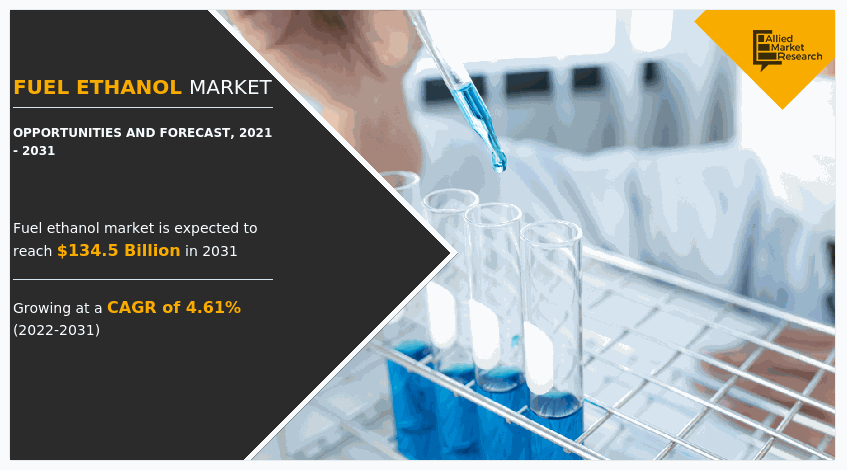
The global fuel ethanol market was valued at $86.0 billion in 2021, and is projected to reach $134.5 billion by 2031, growing at a CAGR of 4.61% from 2022 to 2031.
COVID-19 has severely impacted the global economy with devastating effects on global trade, which has simultaneously affected households, business, financial institution, industrial establishments and infrastructure companies. The shutdown of industrial manufacturer led to the decline in the demand for vehicles for transportation and the shutdown of transportation sector in most of the countries across the world led to decline in the demand of the fuel ethanol market.

Fuel Ethanol Market, Fuel Ethanol Industry, Fuel Ethanol Market Size, Fuel Ethanol Market Share, Fuel Ethanol Market Forecast, Fuel Ethanol Market Analysis, Fuel Ethanol Market Trends, Fuel Ethanol Market Growth, Fuel Ethanol Market Opportunities

The fuel ethanol market is segmented into Source, Product, Application and End Use Industry.

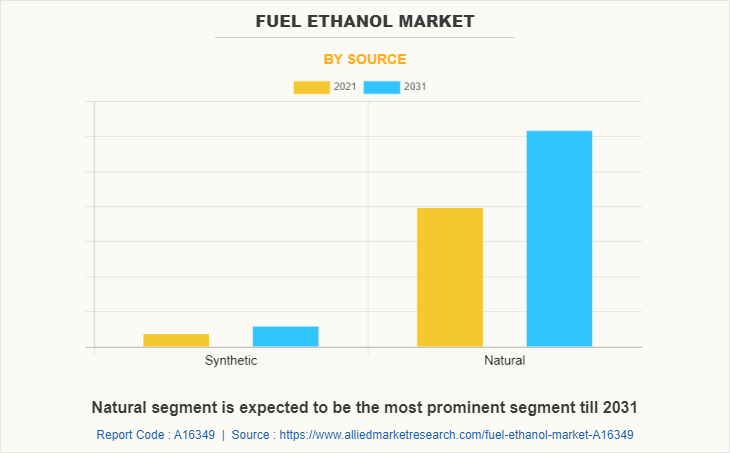
Fuel ethanol is ethyl alcohol that is used as fuel. It is most often used as motor fuel, mainly as a biofuel additive for gasoline. It is commonly made from biomass such as corn or sugarcane. Ethanol blended fuel is widely used in Brazil, the U.S., and Europe. Fuel ethanol is manufactured from two sources one natural biomass, and synthetic source. Natural source ethanol is a form of renewable energy that can be produced from agricultural feedstock. It can be made from very common crops such as sugarcane, potato, cassava, and corn. In synthetic situation, it is produced from the petrochemical industries using fossil fuel as raw material. Currently 93% of ethanol fuel is produced form natural source, while 3% from the synthetic source.

The presence of investments in the past decade and recent emergence of the importance regarding the impact of transportation sector on the environment, and increasing policies of major developing countries to make progress towards climate goals for 2030 are some of the essential factors driving the market growth during the forecast period. Furthermore, the restrictions of the insufficient presence of feedstock, less efficiency conversion of biomass, and the presence of less number of refineries have hampered the market. The rapid innovation and investment of new entrants to develop alternative processing method for ethanol fuel and the presence of very few refineries to meet the on-going demand for ethanol fuel is a negative impact on the development of the market.

The increase in investment of major oil manufacturers in the procurement of fuel ethanol from the fuel ethanol producers to improve the gasoline octane content, to reduce the production of carbon soot and to fallow the government regulations to reduce the carbon emission are major factors driving the growth of the market.

Increase in technology to extract the ethanol fuel from non-food crops with economical cost, the government policies and initiatives to support the green industries, which can provide extra income to the farmers and also reduce the carbon emission during improper handling of the agricultural waste. In addition to the presence of global fuel giants such as Shell, Hindustan Petroleum Corporation Limited has reached various partnership, collaboration, and acquisition in regards with the biofuel related companies in order to commercialize the biofuel, will create opportunities for the growth of the fuel ethanol market.

The fuel ethanol market industry is segmented on the basis of source, product, application, end use industry and region.

On the basis of source, the global fuel ethanol market is segmented into synthetic and natural. On the basis of product, the market is segmented into starch based, sugar based and cellulosic. On the basis of application, the market is segmented into conventional vehicles, and flexible fuel vehicles. On the basis of end use industry, the global market is bifurcated into automotive, oil & gas, and others.

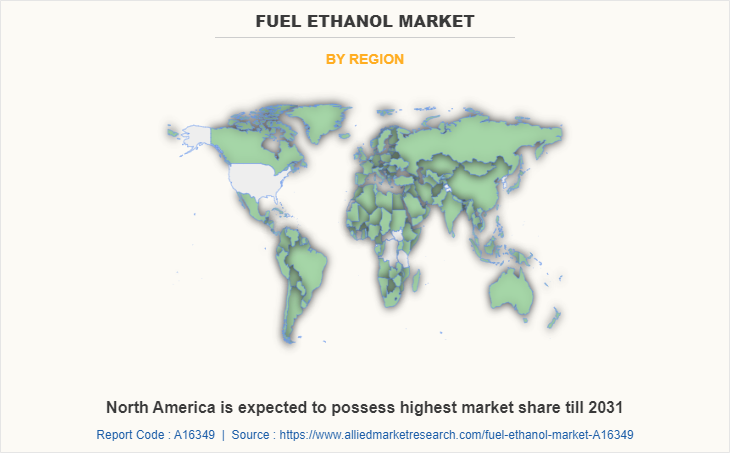
Region wise, the market is studied across North America, Europe, Asia-Pacific, and LAMEA. Presently, North America accounts for the largest fuel ethanol market share of the market, followed by Europe and Asia-Pacific.

The major companies profiled in this report include Braskem, BP PLC, Cargill Incorporated, INEOS, HPCL Biofuels Limited, Lyondell Basell Industries Holdings BV, Mitsubishi Chemical Corporation, SABIC, Sasol Limited, Solvay SA. Other companies that are not profiled in the report include Archer Daniels Midland Company, KFS Biodiesel GmbH & Co KG, Petrosun, Inc., Red Rock Biofuels, Shirke energy, Targray Technology International Inc., and Vega Biofuels. Rapid urbanization and surge in the development of transportation infrastructure has fuelled the demand for fuel ethanol market in order to reduce the impact of transportation sector on the environment. Additional growth strategies such as expansion of production capacities, acquisition, collaboration, joint venture, and partnership in the development of the innovative products from manufacturers have helped to attain key developments in the global fuel ethanol market trends.
Fuel Ethanol Market

The natural source segment dominates the global fuel ethanol market share. Natural source for ethanol is fermentation of biomass; in 2020, 93% of global ethanol is produced through natural biomass. Most of the fuel ethanol produced around the world is made by fermenting the sugar in the starches of grains such as corn, sorghum, and barley, and the sugar in sugar cane and sugar beets. In this method, denaturants are added to ethanol to make fuel ethanol. Sugarcane and corn have been used as the major feedstock for ethanol production. Lignocellulosic biomass has recently been considered as another potential feedstock due to its non-food competing status and its availability in very large quantities. Furthermore, at present natural source ethanol is one of the most important biofuels in the current economy as it is contributing 65% of the total biofuels production. The presence of above mentioned factors will provide ample opportunities for the development of the market.
Fuel Ethanol Market

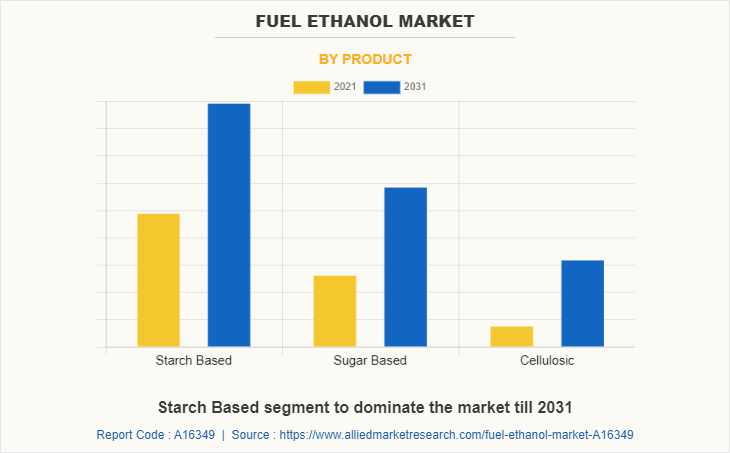
The starch based dominates the global fuel ethanol market. Starch-based materials used in the production of ethanol are corn, wheat, rice and cassava. The raw materials type is dependent on the agricultural production potential on the production areas; for instance corn is commonly used in Americas, while Rice and cassava are commonly used in Asia. Starch-based raw materials first go through hydrolysis process in which amylolytic enzymes are used to convert starch to glucose. The glucose is fermented with the presence of yeast to produce ethanol and carbon dioxide. Industrialization and increasing world population demand high energy consumption. The source for most of our energy is petroleum; in anticipation of its eventual exhaustion a great deal of effort has gone into production of renewable energy sources including biofuels such as bioethanol. Bio ethanol is used most often as a liquid fuel in transportation. It has potential uses in industrial processes and heating. The presence of advantages compared to conventional liquid fuels and helps in the reduction of carbon emission by 80% and a perfect substitution for gasoline. The presence of above mentioned advantages will drive the fuel ethanol market forecast growth.
Fuel Ethanol Market

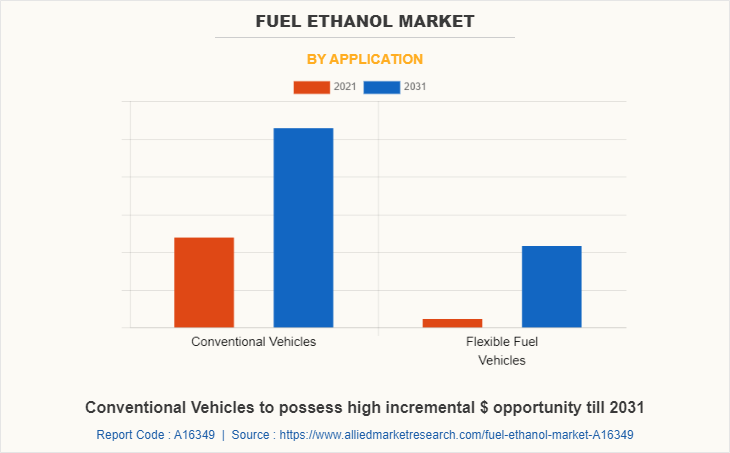
The conventional vehicles segment dominates the global fuel ethanol market. Conventional vehicles are those which use an internal combustion engine fueled by gasoline or diesel to power the wheels. Ethanol is an octane enhancer or anti-knock additive. With modern higher compression engines, ethanol helps the engine be more efficient. Hence, ethanol is blended with gasoline as fuel for the conventional vehicles. In conventional vehicles, the most common blend in E10, which includes up to 10% ethanol blended with unleaded gasoline. The increase in awareness among the people regarding the utilization of ethanol blended fuel for conventional vehicles over the environment is another major factor boosting the market growth. The presence of its advantages of utilization over the environment is a major driving factor for the fuel ethanol market growth during the forecast period.
Fuel Ethanol Market

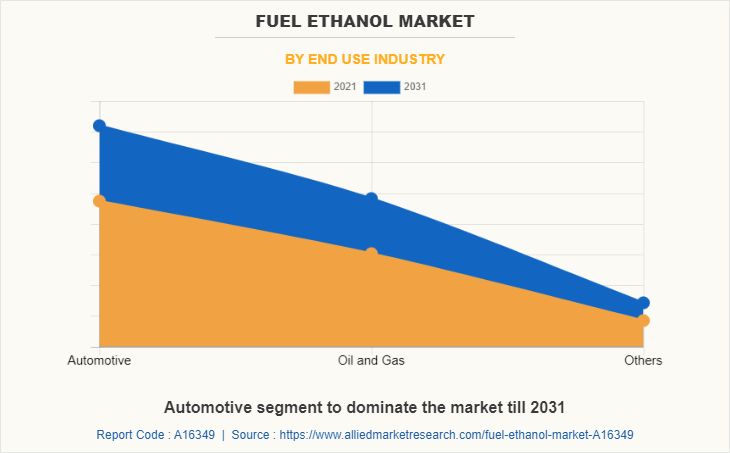
The automotive segment dominates the global fuel ethanol market. In automotive industry fuel ethanol is a fuel that is used to provide power to the engine in fuel vehicles. Currently, the majority of automobiles worldwide are powered by gasoline or diesel. Ethanol is a renewable and can be produced domestically for transportation purpose which can be used in low-level blends such as E10 (10% ethanol, 90% gasoline), E15 (10.5% to 15% ethanol), or E85 (flex fuel) a gasoline-ethanol bled containing 51% to 83% ethanol depending on regulations of the country or organization. The increasing utilization of automotive in the transportation industry across the developed and developing countries have positive impact on the demand for the fuel ethanol market. The gradual exhaustion of the fossil fuel which are used in the automotive and increasing the cost price of the crude oil have augmented the utilization of fuel ethanol in the automotive. The above mentioned factors will provide ample opportunities for the development of the market. 
Fuel Ethanol Market

North America occupies the largest part of the fuel ethanol market and consists of countries such as U.S, Canada, and Mexico. The U.S. is the world’s largest producer of ethanol, having produced over 13.9 billion gallons in 2020. In 2020, Canada exported ethanol used as fuel for the first time to Europe. Canada ethanol plants produced 1.7 billion liters in 2020 and fuel ethanol consumption was about 2.7 billion liters. Canada production of fuel ethanol has fulfilled about 61 percent of domestic demand for the past eight years with U.S. ethanol fulfilling the remaining requirements. The increasing expansion of the commercial automotive vehicles and the presence of road transportation infrastructure in the developed countries led to surge in the carbon emissions. The high authorities and government bodies such as Environment Protection Agency, Department of Energy, Department of Transportation, and U.S. Department of Agriculture has jointly funded and supported the development of the production of biofuels (natural ethanol) as an alternative for the fossil fuels. The above mentioned initiatives are major factor driving the growth of the market in this region during the forecast period.

COVID-19 analysis:

COVID-19 has severely impacted the global economy with devastating effects on global trade, which has simultaneously affected households, business, financial institution, industrial establishments and infrastructure companies. The novel coronavirus has affected several economies ad caused lockdown in many countries which has limited the growth of the market. The shutdown of industrial manufacturer led to the decline in the demand for vehicles for transportation and the shutdown of transportation sector in most of the countries across the world led to decline in the demand of the fuel ethanol market. The decrease in utilization of transportation facilities across the globe during the outbreak has a negative impact on the development of the market.

Key Benefits For Stakeholders

  • This report provides a quantitative analysis of the market segments, current trends, estimations, and dynamics of the fuel ethanol market analysis from 2021 to 2031 to identify the prevailing fuel ethanol market opportunities.
  • The market research is offered along with information related to key drivers, restraints, and opportunities.
  • Porter's five forces analysis highlights the potency of buyers and suppliers to enable stakeholders make profit-oriented business decisions and strengthen their supplier-buyer network.
  • In-depth analysis of the fuel ethanol market segmentation assists to determine the prevailing market opportunities.
  • Major countries in each region are mapped according to their revenue contribution to the global market.
  • Market player positioning facilitates benchmarking and provides a clear understanding of the present position of the market players.
  • The report includes the analysis of the regional as well as global fuel ethanol market trends, key players, market segments, application areas, and market growth strategies.

Fuel Ethanol Market Report Highlights

Aspects Details
By Source
  • Synthetic
  • Natural
By Product
  • Starch Based
  • Sugar Based
  • Cellulosic
By Application
  • Conventional Vehicles
  • Flexible Fuel Vehicles
By End Use Industry
  • Automotive
  • Oil and Gas
  • Others
By Region
  • North America  (U.S., Canada, Mexico)
  • Europe  (Germany, U.K., France, Italy, Spain, Rest of Europe)
  • Asia-Pacific  (China, Japan, India, South Korea, Rest Of Asia Pacific)
  • LAMEA  (Brazil, Saudi Arabia, South Africa, Rest of LAMEA)
Key Market Players BP Plc, SABIC, Mitsubishi Chemical Corporation, INEOS, Sasol Limited, Braskem S.A., Solvay SA, HPCL Biofuels Limited, Cargill Incorporated, LyondellBasell Industries Holdings BV
 
  • CHAPTER 1:INTRODUCTION

    • 1.1.Report description

    • 1.2.Key market segments

    • 1.3.Key benefits to the stakeholders

    • 1.4.Research Methodology

      • 1.4.1.Secondary research

      • 1.4.2.Primary research

      • 1.4.3.Analyst tools and models

  • CHAPTER 2:EXECUTIVE SUMMARY

    • 2.1.Key findings of the study

    • 2.2.CXO Perspective

  • CHAPTER 3:MARKET OVERVIEW

    • 3.1.Market definition and scope

    • 3.2.Key findings

      • 3.2.1.Top investment pockets

    • 3.3.Porter’s five forces analysis

    • 3.4.Top player positioning

    • 3.5.Market dynamics

      • 3.5.1.Drivers

      • 3.5.2.Restraints

      • 3.5.3.Opportunities

    • 3.6.COVID-19 Impact Analysis on the market

    • 3.7.Pricing Analysis

    • 3.8.Value Chain Analysis

    • 3.9.Key Regulation Analysis

  • CHAPTER 4: FUEL ETHANOL MARKET, BY SOURCE

    • 4.1 Overview

      • 4.1.1 Market size and forecast

    • 4.2 Synthetic

      • 4.2.1 Key market trends, growth factors and opportunities

      • 4.2.2 Market size and forecast, by region

      • 4.2.3 Market analysis by country

    • 4.3 Natural

      • 4.3.1 Key market trends, growth factors and opportunities

      • 4.3.2 Market size and forecast, by region

      • 4.3.3 Market analysis by country

  • CHAPTER 5: FUEL ETHANOL MARKET, BY PRODUCT

    • 5.1 Overview

      • 5.1.1 Market size and forecast

    • 5.2 Starch Based

      • 5.2.1 Key market trends, growth factors and opportunities

      • 5.2.2 Market size and forecast, by region

      • 5.2.3 Market analysis by country

    • 5.3 Sugar Based

      • 5.3.1 Key market trends, growth factors and opportunities

      • 5.3.2 Market size and forecast, by region

      • 5.3.3 Market analysis by country

    • 5.4 Cellulosic

      • 5.4.1 Key market trends, growth factors and opportunities

      • 5.4.2 Market size and forecast, by region

      • 5.4.3 Market analysis by country

  • CHAPTER 6: FUEL ETHANOL MARKET, BY APPLICATION

    • 6.1 Overview

      • 6.1.1 Market size and forecast

    • 6.2 Conventional Vehicles

      • 6.2.1 Key market trends, growth factors and opportunities

      • 6.2.2 Market size and forecast, by region

      • 6.2.3 Market analysis by country

    • 6.3 Flexible Fuel Vehicles

      • 6.3.1 Key market trends, growth factors and opportunities

      • 6.3.2 Market size and forecast, by region

      • 6.3.3 Market analysis by country

  • CHAPTER 7: FUEL ETHANOL MARKET, BY END USE INDUSTRY

    • 7.1 Overview

      • 7.1.1 Market size and forecast

    • 7.2 Automotive

      • 7.2.1 Key market trends, growth factors and opportunities

      • 7.2.2 Market size and forecast, by region

      • 7.2.3 Market analysis by country

    • 7.3 Oil and Gas

      • 7.3.1 Key market trends, growth factors and opportunities

      • 7.3.2 Market size and forecast, by region

      • 7.3.3 Market analysis by country

    • 7.4 Others

      • 7.4.1 Key market trends, growth factors and opportunities

      • 7.4.2 Market size and forecast, by region

      • 7.4.3 Market analysis by country

  • CHAPTER 8: FUEL ETHANOL MARKET, BY REGION

    • 8.1 Overview

      • 8.1.1 Market size and forecast

    • 8.2 North America

      • 8.2.1 Key trends and opportunities

      • 8.2.2 North America Market size and forecast, by Source

      • 8.2.3 North America Market size and forecast, by Product

      • 8.2.4 North America Market size and forecast, by Application

      • 8.2.5 North America Market size and forecast, by End Use Industry

      • 8.2.6 North America Market size and forecast, by country

        • 8.2.6.1 U.S.
          • 8.2.6.1.1 Market size and forecast, by Source
          • 8.2.6.1.2 Market size and forecast, by Product
          • 8.2.6.1.3 Market size and forecast, by Application
          • 8.2.6.1.4 Market size and forecast, by End Use Industry
        • 8.2.6.2 Canada
          • 8.2.6.2.1 Market size and forecast, by Source
          • 8.2.6.2.2 Market size and forecast, by Product
          • 8.2.6.2.3 Market size and forecast, by Application
          • 8.2.6.2.4 Market size and forecast, by End Use Industry
        • 8.2.6.3 Mexico
          • 8.2.6.3.1 Market size and forecast, by Source
          • 8.2.6.3.2 Market size and forecast, by Product
          • 8.2.6.3.3 Market size and forecast, by Application
          • 8.2.6.3.4 Market size and forecast, by End Use Industry
    • 8.3 Europe

      • 8.3.1 Key trends and opportunities

      • 8.3.2 Europe Market size and forecast, by Source

      • 8.3.3 Europe Market size and forecast, by Product

      • 8.3.4 Europe Market size and forecast, by Application

      • 8.3.5 Europe Market size and forecast, by End Use Industry

      • 8.3.6 Europe Market size and forecast, by country

        • 8.3.6.1 Germany
          • 8.3.6.1.1 Market size and forecast, by Source
          • 8.3.6.1.2 Market size and forecast, by Product
          • 8.3.6.1.3 Market size and forecast, by Application
          • 8.3.6.1.4 Market size and forecast, by End Use Industry
        • 8.3.6.2 U.K.
          • 8.3.6.2.1 Market size and forecast, by Source
          • 8.3.6.2.2 Market size and forecast, by Product
          • 8.3.6.2.3 Market size and forecast, by Application
          • 8.3.6.2.4 Market size and forecast, by End Use Industry
        • 8.3.6.3 France
          • 8.3.6.3.1 Market size and forecast, by Source
          • 8.3.6.3.2 Market size and forecast, by Product
          • 8.3.6.3.3 Market size and forecast, by Application
          • 8.3.6.3.4 Market size and forecast, by End Use Industry
        • 8.3.6.4 Italy
          • 8.3.6.4.1 Market size and forecast, by Source
          • 8.3.6.4.2 Market size and forecast, by Product
          • 8.3.6.4.3 Market size and forecast, by Application
          • 8.3.6.4.4 Market size and forecast, by End Use Industry
        • 8.3.6.5 Spain
          • 8.3.6.5.1 Market size and forecast, by Source
          • 8.3.6.5.2 Market size and forecast, by Product
          • 8.3.6.5.3 Market size and forecast, by Application
          • 8.3.6.5.4 Market size and forecast, by End Use Industry
        • 8.3.6.6 Rest of Europe
          • 8.3.6.6.1 Market size and forecast, by Source
          • 8.3.6.6.2 Market size and forecast, by Product
          • 8.3.6.6.3 Market size and forecast, by Application
          • 8.3.6.6.4 Market size and forecast, by End Use Industry
    • 8.4 Asia-Pacific

      • 8.4.1 Key trends and opportunities

      • 8.4.2 Asia-Pacific Market size and forecast, by Source

      • 8.4.3 Asia-Pacific Market size and forecast, by Product

      • 8.4.4 Asia-Pacific Market size and forecast, by Application

      • 8.4.5 Asia-Pacific Market size and forecast, by End Use Industry

      • 8.4.6 Asia-Pacific Market size and forecast, by country

        • 8.4.6.1 China
          • 8.4.6.1.1 Market size and forecast, by Source
          • 8.4.6.1.2 Market size and forecast, by Product
          • 8.4.6.1.3 Market size and forecast, by Application
          • 8.4.6.1.4 Market size and forecast, by End Use Industry
        • 8.4.6.2 Japan
          • 8.4.6.2.1 Market size and forecast, by Source
          • 8.4.6.2.2 Market size and forecast, by Product
          • 8.4.6.2.3 Market size and forecast, by Application
          • 8.4.6.2.4 Market size and forecast, by End Use Industry
        • 8.4.6.3 India
          • 8.4.6.3.1 Market size and forecast, by Source
          • 8.4.6.3.2 Market size and forecast, by Product
          • 8.4.6.3.3 Market size and forecast, by Application
          • 8.4.6.3.4 Market size and forecast, by End Use Industry
        • 8.4.6.4 South Korea
          • 8.4.6.4.1 Market size and forecast, by Source
          • 8.4.6.4.2 Market size and forecast, by Product
          • 8.4.6.4.3 Market size and forecast, by Application
          • 8.4.6.4.4 Market size and forecast, by End Use Industry
        • 8.4.6.5 Rest Of Asia Pacific
          • 8.4.6.5.1 Market size and forecast, by Source
          • 8.4.6.5.2 Market size and forecast, by Product
          • 8.4.6.5.3 Market size and forecast, by Application
          • 8.4.6.5.4 Market size and forecast, by End Use Industry
    • 8.5 LAMEA

      • 8.5.1 Key trends and opportunities

      • 8.5.2 LAMEA Market size and forecast, by Source

      • 8.5.3 LAMEA Market size and forecast, by Product

      • 8.5.4 LAMEA Market size and forecast, by Application

      • 8.5.5 LAMEA Market size and forecast, by End Use Industry

      • 8.5.6 LAMEA Market size and forecast, by country

        • 8.5.6.1 Brazil
          • 8.5.6.1.1 Market size and forecast, by Source
          • 8.5.6.1.2 Market size and forecast, by Product
          • 8.5.6.1.3 Market size and forecast, by Application
          • 8.5.6.1.4 Market size and forecast, by End Use Industry
        • 8.5.6.2 Saudi Arabia
          • 8.5.6.2.1 Market size and forecast, by Source
          • 8.5.6.2.2 Market size and forecast, by Product
          • 8.5.6.2.3 Market size and forecast, by Application
          • 8.5.6.2.4 Market size and forecast, by End Use Industry
        • 8.5.6.3 South Africa
          • 8.5.6.3.1 Market size and forecast, by Source
          • 8.5.6.3.2 Market size and forecast, by Product
          • 8.5.6.3.3 Market size and forecast, by Application
          • 8.5.6.3.4 Market size and forecast, by End Use Industry
        • 8.5.6.4 Rest of LAMEA
          • 8.5.6.4.1 Market size and forecast, by Source
          • 8.5.6.4.2 Market size and forecast, by Product
          • 8.5.6.4.3 Market size and forecast, by Application
          • 8.5.6.4.4 Market size and forecast, by End Use Industry
  • CHAPTER 9: COMPANY LANDSCAPE

    • 9.1. Introduction

    • 9.2. Top winning strategies

    • 9.3. Product Mapping of Top 10 Player

    • 9.4. Competitive Dashboard

    • 9.5. Competitive Heatmap

    • 9.6. Key developments

  • CHAPTER 10: COMPANY PROFILES

    • 10.1 Braskem S.A.

      • 10.1.1 Company overview

      • 10.1.2 Company snapshot

      • 10.1.3 Operating business segments

      • 10.1.4 Product portfolio

      • 10.1.5 Business performance

      • 10.1.6 Key strategic moves and developments

    • 10.2 BP Plc

      • 10.2.1 Company overview

      • 10.2.2 Company snapshot

      • 10.2.3 Operating business segments

      • 10.2.4 Product portfolio

      • 10.2.5 Business performance

      • 10.2.6 Key strategic moves and developments

    • 10.3 Cargill Incorporated

      • 10.3.1 Company overview

      • 10.3.2 Company snapshot

      • 10.3.3 Operating business segments

      • 10.3.4 Product portfolio

      • 10.3.5 Business performance

      • 10.3.6 Key strategic moves and developments

    • 10.4 INEOS

      • 10.4.1 Company overview

      • 10.4.2 Company snapshot

      • 10.4.3 Operating business segments

      • 10.4.4 Product portfolio

      • 10.4.5 Business performance

      • 10.4.6 Key strategic moves and developments

    • 10.5 HPCL Biofuels Limited

      • 10.5.1 Company overview

      • 10.5.2 Company snapshot

      • 10.5.3 Operating business segments

      • 10.5.4 Product portfolio

      • 10.5.5 Business performance

      • 10.5.6 Key strategic moves and developments

    • 10.6 LyondellBasell Industries Holdings BV

      • 10.6.1 Company overview

      • 10.6.2 Company snapshot

      • 10.6.3 Operating business segments

      • 10.6.4 Product portfolio

      • 10.6.5 Business performance

      • 10.6.6 Key strategic moves and developments

    • 10.7 Mitsubishi Chemical Corporation

      • 10.7.1 Company overview

      • 10.7.2 Company snapshot

      • 10.7.3 Operating business segments

      • 10.7.4 Product portfolio

      • 10.7.5 Business performance

      • 10.7.6 Key strategic moves and developments

    • 10.8 SABIC

      • 10.8.1 Company overview

      • 10.8.2 Company snapshot

      • 10.8.3 Operating business segments

      • 10.8.4 Product portfolio

      • 10.8.5 Business performance

      • 10.8.6 Key strategic moves and developments

    • 10.9 Sasol Limited

      • 10.9.1 Company overview

      • 10.9.2 Company snapshot

      • 10.9.3 Operating business segments

      • 10.9.4 Product portfolio

      • 10.9.5 Business performance

      • 10.9.6 Key strategic moves and developments

    • 10.10 Solvay SA

      • 10.10.1 Company overview

      • 10.10.2 Company snapshot

      • 10.10.3 Operating business segments

      • 10.10.4 Product portfolio

      • 10.10.5 Business performance

      • 10.10.6 Key strategic moves and developments

  • LIST OF TABLES

  • TABLE 01. PRICING ANALYSIS, BY SOURCE, 2021–2031 ($/LITER)
    TABLE 02. PRICING ANALYSIS, BY REGION, 2021–2031 ($/LITER)
    TABLE 03. GLOBAL FUEL ETHANOL MARKET, BY SOURCE, 2021-2031 ($MILLION)
    TABLE 04. GLOBAL FUEL ETHANOL MARKET, BY SOURCE, 2021-2031 (MILLION LITERS)
    TABLE 05. FUEL ETHANOL MARKET REVENUE, FOR SYNTHETIC, BY REGION, 2021-2031 ($MILLION)
    TABLE 06. FUEL ETHANOL MARKET REVENUE, FOR SYNTHETIC, BY REGION, 2021-2031 (MILLION LITERS)
    TABLE 07. FUEL ETHANOL MARKET REVENUE, FOR NATURAL, BY REGION, 2021-2031 ($MILLION)
    TABLE 08. FUEL ETHANOL MARKET REVENUE, FOR NATURAL, BY REGION, 2021-2031 (MILLION LITERS)
    TABLE 09. GLOBAL FUEL ETHANOL MARKET, BY PRODUCT, 2021-2031 ($MILLION)
    TABLE 10. GLOBAL FUEL ETHANOL MARKET, BY PRODUCT, 2021-2031 (MILLION LITERS)
    TABLE 11. FUEL ETHANOL MARKET REVENUE, FOR STARCH-BASED, BY REGION, 2021-2031 ($MILLION)
    TABLE 12. FUEL ETHANOL MARKET REVENUE, FOR STARCH-BASED, BY REGION, 2021-2031 (MILLION LITERS)
    TABLE 13. FUEL ETHANOL MARKET REVENUE, FOR SUGAR-BASED, BY REGION, 2021-2031 ($MILLION)
    TABLE 14. FUEL ETHANOL MARKET REVENUE, FOR SUGAR-BASED, BY REGION, 2021-2031 (MILLION LITERS)
    TABLE 15. FUEL ETHANOL MARKET REVENUE, FOR CELLULOSIC, BY REGION, 2021-2031 ($MILLION)
    TABLE 16. FUEL ETHANOL MARKET REVENUE, FOR CELLULOSIC, BY REGION, 2021-2031 (MILLION LITERS)
    TABLE 17. GLOBAL FUEL ETHANOL MARKET, BY APPLICATION, 2021-2031 ($MILLION)
    TABLE 18. GLOBAL FUEL ETHANOL MARKET, BY APPLICATION, 2021-2031 (MILLION LITERS)
    TABLE 19. FUEL ETHANOL MARKET REVENUE, FOR CONVENTIONAL VEHICLES, BY REGION, 2021-2031 ($MILLION)
    TABLE 20. FUEL ETHANOL MARKET REVENUE, FOR CONVENTIONAL VEHICLES, BY REGION, 2021-2031 (MILLION LITERS)
    TABLE 21. FUEL ETHANOL MARKET REVENUE, FOR FLEXIBLE FUEL VEHICLES, BY REGION, 2021-2031 ($MILLION)
    TABLE 22. FUEL ETHANOL MARKET REVENUE, FOR FLEXIBLE FUEL VEHICLES, BY REGION, 2021-2031 (MILLION LITERS)
    TABLE 23. GLOBAL FUEL ETHANOL MARKET, BY END-USE INDUSTRY, 2021-2031 ($MILLION)
    TABLE 24. GLOBAL FUEL ETHANOL MARKET, BY END-USE INDUSTRY, 2021-2031 (MILLION LITERS)
    TABLE 25. FUEL ETHANOL MARKET REVENUE, FOR AUTOMOTIVE, BY REGION, 2021-2031 ($MILLION)
    TABLE 26. FUEL ETHANOL MARKET REVENUE, FOR AUTOMOTIVE, BY REGION, 2021-2031 (MILLION LITERS)
    TABLE 27. FUEL ETHANOL MARKET REVENUE, FOR OIL AND GAS, BY REGION, 2021-2031 ($MILLION)
    TABLE 28. FUEL ETHANOL MARKET REVENUE, FOR OIL AND GAS, BY REGION, 2021-2031 (MILLION LITERS)
    TABLE 29. FUEL ETHANOL MARKET REVENUE, FOR OTHERS, BY REGION, 2021-2031 ($MILLION)
    TABLE 30. FUEL ETHANOL MARKET REVENUE, FOR OTHERS, BY REGION, 2021-2031 (MILLION LITERS)
    TABLE 31. FUEL ETHANOL MARKET, BY REGION, 2021-2031 ($MILLION)
    TABLE 32. FUEL ETHANOL MARKET, BY REGION, 2021-2031 (MILLION LITERS)
    TABLE 33. NORTH AMERICA FUEL ETHANOL MARKET, BY SOURCE, 2021-2031 ($MILLION)
    TABLE 34. NORTH AMERICA FUEL ETHANOL MARKET, BY SOURCE, 2021-2031 (MILLION LITERS)
    TABLE 35. NORTH AMERICA FUEL ETHANOL MARKET, BY PRODUCT, 2021-2031 ($MILLION)
    TABLE 36. NORTH AMERICA FUEL ETHANOL MARKET, BY PRODUCT, 2021-2031 (MILLION LITERS)
    TABLE 37. NORTH AMERICA FUEL ETHANOL MARKET, BY APPLICATION, 2021-2031 ($MILLION)
    TABLE 38. NORTH AMERICA FUEL ETHANOL MARKET, BY APPLICATION, 2021-2031 (MILLION LITERS)
    TABLE 39. NORTH AMERICA FUEL ETHANOL MARKET, BY END-USE INDUSTRY, 2021-2031 ($MILLION)
    TABLE 40. NORTH AMERICA FUEL ETHANOL MARKET, BY END-USE INDUSTRY, 2021-2031 (MILLION LITERS)
    TABLE 41. NORTH AMERICA FUEL ETHANOL MARKET, BY COUNTRY, 2021-2031 ($MILLION)
    TABLE 42. NORTH AMERICA FUEL ETHANOL MARKET, BY COUNTRY, 2021-2031 (MILLION LITERS)
    TABLE 43. U.S. FUEL ETHANOL MARKET BY SOURCE 2021-2031 ($MILLION)
    TABLE 44. U.S. FUEL ETHANOL MARKET BY SOURCE 2021-2031 (MILLION LITERS)
    TABLE 45. U.S. FUEL ETHANOL MARKET BY PRODUCT 2021-2031 ($MILLION)
    TABLE 46. U.S. FUEL ETHANOL MARKET BY PRODUCT 2021-2031 (MILLION LITERS)
    TABLE 47. U.S. FUEL ETHANOL MARKET BY APPLICATION 2021-2031 ($MILLION)
    TABLE 48. U.S. FUEL ETHANOL MARKET BY APPLICATION 2021-2031 (MILLION LITERS)
    TABLE 49. U.S. FUEL ETHANOL MARKET BY END-USE INDUSTRY 2021-2031 ($MILLION)
    TABLE 50. U.S. FUEL ETHANOL MARKET BY END-USE INDUSTRY 2021-2031 (MILLION LITERS)
    TABLE 51. CANADA FUEL ETHANOL MARKET BY SOURCE 2021-2031 ($MILLION)
    TABLE 52. CANADA FUEL ETHANOL MARKET BY SOURCE 2021-2031 (MILLION LITERS)
    TABLE 53. CANADA FUEL ETHANOL MARKET BY PRODUCT 2021-2031 ($MILLION)
    TABLE 54. CANADA FUEL ETHANOL MARKET BY PRODUCT 2021-2031 (MILLION LITERS)
    TABLE 55. CANADA FUEL ETHANOL MARKET BY APPLICATION 2021-2031 ($MILLION)
    TABLE 56. CANADA FUEL ETHANOL MARKET BY APPLICATION 2021-2031 (MILLION LITERS)
    TABLE 57. CANADA FUEL ETHANOL MARKET BY END-USE INDUSTRY 2021-2031 ($MILLION)
    TABLE 58. CANADA FUEL ETHANOL MARKET BY END-USE INDUSTRY 2021-2031 (MILLION LITERS)
    TABLE 59. MEXICO FUEL ETHANOL MARKET BY SOURCE 2021-2031 ($MILLION)
    TABLE 60. MEXICO FUEL ETHANOL MARKET BY SOURCE 2021-2031 (MILLION LITERS)
    TABLE 61. MEXICO FUEL ETHANOL MARKET BY PRODUCT 2021-2031 ($MILLION)
    TABLE 62. MEXICO FUEL ETHANOL MARKET BY PRODUCT 2021-2031 (MILLION LITERS)
    TABLE 63. MEXICO FUEL ETHANOL MARKET BY APPLICATION 2021-2031 ($MILLION)
    TABLE 64. MEXICO FUEL ETHANOL MARKET BY APPLICATION 2021-2031 (MILLION LITERS)
    TABLE 65. MEXICO FUEL ETHANOL MARKET BY END-USE INDUSTRY 2021-2031 ($MILLION)
    TABLE 66. MEXICO FUEL ETHANOL MARKET BY END-USE INDUSTRY 2021-2031 (MILLION LITERS)
    TABLE 67. EUROPE FUEL ETHANOL MARKET, BY SOURCE, 2021-2031 ($MILLION)
    TABLE 68. EUROPE FUEL ETHANOL MARKET, BY SOURCE, 2021-2031 (MILLION LITERS)
    TABLE 69. EUROPE FUEL ETHANOL MARKET, BY PRODUCT, 2021-2031 ($MILLION)
    TABLE 70. EUROPE FUEL ETHANOL MARKET, BY PRODUCT, 2021-2031 (MILLION LITERS)
    TABLE 71. EUROPE FUEL ETHANOL MARKET, BY APPLICATION, 2021-2031 ($MILLION)
    TABLE 72. EUROPE FUEL ETHANOL MARKET, BY APPLICATION, 2021-2031 (MILLION LITERS)
    TABLE 73. EUROPE FUEL ETHANOL MARKET, BY END-USE INDUSTRY, 2021-2031 ($MILLION)
    TABLE 74. EUROPE FUEL ETHANOL MARKET, BY END-USE INDUSTRY, 2021-2031 (MILLION LITERS)
    TABLE 75. EUROPE FUEL ETHANOL MARKET, BY COUNTRY, 2021-2031 ($MILLION)
    TABLE 76. EUROPE FUEL ETHANOL MARKET, BY COUNTRY, 2021-2031 (MILLION LITERS)
    TABLE 77. U.K. FUEL ETHANOL MARKET BY SOURCE 2021-2031 ($MILLION)
    TABLE 78. U.K. FUEL ETHANOL MARKET BY SOURCE 2021-2031 (MILLION LITERS)
    TABLE 79. U.K. FUEL ETHANOL MARKET BY PRODUCT 2021-2031 ($MILLION)
    TABLE 80. U.K. FUEL ETHANOL MARKET BY PRODUCT 2021-2031 (MILLION LITERS)
    TABLE 81. U.K. FUEL ETHANOL MARKET BY APPLICATION 2021-2031 ($MILLION)
    TABLE 82. U.K. FUEL ETHANOL MARKET BY APPLICATION 2021-2031 (MILLION LITERS)
    TABLE 83. U.K. FUEL ETHANOL MARKET BY END-USE INDUSTRY 2021-2031 ($MILLION)
    TABLE 84. U.K. FUEL ETHANOL MARKET BY END-USE INDUSTRY 2021-2031 (MILLION LITERS)
    TABLE 85. GERMANY FUEL ETHANOL MARKET BY SOURCE 2021-2031 ($MILLION)
    TABLE 86. GERMANY FUEL ETHANOL MARKET BY SOURCE 2021-2031 (MILLION LITERS)
    TABLE 87. GERMANY FUEL ETHANOL MARKET BY PRODUCT 2021-2031 ($MILLION)
    TABLE 88. GERMANY FUEL ETHANOL MARKET BY PRODUCT 2021-2031 (MILLION LITERS)
    TABLE 89. GERMANY FUEL ETHANOL MARKET BY APPLICATION 2021-2031 ($MILLION)
    TABLE 90. GERMANY FUEL ETHANOL MARKET BY APPLICATION 2021-2031 (MILLION LITERS)
    TABLE 91. GERMANY FUEL ETHANOL MARKET BY END-USE INDUSTRY 2021-2031 ($MILLION)
    TABLE 92. GERMANY FUEL ETHANOL MARKET BY END-USE INDUSTRY 2021-2031 (MILLION LITERS)
    TABLE 93. FRANCE FUEL ETHANOL MARKET BY SOURCE 2021-2031 ($MILLION)
    TABLE 94. FRANCE FUEL ETHANOL MARKET BY SOURCE 2021-2031 (MILLION LITERS)
    TABLE 95. FRANCE FUEL ETHANOL MARKET BY PRODUCT 2021-2031 ($MILLION)
    TABLE 96. FRANCE FUEL ETHANOL MARKET BY PRODUCT 2021-2031 (MILLION LITERS)
    TABLE 97. FRANCE FUEL ETHANOL MARKET BY APPLICATION 2021-2031 ($MILLION)
    TABLE 98. FRANCE FUEL ETHANOL MARKET BY APPLICATION 2021-2031 (MILLION LITERS)
    TABLE 99. FRANCE FUEL ETHANOL MARKET BY END-USE INDUSTRY 2021-2031 ($MILLION)
    TABLE 100. FRANCE FUEL ETHANOL MARKET BY END-USE INDUSTRY 2021-2031 (MILLION LITERS)
    TABLE 101. SPAIN FUEL ETHANOL MARKET BY SOURCE 2021-2031 ($MILLION)
    TABLE 102. SPAIN FUEL ETHANOL MARKET BY SOURCE 2021-2031 (MILLION LITERS)
    TABLE 103. SPAIN FUEL ETHANOL MARKET BY PRODUCT 2021-2031 ($MILLION)
    TABLE 104. SPAIN FUEL ETHANOL MARKET BY PRODUCT 2021-2031 (MILLION LITERS)
    TABLE 105. SPAIN FUEL ETHANOL MARKET BY APPLICATION 2021-2031 ($MILLION)
    TABLE 106. SPAIN FUEL ETHANOL MARKET BY APPLICATION 2021-2031 (MILLION LITERS)
    TABLE 107. SPAIN FUEL ETHANOL MARKET BY END-USE INDUSTRY 2021-2031 ($MILLION)
    TABLE 108. SPAIN FUEL ETHANOL MARKET BY END-USE INDUSTRY 2021-2031 (MILLION LITERS)
    TABLE 109. ITALY FUEL ETHANOL MARKET BY SOURCE 2021-2031 ($MILLION)
    TABLE 110. ITALY FUEL ETHANOL MARKET BY SOURCE 2021-2031 (MILLION LITERS)
    TABLE 111. ITALY FUEL ETHANOL MARKET BY PRODUCT 2021-2031 ($MILLION)
    TABLE 112. ITALY FUEL ETHANOL MARKET BY PRODUCT 2021-2031 (MILLION LITERS)
    TABLE 113. ITALY FUEL ETHANOL MARKET BY APPLICATION 2021-2031 ($MILLION)
    TABLE 114. ITALY FUEL ETHANOL MARKET BY APPLICATION 2021-2031 (MILLION LITERS)
    TABLE 115. ITALY FUEL ETHANOL MARKET BY END-USE INDUSTRY 2021-2031 ($MILLION)
    TABLE 116. ITALY FUEL ETHANOL MARKET BY END-USE INDUSTRY 2021-2031 (MILLION LITERS)
    TABLE 117. REST OF EUROPE FUEL ETHANOL MARKET BY SOURCE 2021-2031 ($MILLION)
    TABLE 118. REST OF EUROPE FUEL ETHANOL MARKET BY SOURCE 2021-2031 (MILLION LITERS)
    TABLE 119. REST OF EUROPE FUEL ETHANOL MARKET BY PRODUCT 2021-2031 ($MILLION)
    TABLE 120. REST OF EUROPE FUEL ETHANOL MARKET BY PRODUCT 2021-2031 (MILLION LITERS)
    TABLE 121. REST OF EUROPE FUEL ETHANOL MARKET BY APPLICATION 2021-2031 ($MILLION)
    TABLE 122. REST OF EUROPE FUEL ETHANOL MARKET BY APPLICATION 2021-2031 (MILLION LITERS)
    TABLE 123. REST OF EUROPE FUEL ETHANOL MARKET BY END-USE INDUSTRY 2021-2031 ($MILLION)
    TABLE 124. REST OF EUROPE FUEL ETHANOL MARKET BY END-USE INDUSTRY 2021-2031 (MILLION LITERS)
    TABLE 125. ASIA-PACIFIC FUEL ETHANOL MARKET, BY SOURCE, 2021-2031 ($MILLION)
    TABLE 126. ASIA-PACIFIC FUEL ETHANOL MARKET, BY SOURCE, 2021-2031 (MILLION LITERS)
    TABLE 127. ASIA-PACIFIC FUEL ETHANOL MARKET, BY PRODUCT, 2021-2031 ($MILLION)
    TABLE 128. ASIA-PACIFIC FUEL ETHANOL MARKET, BY PRODUCT, 2021-2031 (MILLION LITERS)
    TABLE 129. ASIA-PACIFIC FUEL ETHANOL MARKET, BY APPLICATION, 2021-2031 ($MILLION)
    TABLE 130. ASIA-PACIFIC FUEL ETHANOL MARKET, BY APPLICATION, 2021-2031 (MILLION LITERS)
    TABLE 131. ASIA-PACIFIC FUEL ETHANOL MARKET, BY END-USE INDUSTRY, 2021-2031 ($MILLION)
    TABLE 132. ASIA-PACIFIC FUEL ETHANOL MARKET, BY END-USE INDUSTRY, 2021-2031 (MILLION LITERS)
    TABLE 133. ASIA-PACIFIC FUEL ETHANOL MARKET, BY COUNTRY, 2021-2031 ($MILLION)
    TABLE 134. ASIA-PACIFIC FUEL ETHANOL MARKET, BY COUNTRY, 2021-2031 (MILLION LITERS)
    TABLE 135. CHINA FUEL ETHANOL MARKET BY SOURCE 2021-2031 ($MILLION)
    TABLE 136. CHINA FUEL ETHANOL MARKET BY SOURCE 2021-2031 (MILLION LITERS)
    TABLE 137. CHINA FUEL ETHANOL MARKET BY PRODUCT 2021-2031 ($MILLION)
    TABLE 138. CHINA FUEL ETHANOL MARKET BY PRODUCT 2021-2031 (MILLION LITERS)
    TABLE 139. CHINA FUEL ETHANOL MARKET BY APPLICATION 2021-2031 ($MILLION)
    TABLE 140. CHINA FUEL ETHANOL MARKET BY APPLICATION 2021-2031 (MILLION LITERS)
    TABLE 141. CHINA FUEL ETHANOL MARKET BY END-USE INDUSTRY 2021-2031 ($MILLION)
    TABLE 142. CHINA FUEL ETHANOL MARKET BY END-USE INDUSTRY 2021-2031 (MILLION LITERS)
    TABLE 143. JAPAN FUEL ETHANOL MARKET BY SOURCE 2021-2031 ($MILLION)
    TABLE 144. JAPAN FUEL ETHANOL MARKET BY SOURCE 2021-2031 (MILLION LITERS)
    TABLE 145. JAPAN FUEL ETHANOL MARKET BY PRODUCT 2021-2031 ($MILLION)
    TABLE 146. JAPAN FUEL ETHANOL MARKET BY PRODUCT 2021-2031 (MILLION LITERS)
    TABLE 147. JAPAN FUEL ETHANOL MARKET BY APPLICATION 2021-2031 ($MILLION)
    TABLE 148. JAPAN FUEL ETHANOL MARKET BY APPLICATION 2021-2031 (MILLION LITERS)
    TABLE 149. JAPAN FUEL ETHANOL MARKET BY END-USE INDUSTRY 2021-2031 ($MILLION)
    TABLE 150. JAPAN FUEL ETHANOL MARKET BY END-USE INDUSTRY 2021-2031 (MILLION LITERS)
    TABLE 151. INDIA FUEL ETHANOL MARKET BY SOURCE 2021-2031 ($MILLION)
    TABLE 152. INDIA FUEL ETHANOL MARKET BY SOURCE 2021-2031 (MILLION LITERS)
    TABLE 153. INDIA FUEL ETHANOL MARKET BY PRODUCT 2021-2031 ($MILLION)
    TABLE 154. INDIA FUEL ETHANOL MARKET BY PRODUCT 2021-2031 (MILLION LITERS)
    TABLE 155. INDIA FUEL ETHANOL MARKET BY APPLICATION 2021-2031 ($MILLION)
    TABLE 156. INDIA FUEL ETHANOL MARKET BY APPLICATION 2021-2031 (MILLION LITERS)
    TABLE 157. INDIA FUEL ETHANOL MARKET BY END-USE INDUSTRY 2021-2031 ($MILLION)
    TABLE 158. INDIA FUEL ETHANOL MARKET BY END-USE INDUSTRY 2021-2031 (MILLION LITERS)
    TABLE 159. SOUTH KOREA FUEL ETHANOL MARKET BY SOURCE 2021-2031 ($MILLION)
    TABLE 160. SOUTH KOREA FUEL ETHANOL MARKET BY SOURCE 2021-2031 (MILLION LITERS)
    TABLE 161. SOUTH KOREA FUEL ETHANOL MARKET BY PRODUCT 2021-2031 ($MILLION)
    TABLE 162. SOUTH KOREA FUEL ETHANOL MARKET BY PRODUCT 2021-2031 (MILLION LITERS)
    TABLE 163. SOUTH KOREA FUEL ETHANOL MARKET BY APPLICATION 2021-2031 ($MILLION)
    TABLE 164. SOUTH KOREA FUEL ETHANOL MARKET BY APPLICATION 2021-2031 (MILLION LITERS)
    TABLE 165. SOUTH KOREA FUEL ETHANOL MARKET BY END-USE INDUSTRY 2021-2031 ($MILLION)
    TABLE 166. SOUTH KOREA FUEL ETHANOL MARKET BY END-USE INDUSTRY 2021-2031 (MILLION LITERS)
    TABLE 167. REST OF ASIA PACIFIC FUEL ETHANOL MARKET BY SOURCE 2021-2031 ($MILLION)
    TABLE 168. REST OF ASIA PACIFIC FUEL ETHANOL MARKET BY SOURCE 2021-2031 (MILLION LITERS)
    TABLE 169. REST OF ASIA PACIFIC FUEL ETHANOL MARKET BY PRODUCT 2021-2031 ($MILLION)
    TABLE 170. REST OF ASIA PACIFIC FUEL ETHANOL MARKET BY PRODUCT 2021-2031 (MILLION LITERS)
    TABLE 171. REST OF ASIA PACIFIC FUEL ETHANOL MARKET BY APPLICATION 2021-2031 ($MILLION)
    TABLE 172. REST OF ASIA PACIFIC FUEL ETHANOL MARKET BY APPLICATION 2021-2031 (MILLION LITERS)
    TABLE 173. REST OF ASIA PACIFIC FUEL ETHANOL MARKET BY END-USE INDUSTRY 2021-2031 ($MILLION)
    TABLE 174. REST OF ASIA PACIFIC FUEL ETHANOL MARKET BY END-USE INDUSTRY 2021-2031 (MILLION LITERS)
    TABLE 175. LAMEA FUEL ETHANOL MARKET, BY SOURCE, 2021-2031 ($MILLION)
    TABLE 176. LAMEA FUEL ETHANOL MARKET, BY SOURCE, 2021-2031 (MILLION LITERS)
    TABLE 177. LAMEA FUEL ETHANOL MARKET, BY PRODUCT, 2021-2031 ($MILLION)
    TABLE 178. LAMEA FUEL ETHANOL MARKET, BY PRODUCT, 2021-2031 (MILLION LITERS)
    TABLE 179. LAMEA FUEL ETHANOL MARKET, BY APPLICATION, 2021-2031 ($MILLION)
    TABLE 180. LAMEA FUEL ETHANOL MARKET, BY APPLICATION, 2021-2031 (MILLION LITERS)
    TABLE 181. LAMEA FUEL ETHANOL MARKET, BY END-USE INDUSTRY, 2021-2031 ($MILLION)
    TABLE 182. LAMEA FUEL ETHANOL MARKET, BY END-USE INDUSTRY, 2021-2031 (MILLION LITERS)
    TABLE 183. LAMEA FUEL ETHANOL MARKET, BY COUNTRY, 2021-2031 ($MILLION)
    TABLE 184. LAMEA FUEL ETHANOL MARKET, BY COUNTRY, 2021-2031 (MILLION LITERS)
    TABLE 185. BRAZIL FUEL ETHANOL MARKET BY SOURCE 2021-2031 ($MILLION)
    TABLE 186. BRAZIL FUEL ETHANOL MARKET BY SOURCE 2021-2031 (MILLION LITERS)
    TABLE 187. BRAZIL FUEL ETHANOL MARKET BY PRODUCT 2021-2031 ($MILLION)
    TABLE 188. BRAZIL FUEL ETHANOL MARKET BY PRODUCT 2021-2031 (MILLION LITERS)
    TABLE 189. BRAZIL FUEL ETHANOL MARKET BY APPLICATION 2021-2031 ($MILLION)
    TABLE 190. BRAZIL FUEL ETHANOL MARKET BY APPLICATION 2021-2031 (MILLION LITERS)
    TABLE 191. BRAZIL FUEL ETHANOL MARKET BY END-USE INDUSTRY 2021-2031 ($MILLION)
    TABLE 192. BRAZIL FUEL ETHANOL MARKET BY END-USE INDUSTRY 2021-2031 (MILLION LITERS)
    TABLE 193. SAUDI ARABIA FUEL ETHANOL MARKET BY SOURCE 2021-2031 ($MILLION)
    TABLE 194. SAUDI ARABIA FUEL ETHANOL MARKET BY SOURCE 2021-2031 (MILLION LITERS)
    TABLE 195. SAUDI ARABIA FUEL ETHANOL MARKET BY PRODUCT 2021-2031 ($MILLION)
    TABLE 196. SAUDI ARABIA FUEL ETHANOL MARKET BY PRODUCT 2021-2031 (MILLION LITERS)
    TABLE 197. SAUDI ARABIA FUEL ETHANOL MARKET BY APPLICATION 2021-2031 ($MILLION)
    TABLE 198. SAUDI ARABIA FUEL ETHANOL MARKET BY APPLICATION 2021-2031 (MILLION LITERS)
    TABLE 199. SAUDI ARABIA FUEL ETHANOL MARKET BY END-USE INDUSTRY 2021-2031 ($MILLION)
    TABLE 200. SAUDI ARABIA FUEL ETHANOL MARKET BY END-USE INDUSTRY 2021-2031 (MILLION LITERS)
    TABLE 201. SOUTH AFRICA FUEL ETHANOL MARKET BY SOURCE 2021-2031 ($MILLION)
    TABLE 202. SOUTH AFRICA FUEL ETHANOL MARKET BY SOURCE 2021-2031 (MILLION LITERS)
    TABLE 203. SOUTH AFRICA FUEL ETHANOL MARKET BY PRODUCT 2021-2031 ($MILLION)
    TABLE 204. SOUTH AFRICA FUEL ETHANOL MARKET BY PRODUCT 2021-2031 (MILLION LITERS)
    TABLE 205. SOUTH AFRICA FUEL ETHANOL MARKET BY APPLICATION 2021-2031 ($MILLION)
    TABLE 206. SOUTH AFRICA FUEL ETHANOL MARKET BY APPLICATION 2021-2031 (MILLION LITERS)
    TABLE 207. SOUTH AFRICA FUEL ETHANOL MARKET BY END-USE INDUSTRY 2021-2031 ($MILLION)
    TABLE 208. SOUTH AFRICA FUEL ETHANOL MARKET BY END-USE INDUSTRY 2021-2031 (MILLION LITERS)
    TABLE 209. REST OF LAMEA FUEL ETHANOL MARKET BY SOURCE 2021-2031 ($MILLION)
    TABLE 210. REST OF LAMEA FUEL ETHANOL MARKET BY SOURCE 2021-2031 (MILLION LITERS)
    TABLE 211. REST OF LAMEA FUEL ETHANOL MARKET BY PRODUCT 2021-2031 ($MILLION)
    TABLE 212. REST OF LAMEA FUEL ETHANOL MARKET BY PRODUCT 2021-2031 (MILLION LITERS)
    TABLE 213. REST OF LAMEA FUEL ETHANOL MARKET BY APPLICATION 2021-2031 ($MILLION)
    TABLE 214. REST OF LAMEA FUEL ETHANOL MARKET BY APPLICATION 2021-2031 (MILLION LITERS)
    TABLE 215. REST OF LAMEA FUEL ETHANOL MARKET BY END-USE INDUSTRY 2021-2031 ($MILLION)
    TABLE 216. REST OF LAMEA FUEL ETHANOL MARKET BY END-USE INDUSTRY 2021-2031 (MILLION LITERS)
    TABLE 217. OTHER KEY DEVELOPMENTS (2020-2022)
    TABLE 218. BRASKEM: KEY EXECUTIVES
    TABLE 219. BRASKEM: COMPANY SNAPSHOT
    TABLE 220. BRASKEM: PRODUCT PORTFOLIO
    TABLE 221. OVERALL FINANCIAL STATUS ($MILLION)
    TABLE 222. BRASKEM: KEY STRATEGIC MOVES AND DEVELOPMENTS
    TABLE 223. BP PLC: KEY EXECUTIVES
    TABLE 224. BP PLC: COMPANY SNAPSHOT
    TABLE 225. BP PLC: NET SALES, 2018–2020 ($MILLION)
    TABLE 226. CARGILL INC.: KEY EXECUTIVES
    TABLE 227. CARGILL INC.: COMPANY SNAPSHOT
    TABLE 228. CARGILL INC.: PRODUCT PORTFOLIO
    TABLE 229. CARGILL INC.: KEY STRATEGIC MOVES AND DEVELOPMENTS
    TABLE 230. INEOS: KEY EXECUTIVES
    TABLE 231. INEOS: COMPANY SNAPSHOT
    TABLE 232. INEOS: OPERATING SEGMENTS
    TABLE 233. INEOS: PRODUCT PORTFOLIO
    TABLE 234. INEOS: NET SALES, 2018–2020 ($MILLION)
    TABLE 235. HPCL BIOFUELS LTD.: KEY EXECUTIVES
    TABLE 236. HPCL BIOFUELS LTD.: COMPANY SNAPSHOT
    TABLE 237. HPCL BIOFUELS LTD.: OPERATING SEGMENTS
    TABLE 238. HPCL BIOFUELS LTD.: NET SALES, 2018–2020 ($MILLION)
    TABLE 239. LYONDELLBASELL: KEY EXECUTIVES
    TABLE 240. LYONDELLBASELL: COMPANY SNAPSHOT
    TABLE 241. LYONDELLBASELL: PRODUCT PORTFOLIO
    TABLE 242. LYONDELLBASELL: NET SALES, 2018–2020 ($MILLION)
    TABLE 243. MITSUBISHI CHEMICAL CORPORATION: KEY EXECUTIVES
    TABLE 244. MITSUBISHI CHEMICAL CORPORATION.: COMPANY SNAPSHOT
    TABLE 245. MITSUBISHI CHEMICAL CORPORATION: OPERATING SEGMENTS
    TABLE 246. MITSUBISHI CHEMICAL CORPORATION: PRODUCT PORTFOLIO
    TABLE 247. OVERALL FINANCIAL STATUS ($MILLION)
    TABLE 248. SABIC: KEY EXECUTIVES
    TABLE 249. SABIC: COMPANY SNAPSHOT
    TABLE 250. SABIC: OPERATING SEGMENTS
    TABLE 251. SABIC: PRODUCT PORTFOLIO
    TABLE 252. SABIC: NET SALES, 2018–2020 ($MILLION)
    TABLE 253. SASOL LIMITED: KEY EXECUTIVES
    TABLE 254. SASOL LIMITED: COMPANY SNAPSHOT
    TABLE 255. SASOL LIMITED: OPERATING SEGMENTS
    TABLE 256. SASOL LIMITED: PRODUCT PORTFOLIO
    TABLE 257. OVERALL FINANCIAL STATUS ($MILLION)
    TABLE 258. SOLVAY S.A.: KEY EXECUTIVES
    TABLE 259. SOLVAY S.A.: COMPANY SNAPSHOT
    TABLE 260. SOLVAY S.A.: OPERATING SEGMENTS
    TABLE 261. OVERALL FINANCIAL STATUS ($MILLION)
    TABLE 262. SOLVAY S.A.: KEY STRATEGIC MOVES AND DEVELOPMENTS
  • LIST OF FIGURES

  • FIGURE 01. FUEL ETHANOL MARKET SNAPSHOT, BY SEGMENTATION, 2022–2031
    FIGURE 02. FUEL ETHANOL MARKET SNAPSHOT, BY REGION, 2022–2031
    FIGURE 03. FUEL ETHANOL MARKET SEGMENTATION
    FIGURE 04. TOP INVESTMENT POCKETS
    FIGURE 05. HIGH BARGAINING POWER OF SUPPLIERS
    FIGURE 06. MODERATE BARGAINING POWER OF BUYERS
    FIGURE 07. HIGH THREAT OF NEW ENTRANTS
    FIGURE 08. MODERATE THREAT OF SUBSTITUTES
    FIGURE 09. HIGH COMPETITIVE RIVALRY
    FIGURE 10. FUEL ETHANOL MARKET DYNAMICS
    FIGURE 11. VALUE CHAIN ANALYSIS
    FIGURE 12. FUEL ETHANOL MARKET, BY SOURCE, 2022–2031 ($MILLION)
    FIGURE 13. COMPARATIVE ANALYSIS OF SYNTHETIC SOURCE MARKET, BY COUNTRY, 2022 & 2031 ($MILLION)
    FIGURE 14. COMPARATIVE ANALYSIS OF NATURAL SOURCE MARKET, BY COUNTRY, 2022 & 2031 ($MILLION)
    FIGURE 15. FUEL ETHANOL MARKET, BY PRODUCT, 2022–2031 ($MILLION)
    FIGURE 16. COMPARATIVE ANALYSIS OF FUEL ETHANOL MARKET FOR STARCH-BASED, BY COUNTRY, 2022 & 2031 ($MILLION)
    FIGURE 17. COMPARATIVE ANALYSIS OF FUEL ETHANOL MARKET FOR SUGAR-BASED, BY COUNTRY, 2022 & 2031 ($MILLION)
    FIGURE 18. COMPARATIVE ANALYSIS OF FUEL ETHANOL MARKET FOR CELLULOSIC, BY COUNTRY, 2022 & 2031 ($MILLION)
    FIGURE 19. FUEL ETHANOL MARKET, BY APPLICATION, 2022–2031 ($MILLION)
    FIGURE 20. COMPARATIVE ANALYSIS OF FUEL ETHANOL MARKET FOR CONVENTIONAL VEHICLES, BY COUNTRY, 2022 & 2031 ($MILLION)
    FIGURE 21. COMPARATIVE ANALYSIS OF FUEL ETHANOL MARKET FOR FLEXIBLE FUEL VEHICLES, BY COUNTRY, 2022 & 2031 ($MILLION)
    FIGURE 22. FUEL ETHANOL MARKET, BY END-USE INDUSTRY, 2022–2031 ($MILLION)
    FIGURE 23. COMPARATIVE ANALYSIS OF FUEL ETHANOL MARKET FOR AUTOMOTIVE, BY COUNTRY, 2022 & 2031 ($MILLION)
    FIGURE 24. COMPARATIVE ANALYSIS OF FUEL ETHANOL MARKET FOR OIL AND GAS, BY COUNTRY, 2022 & 2031 ($MILLION)
    FIGURE 25. COMPARATIVE ANALYSIS OF FUEL ETHANOL MARKET FOR OTHERS, BY COUNTRY, 2022 & 2031 ($MILLION)
    FIGURE 26. U.S. FUEL ETHANOL MARKET REVENUE, 2021–2031 ($MILLION)
    FIGURE 27. CANADA FUEL ETHANOL MARKET REVENUE, 2021–2031 ($MILLION)
    FIGURE 28. MEXICO FUEL ETHANOL MARKET REVENUE, 2021–2031 ($MILLION)
    FIGURE 29. UK FUEL ETHANOL MARKET REVENUE, 2021–2031 ($MILLION)
    FIGURE 30. GERMANY FUEL ETHANOL MARKET REVENUE, 2021–2031 ($MILLION)
    FIGURE 31. FRANCE FUEL ETHANOL MARKET REVENUE, 2021–2031 ($MILLION)
    FIGURE 32. SPAIN FUEL ETHANOL MARKET REVENUE, 2021–2031 ($MILLION)
    FIGURE 33. ITALY FUEL ETHANOL MARKET REVENUE, 2021–2031 ($MILLION)
    FIGURE 34. REST OF EUROPE FUEL ETHANOL MARKET REVENUE, 2021–2031 ($MILLION)
    FIGURE 35. CHINA FUEL ETHANOL MARKET REVENUE, 2021–2031 ($MILLION)
    FIGURE 36. JAPAN FUEL ETHANOL MARKET REVENUE, 2021–2031 ($MILLION)
    FIGURE 37. INDIA FUEL ETHANOL MARKET REVENUE, 2021–2031 ($MILLION)
    FIGURE 38. SOUTH KOREA FUEL ETHANOL MARKET REVENUE, 2021–2031 ($MILLION)
    FIGURE 39. REST OF ASIA-PACIFIC FUEL ETHANOL MARKET REVENUE, 2021–2031 ($MILLION)
    FIGURE 40. BRAZIL FUEL ETHANOL MARKET REVENUE, 2021–2031 ($MILLION)
    FIGURE 41. SAUDI ARABIA FUEL ETHANOL MARKET REVENUE, 2021–2031 ($MILLION)
    FIGURE 42. SOUTH AFRICA FUEL ETHANOL MARKET REVENUE, 2021–2031 ($MILLION)
    FIGURE 43. REST OF LAMEA FUEL ETHANOL MARKET REVENUE, 2021–2031 ($MILLION)
    FIGURE 44. MARKET PLAYER POSITIONING, 2021
    FIGURE 45. TOP WINNING STRATEGIES, BY YEAR, 2020–2022
    FIGURE 46. TOP WINNING STRATEGIES, BY DEVELOPMENT, 2020–2022 (%)
    FIGURE 47. TOP WINNING STRATEGIES, BY COMPANY, 2020–2022
    FIGURE 48. BRASKEM: REVENUE, 2018–2020 ($MILLION)
    FIGURE 49. BRASKEM: REVENUE SHARE BY REGION, 2020 (%)
    FIGURE 50. REVENUE, 2018–2020 ($MILLION)
    FIGURE 51. BP PLC: REVENUE SHARE BY SEGMENT, 2020 (%)
    FIGURE 52. BP PLC: REVENUE SHARE BY REGION, 2020 (%)
    FIGURE 53. INEOS: NET SALES, 2018–2020 ($MILLION)
    FIGURE 54. INEOS: REVENUE SHARE BY SEGMENT, 2020 (%)
    FIGURE 55. HPCL BIOFUELS LTD.: NET SALES, 2018–2020 ($MILLION)
    FIGURE 56. HPCL BIOFUELS LTD.: REVENUE SHARE BY SEGMENT, 2020 (%)
    FIGURE 57. LYONDELLBASELL: NET SALES, 2018–2020 ($MILLION)
    FIGURE 58. MITSUBISHI CHEMICAL CORPORATION: REVENUE, 2018–2020 ($MILLION)
    FIGURE 59. MITSUBISHI CHEMICAL CORPORATION: REVENUE SHARE BY SEGMENT, 2020 (%)
    FIGURE 60. SABIC: NET SALES, 2018–2020 ($MILLION)
    FIGURE 61. SABIC: REVENUE SHARE BY SEGMENT, 2020 (%)
    FIGURE 62. SABIC: REVENUE SHARE BY REGION, 2020 (%)
    FIGURE 63. SASOL LIMITED: REVENUE, 2018–2020 ($MILLION)
    FIGURE 64. SASOL LIMITED: REVENUE SHARE BY SEGMENT, 2020 (%)
    FIGURE 65. SOLVAY S.A.: NET SALES, 2018–2020 ($MILLION)
    FIGURE 66. SOLVAY S.A.: REVENUE SHARE, BY SEGMENT, 2020 (%)
    FIGURE 67. SOLVAY S.A.: REVENUE SHARE, BY REGION, 2020 (%)


The global fuel ethanol market is expected to gain traction during the forecast period as a result of government regulations and investments that are aimed at developing potentially underutilized agricultural and other waste resources.

Ethanol fuel is a biofuel used to power automobiles and is said to renewable fuel as these fuel sources comes from food crops, prime agricultural land, and natural forest. These fuels are alternative to the fossil fuel and help in reducing the carbon emission with the application in transportation sector. These fuels are promising alternative for conventional fuel for sustainable development as they can curb 60-70% of CO2 emission caused by fossil fuel in transportation industry.

Increase in greenhouse gas emission and the rapid development of transportation infrastructure, especially in developing nations led to emission of more CO2, which led to environmental degradation. The decline in natural fossil fuel resources and increasing future demand for conventional fuels led to surge in the exploration of alternatives that are beneficial to the environment. In addition to this, awareness among the individuals regarding utilization of ethanol blended fuel on environment has great impact on the demand for fuel ethanol.

The constraints that restrain the commercial production and use of fuel ethanol is mostly due to feedstock barrier, financial barrier as the production is still expensive, existing laws and regulations are immature for biofuels (which include fuel ethanol), infrastructure barrier as specific ethanol production requires new facilities, existing storage and transportation systems are inappropriate.  The above-mentioned barriers are all hampering the development of the fuel ethanol market.

PURCHASE OPTIONS

Call or Email us

U.S.-Canada Toll-free: +1-800-792-5285
Int'l : +1-503-894-6022
Europe : +44-845-528-1300
Email : help@alliedmarketresearch.com
 
FREQUENTLY ASKED QUESTIONS?

A. Extensive use of ethanol as additive in the automobile industry and rise in environmental concerns and depletion of fossil fuel resources are the key factors boosting the Fuel Ethanol Market growth

A. Automotive industry is projected to increase the demand for Fuel Ethanol Market

A. Automotive industry is expected to drive the adoption of Fuel Ethanol

A. Braskem, BP PLC, Cargill Incorporated, INEOS, HPCL Biofuels Limited, Lyondell Basell Industries Holdings BV, Mitsubishi Chemical Corporation, SABIC, Sasol Limited and Solvay SA.

A. The fuel ethanol market is segmented on the basis of source, product, application, end use industry and region. On the basis of source, the global fuel ethanol market is segmented into synthetic and natural. On the basis of product, the market is segmented into starch based, sugar based and cellulosic. On the basis of application, the market is segmented into conventional vehicles, and flexible fuel vehicles. On the basis of end use industry, the global market is bifurcated into automotive, oil & gas, and others. Region wise, the market is studied across North America, Europe, Asia-Pacific, and LAMEA.

A. Government initiatives and presence of abundant renewable source is the Main Driver of Fuel Ethanol Market

A. the market value of Fuel Ethanol in 2031 is expected to be $134.5 billion

Looking for Customization?

 Customization Request

Have a Question?

 Speak with Analyst

Any Confusion?

 Inquire Before Buying

Have a glance of the Report

  Request Sample
RELATED TAGS

Purchase Full Report of
Fuel Ethanol Market

Start reading instantly.
This Report and over 67,404+ more Reports, Available with Avenue Library. T&C*.

  • Online Only
  • $3,456
  • Online cloud access only
  • Restricted print, copy, paste & download
  • Read only
  • Free industry update
    (Within 180 days)
  • Free report update in next update cycle
    (May 2023 - May 2024)
  • Data Pack
  • $3,840
  • Restricted to one authorized user
  • One print only
  • Available in
    Excel
  • Free industry update
    (Within 180 days)
  •   Free report update in next update cycle
    (May 2023 - May 2024)
  • Single User
  • $5,769
  • Restricted to one authorized user
  • One print only
  • Available in
    PDF
  • Free industry update
    (Within 180 days)
  •   Free report update in next update cycle
    (May 2023 - May 2024)
  • Five Users
  • $6,450
  • Limited to five authorized users
  • Print upto five copies
  • Available in
    PDF
  • Free industry update
    (Within 180 days)
  •   Free report update in next update cycle
    (May 2023 - May 2024)
  • Enterprise
    License/PDF

  • $10,995
  • Unlimited
    within
    company/enterprise
  • Available in Excel & PDF
  • Free industry update
    (Within 180 days)
  •   Free report update in next update cycle
    (May 2023 - May 2024)
  • Library
    Membership

  • $999 $ 1,175
    Per User/ Per month/ Billed annually
  • Published Content
    E-access
  • Company Profiles
    E-access
  • Newly Added Content Access
  • 10 PDF
    Downloads
  • 5 Excel Data
    Pack Downloads
  • 250 Company Profiles PDF Downloads
  • Buy Now

*Taxes/Fees, if applicable will be added during checkout. All prices in USD

RELATED REPORTS
 

Why Allied Market Research?


Infallible Methodology

To ensure high-level data integrity, accurate analysis, and impeccable forecasts

Analyst Support

For complete satisfaction

Customization

On-demand customization of scope of the report to exactly meet your needs

TARGETED MARKET VIEW

Targeted market view to provide pertinent information and save time of readers

Get fresh content delivered

Get insights on topics that are crucial for your business. Stay abreast of your interest areas.

Get Industry Data Alerts

Why Allied Market Research?

Infallible Methodology

To ensure high-level data integrity, accurate analysis, and impeccable forecasts

Analyst Support

For complete satisfaction

Customization

On-demand customization of scope of the report to exactly meet your needs

TARGETED MARKET VIEW

Targeted market view to provide pertinent information and save time of readers