0
2020
Functional Apparel Market

Functional Apparel Market

by Product Type (Sportswear, Active Wear, Protective Clothing, and Others), Application (Sports Industry, Outdoor Clothing, and Healthcare) and Distribution Channel (Offline and Online): Global Opportunity Analysis and Industry Forecast, 2019-2026

Report Code: A06084
Mar 2020 | Pages: 245
Tables: 134
Charts: 73
  • Formats*:

  • pdf

    Single User License, Five User
    License & Enterprise User License

  • xls

    Data Pack Excel License

  • ppt

    It comes with the additional cost
    of $2500.00 contact sales.


COVID-19

Pandemic disrupted the entire world and affected many industries.

Get detailed COVID-19 impact analysis on the Functional Apparel Market

Request Now !

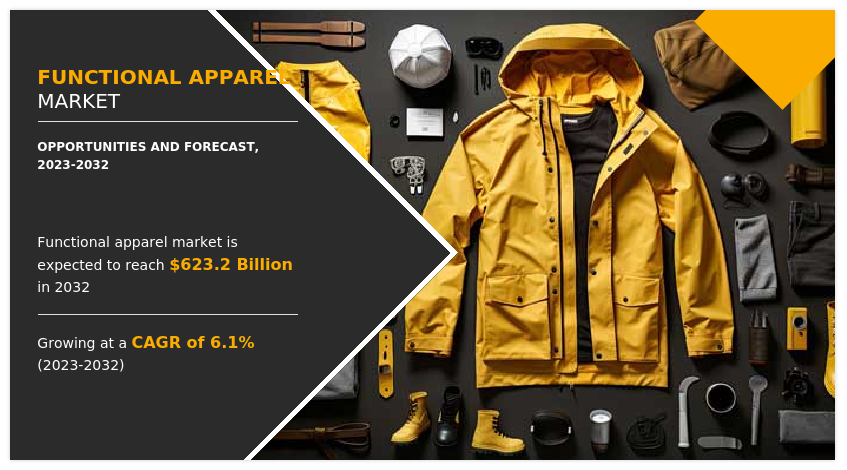
The functional Apparel market size was valued at $282.30 billion in 2018 and is expected to reach $505.80 billion by 2026, registering a CAGR of 7.7% from 2019 to 2026

Functional apparels are those garments that feature and perform multiple functions apart from just their aesthetics and basic protection of the wearer. There are different types of functional apparels available in the market namely athleisure clothing, sports-functional clothing, medical-functional clothing, and others. Most of the consumers find active wear comfortable and flexible, which is attributed to the kind of material used to design such apparels or footwear. Synthetic fabrics such as polyester and nylon, are the most commonly used materials in such athleisure apparels, which altogether tend to provide the best combination of the required properties. As per the CBI-Ministry of Foreign Affairs report, the global sports and fitness clothing market is expected to be valued at $231 billion by 2024. Though performance sportswear accounts for a higher value functional apparel market share, the athleisure segment is expected to witness growth at a significant rate in terms of value sales.

Functional Apparel Market

Rise in trend of health and wellness is one of the key influential factors that has been driving the demand for different types of functional apparels specifically active wear or sportswear products. Consumers around the globe have been seriously considering their fitness activity by indulging in various sports and fitness activities. Thus, the fitness industry is highly being promoted among these target segment. On the other hand, numerous fitness influencers have been promoting active wear brand that has caught the attention of target customers. This has bought an athleisure cult, with active wear being worn on runways, social gathering as well as gyms. Hence rise in health and wellness trend is an influential factor during the functional apparel market forecast.

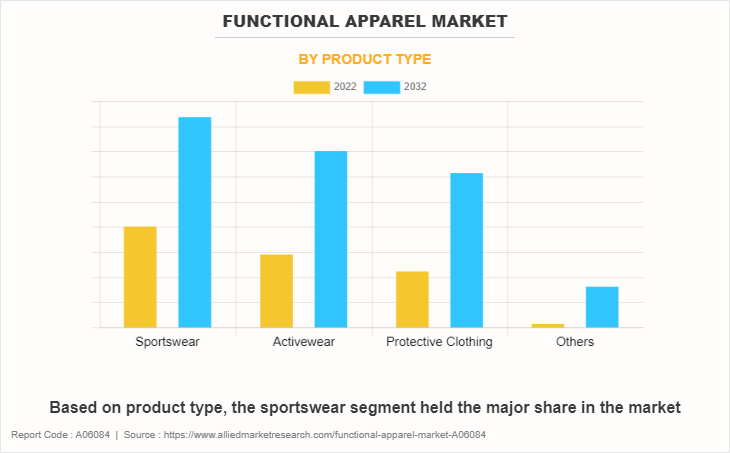
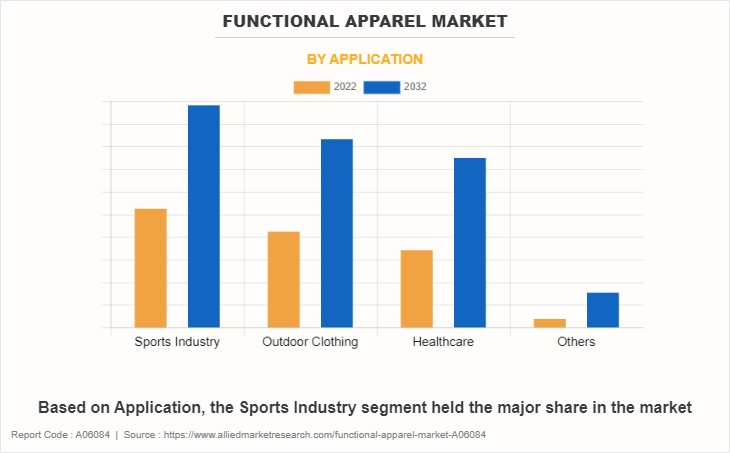
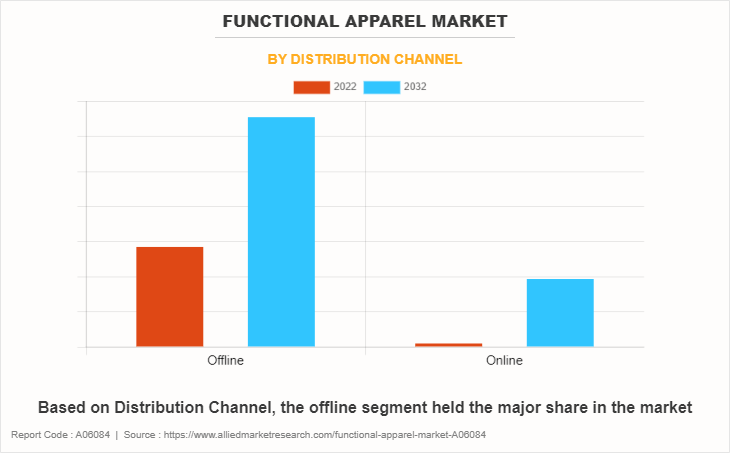
The global functional apparel market size is segmented into product type, application, distribution channel, and region. Based on product, the market is segmented into sportswear, active wear, protective clothing, and others. Based on application, the market is segmented into sports industry, outdoor clothing, and healthcare. Based on distribution channel, the market is segmented into offline and online. By region, it is analyzed across North America (U.S., Canada, and Mexico), Europe (Germany, Spain, UK, Italy, France, and rest of Europe), Asia-Pacific (China, India, Japan, Australia, South Korea, and rest of Asia-Pacific), and LAMEA (Brazil, South Africa, Saudi Arabia, UAE, and rest of LAMEA).

Functional Apparel Market
By Product Type

Your browser does not support the canvas element.

Protective Clothing segment would exhibit the highest CAGR of 8.70% during 2019-2026.

Get more information on this report : Request Sample Pages

Based on product type, the functional apparel market is segmented into sportswear, active wear, protective clothing, and others. Sportswear is considered to be the most valuable and coveted segment in the global apparels market. Products such as sneakers, sweatshirts, and tracksuits, have been gaining higher level of traction among the target customers. Customers who adopt healthy lifestyle or indulge in various types of health enhancement activities are known to be the target customers in this segment. Over the years, sportswear manufacturers have been initiating effective promotional activities that help in bringing awareness about its product offerings among the target customers. For instance, in 2017, Under Armour Inc., one of the key players in the segment, witnessed increase in demand for its sportswear products in the global market, post the aggressive promotional activities that were carried out in that year. Hence, some of the key promotional activities carried out by sportswear manufacturers have been one of the key factors that help drive the growth of the sportswear segment in terms of value sales.

Functional Apparel Market
By Application

Your browser does not support the canvas element.

Healthcare segment would exhibit the highest CAGR of 8.70% during 2019-2026.

Get more information on this report : Request Sample Pages

Based on application, the functional apparel market analysis is segmented into sports industry, outdoor clothing, and healthcare sector. Sports industry incurs higher level of demand for functional apparels. Sports functional apparels differ from casual clothing. These kind of apparels are a necessity for sports personnel who indulge in various sports activities to protect their body from external environmental hazards and at the same time enhance their performance. As a result, sports functional clothing features a high-level of breathability and moisture/vapor transfer combined with heat insulation and/or wind-proofing, waterproofing, and UV protection. There are functional apparels that help in enhancing the performance of sports personnel.  Some specialist sportswear [especially using infrared-emitting fabric] can increase blood circulation, particularly to the muscles that are being worked the hardest. This increased blood flow can decrease muscle fatigue and reduce the risk of muscle cramp. For example, wearing compression socks when running will help hold the muscle to reduce friction damage as well as maintaining blood flow and reducing swelling. Hence, some of the key features and specifications specifically designed to enhance performance of sports personnel help drive the growth of the segment in terms of value sales.    

Functional Apparel Market
By Distribution Channel

Your browser does not support the canvas element.

Online segment would exhibit the highest CAGR of 8.90% during 2019-2026.

Get more information on this report : Request Sample Pages

Based on distribution channel, the functional apparel market is segmented into hypermarket/supermarket, specialty store, online store, and others. The hypermarket/supermarket segment accounts for a higher functional apparel market share since most of the grooming products are easily available in such stores at affordable rates. Such stores facilitate the availability of both branded as well as private label functional apparel products. As a result, the customer base in the supermarket is higher as compared to any other stores. Walmart, Target are some of the key supermarket brands in the segment.

Functional Apparel Market
By Region

2026
North America 
Europe
Asia-Pacific
LAMEA

Asia-Pacific would exhibit the highest CAGR of 8.90% during 2019-2026.

Get more information on this report : Request Sample Pages

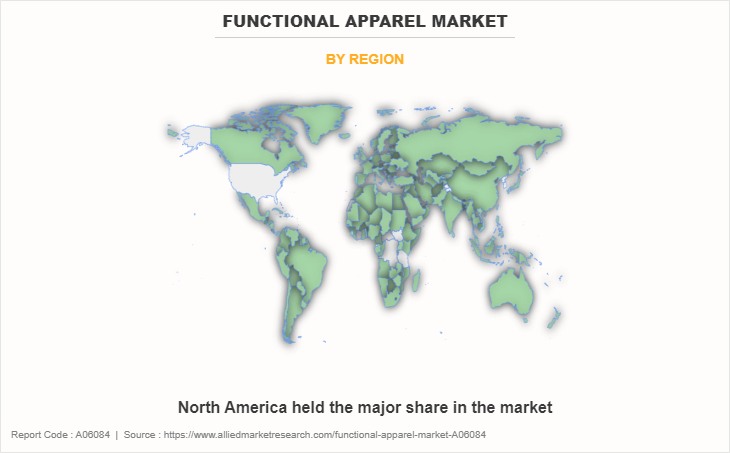
Based on region, the functional apparel industry is analyzed across North America, Europe, Asia-Pacific, and LAMEA. North America dominates the global functional apparel market. Ongoing trend of having a fit body and healthy lifestyle are some of the major factors driving the growth of the North American region. Increase in participation of baby boomers in fitness and physical activities has positively impacted the market growth. Thus, rise in interest of the American youth in sports and stronger participation of this population in sports and fitness activities drives the market growth in this region. The market development is supplemented by a growing portion of the population who prefer to live a healthier lifestyle and stronger participation in sports and fitness activities. Technological advancements in designs have led to enhanced comfort and boosted performance, which significantly attract fitness and sport enthusiasts. The trend of athleisure clothing is followed by a substantial number of youth customers, owing to stylish attributes of activewear and advantages such as odor resistance, wrinkle resistance, high comfort among others. Thus, activewear has evolved as a prevalent style statement and fashion trend in North America.

Key players operating in the functional apparel market includes Puma, Nike, Under Armour, Adidas, Lululemon Athletic, Asics Corporation, Columbia Sportswear Company, Gap Inc., North Face, Phillips-Van Heusen Corporation, and others.

Key Benefits for Stakeholders:

  • The report provides an extensive functional apparel market of the current and emerging market trends and opportunities.
  • The report provides detailed qualitative and quantitative analysis of the current functional apparel market trends and future estimations that help evaluate the prevailing functional apparel market opportunity.
  • A comprehensive analysis of the factors that drive and restrict the functional apparel market growth.
  • An extensive analysis of the functional apparel market is conducted by following key product positioning and monitoring the top competitors within the market framework.
  • The report provides extensive qualitative insights on the potential segments or regions exhibiting favorable growth.

Functional Apparel Market Report Highlights

Aspects Details
By Product Type
  • Sportswear
  • Activewear
  • Protective Clothing
  • Others
By Application
  • Sports Industry
  • Outdoor Clothing
  • Healthcare sector
By Distribution Channel
  • Offline Store
  • Online Store
By Region
  • NORTH AMERICA  (US, CANADA, MEXICO)
  • EUROPE  (UK, GERMANY, BENELUX, ITALY, SPAIN, REST OF EUROPE)
  • ASIA-PACIFIC  (CHINA, INDIA, JAPAN, SOUTH KOREA, REST OF ASIA-PACIFIC)
  • LAMEA  (LATIN AMERICA, MIDDLE EAST, AFRICA)
Key Market Players ASICS CORPORATION, LULULEMON ATHLETICA INC., UNDER ARMOUR, INC., COLUMBIA SPORTSWEAR COMPANY, THE GAP, INC., PUMA SE, NIKE, INC. (NIKE), PVH CORP., ADIDAS AG (ADIDAS), THE NORTH FACE (VF CORPORATION (VFC))
 

CHAPTER 1: INTRODUCTION

1.1. Report description
1.2. Key benefits for stakeholders
1.3. Key market segments
1.4. Research methodology

1.4.1. Primary research
1.4.2. Secondary research
1.4.3. Analyst tools and models

CHAPTER 2: EXECUTIVE SUMMARY

2.1. Key findings

2.1.1. Top impacting factors
2.1.2. Top investment pockets

2.2. CXO perspective

CHAPTER 3: MARKET OVERVIEW

3.1. Market definition and scope
3.2. Parent Market Overview
3.3. Key Forces Shaping Functional Apparels Market

3.3.1. High bargaining power of suppliers
3.3.2. Moderate-to-high threat of new entrants
3.3.3. Moderate threat of substitutes
3.3.4. Moderate intensity of rivalry
3.3.5. Moderate bargaining power of buyers

3.4. Value Chain Analysis
3.5. Customer Sentimental Analysis
3.6. Top 20 countries with highest number of millennial population
3.7. Pricing Analysis ($/Unit) 
3.8. Market dynamics

3.8.1. Drivers

3.8.1.1. Extensive advantages of activewear
3.8.1.2. Fitness consciousness among young generation
3.8.1.3. Increase in participation of consumers in physical fitness activities
3.8.1.4. Shift in trend towards athleisure wear

3.8.2. Restraints

3.8.2.1. Availability of counterfeit brands

3.8.3. Opportunities

3.8.3.1. Premiumization trend provide immense opportunity

3.8.3.2. Rise of social media marketing

CHAPTER 4: FUNCTIONAL APPARELS MARKET, BY PRODUCT TYPE

4.1. Overview
4.2. Sportswear

4.2.1. Key market trends, growth factors, and opportunities
4.2.2. Market size and forecast, by region
4.2.3. Market analysis by country

4.3. Activewear

4.3.1. Key market trends, growth factors, and opportunities
4.3.2. Market size and forecast, by region
4.3.3. Market analysis by country

4.4. Protective Clothing

4.4.1. Key market trends, growth factors, and opportunities
4.4.2. Market size and forecast, by region
4.4.3. Market analysis by country

4.5. Others

4.5.1. Key market trends, growth factors, and opportunities
4.5.2. Market size and forecast, by region
4.5.3. Market analysis by country

CHAPTER 5: FUNCTIONAL APPARELS MARKET, BY APPLICATION

5.1. Overview
5.2. Sports Industry

5.2.1. Key market trends, growth factors, and opportunities
5.2.2. Market size and forecast, by region
5.2.3. Market analysis by country

5.3. Outdoor Clothing

5.3.1. Key market trends, growth factors, and opportunities
5.3.2. Market size and forecast, by region
5.3.3. Market analysis by country

5.4. Healthcare sector

5.4.1. Key market trends, growth factors, and opportunities
5.4.2. Market size and forecast, by region
5.4.3. Market analysis by country

CHAPTER 6: FUNCTIONAL APPARELS MARKET, BY DISTRIBUTION CHANNEL

6.1. Overview
6.2. Offline Store

6.2.1. Key market trends, growth factors, and opportunities
6.2.2. Market size and forecast, by region
6.2.3. Market analysis by country

6.3. Online Store

6.3.1. Key market trends, growth factors, and opportunities
6.3.2. Market size and forecast, by region
6.3.3. Market analysis by country

CHAPTER 7: FUNCTIONAL APPARELS MARKET, BY REGION

7.1. Overview
7.2. North America

7.2.1. Key market trends, growth factors, and opportunities
7.2.2. Market size and forecast, by Product type
7.2.3. Market size and forecast, by Application
7.2.4. Market size and forecast, by Distribution Channel
7.2.5. Market analysis by Country

7.2.5.1. U.S.

7.2.5.1.1. Market size and forecast, by Product type
7.2.5.1.2. Market size and forecast, by Application
7.2.5.1.3. Market size and forecast, by Distribution Channel

7.2.5.2. Canada

7.2.5.2.1. Market size and forecast, by Product type
7.2.5.2.2. Market size and forecast, by Application
7.2.5.2.3. Market size and forecast, by Distribution Channel

7.2.5.3. Mexico

7.2.5.3.1. Market size and forecast, by Product type
7.2.5.3.2. Market size and forecast, by Application
7.2.5.3.3. Market size and forecast, by Distribution Channel

7.3. Europe

7.3.1. Key market trends, growth factors, and opportunities
7.3.2. Market size and forecast, by Product type
7.3.3. Market size and forecast, by Application
7.3.4. Market size and forecast, by Distribution Channel
7.3.5. Market analysis by country

7.3.5.1. Germany

7.3.5.1.1. Market size and forecast, by Product type
7.3.5.1.2. Market size and forecast, by Application
7.3.5.1.3. Market size and forecast, by Distribution Channel

7.3.5.2. UK

7.3.5.2.1. Market size and forecast, by Product type
7.3.5.2.2. Market size and forecast, by Application
7.3.5.2.3. Market size and forecast, by Distribution Channel

7.3.5.3. France

7.3.5.3.1. Market size and forecast, by Product type
7.3.5.3.2. Market size and forecast, by Application
7.3.5.3.3. Market size and forecast, by Distribution Channel

7.3.5.4. Italy

7.3.5.4.1. Market size and forecast, by Product type
7.3.5.4.2. Market size and forecast, by Application
7.3.5.4.3. Market size and forecast, by Distribution Channel

7.3.5.5. Spain

7.3.5.5.1. Market size and forecast, by Product type
7.3.5.5.2. Market size and forecast, by Application
7.3.5.5.3. Market size and forecast, by Distribution Channel

7.3.5.6. Rest of Europe

7.3.5.6.1. Market size and forecast, by Product type
7.3.5.6.2. Market size and forecast, by Application
7.3.5.6.3. Market size and forecast, by Distribution Channel

7.4. Asia-Pacific

7.4.1. Key market trends, growth factors, and opportunities
7.4.2. Market size and forecast, by Product type
7.4.3. Market size and forecast, by Application
7.4.4. Market size and forecast, by Distribution Channel.
7.4.5. Market size and forecast, by Country.

7.4.5.1. China

7.4.5.1.1. Market size and forecast, by Product type
7.4.5.1.2. Market size and forecast, by Application
7.4.5.1.3. Market size and forecast, by Distribution Channel

7.4.5.2. India

7.4.5.2.1. Market size and forecast, by Product type
7.4.5.2.2. Market size and forecast, by Application
7.4.5.2.3. Market size and forecast, by Distribution Channel

7.4.5.3. Japan

7.4.5.3.1. Market size and forecast, by Product type
7.4.5.3.2. Market size and forecast, by Application
7.4.5.3.3. Market size and forecast, by Distribution Channel

7.4.5.4. Australia

7.4.5.4.1. Market size and forecast, by Product type
7.4.5.4.2. Market size and forecast, by Application
7.4.5.4.3. Market size and forecast, by Distribution Channel

7.4.5.5. New Zealand

7.4.5.5.1. Market size and forecast, by Product type
7.4.5.5.2. Market size and forecast, by Application
7.4.5.5.3. Market size and forecast, by Distribution Channel

7.4.5.6. Rest of Asia-Pacific

7.4.5.6.1. Market size and forecast, by Product type
7.4.5.6.2. Market size and forecast, by Application
7.4.5.6.3. Market size and forecast, by distribution channel

7.5. LAMEA

7.5.1. Key market trends, growth factors, and opportunities
7.5.2. Market size and forecast, by Product type
7.5.3. Market size and forecast, by Application
7.5.4. Market size and forecast, by Distribution Channel
7.5.5. Market size and forecast, by Country

7.5.5.1. Latin America

7.5.5.1.1. Market size and forecast, by Product type
7.5.5.1.2. Market size and forecast, by Application
7.5.5.1.3. Market size and forecast, by Distribution Channel

7.5.5.2. Middle East

7.5.5.2.1. Market size and forecast, by Product type
7.5.5.2.2. Market size and forecast, by Application
7.5.5.2.3. Market size and forecast, by Distribution channel

7.5.5.3. Africa

7.5.5.3.1. Market size and forecast, by Product type
7.5.5.3.2. Market size and forecast, by Application
7.5.5.3.3. Market size and forecast, by Distribution Channel

CHAPTER 8: COMPETITIVE LANDSCAPE

8.1. Top winning strategies
8.2. Product mapping
8.3. Competitive dashboard
8.4. Competitive heatmap
8.5. Key developments

8.5.1. Acquisition
8.5.2. Agreement
8.5.3. Business Expansion
8.5.4. Partnership
8.5.5. Product Launch

CHAPTER 9: COMPANY PROFILES

9.1. ADIDAS AG (ADIDAS)

9.1.1. Company overview
9.1.2. Key Executives
9.1.3. Company snapshot
9.1.4. Operating business segments
9.1.5. Product portfolio
9.1.6. R&D Expenditure
9.1.7. Business performance
9.1.8. Key strategic moves and developments

9.2. ASICS CORPORATION

9.2.1. Company overview
9.2.2. Key Executive
9.2.3. Company snapshot
9.2.4. Operating business segments
9.2.5. Product portfolio
9.2.6. R&D Expenditure
9.2.7. Business performance
9.2.8. Key strategic moves and developments

9.3. COLUMBIA SPORTSWEAR COMPANY

9.3.1. Company overview
9.3.2. Key Executive
9.3.3. Company snapshot
9.3.4. Operating business segments
9.3.5. Product portfolio
9.3.6. Business performance
9.3.7. Key strategic moves and developments

9.4. LULULEMON ATHLETICA INC.

9.4.1. Company overview
9.4.2. Key Executive
9.4.3. Company snapshot
9.4.4. Product portfolio
9.4.5. Business performance

9.5. NIKE, INC. (NIKE)

9.5.1. Company overview
9.5.2. Key Executives
9.5.3. Company snapshot
9.5.4. Operating business segments
9.5.5. Product portfolio
9.5.6. Business performance
9.5.7. Key strategic moves and developments

9.6. PVH CORP.

9.6.1. Company overview
9.6.2. Key Executive
9.6.3. Company snapshot
9.6.4. Operating business segments
9.6.5. Product portfolio
9.6.6. Business performance
9.6.7. Key strategic moves and developments

9.7. PUMA SE

9.7.1. Company overview
9.7.2. Key Executives
9.7.3. Company snapshot
9.7.4. Operating business segments
9.7.5. Product portfolio
9.7.6. Business performance
9.7.7. Key strategic moves and developments

9.8. THE GAP, INC.

9.8.1. Company overview
9.8.2. Key Executives
9.8.3. Company snapshot
9.8.4. Product portfolio
9.8.5. R&D Expenditure
9.8.6. Business performance
9.8.7. Key strategic moves and developments

9.9. THE NORTH FACE (VF CORPORATION (VFC))

9.9.1. Company overview
9.9.2. Key Executive
9.9.3. Company snapshot
9.9.4. Operating business segments
9.9.5. Product portfolio
9.9.6. Business performance
9.9.7. Key strategic moves and developments

9.10. UNDER ARMOUR, INC.

9.10.1. Company overview
9.10.2. Key Executive
9.10.3. Company snapshot
9.10.4. Operating business segments
9.10.5. Product portfolio
9.10.6. Business performance

LIST OF TABLES

TABLE 01. GLOBAL FUNCTIONAL APPARELS MARKET, BY PRODUCT TYPE, 2019-2026 ($BILLION)
TABLE 02. SPORTSWEAR MARKET REVENUE, BY REGION 2019–2026 ($BILLION)
TABLE 03. ACTIVEWEAR MARKET REVENUE, BY REGION 2019–2026($BILLION)
TABLE 04. PROTECTIVE CLOTHING MARKET REVENUE, BY REGION 2019–2026($BILLION)
TABLE 05. PROTECTIVE CLOTHING MARKET REVENUE, BY REGION 2019–2026($BILLION)
TABLE 06. GLOBAL FUNCTIONAL APPARELS MARKET REVENUE, BY APPLICATION, 2019-2026 ($BILLION)
TABLE 07. FUNCTIONAL APPARELS MARKET REVENUE FOR SPORTS INDUSTRY, BY REGION 2019–2026($BILLION)
TABLE 08. FUNCTIONAL APPARELS MARKET REVENUE FOR OUTDOOR CLOTHING, BY REGION 2019–2026($BILLION)
TABLE 09. FUNCTIONAL APPARELS MARKET REVENUE FOR UNISEX, BY REGION 2019–2026($BILLION)
TABLE 10. GLOBAL FUNCTIONAL APPARELS MARKET REVENUE, BY DISTRIBUTION CHANNEL, 2019-2026 ($BILLION)
TABLE 11. FUNCTIONAL APPARELS MARKET REVENUE IN OFFLINE, BY REGION 2019–2026($BILLION)
TABLE 12. FUNCTIONAL APPARELS MARKET REVENUE IN ONLINE STORE, BY REGION 2019–2026($BILLION)
TABLE 13. GLOBAL FUNCTIONAL APPARELS MARKET REVENUE, BY REGION, 2019-2026 ($BILLION)
TABLE 14. NORTH AMERICA FUNCTIONAL APPARELS MARKET REVENUE, BY PRODUCT TYPE 2019–2026($BILLION)
TABLE 15. NORTH AMERICA FUNCTIONAL APPARELS MARKET REVENUE, BY APPLICATION 2019–2026($BILLION)
TABLE 16. NORTH AMERICA FUNCTIONAL APPARELS MARKET VALUE, BY DISTRIBUTION CHANNEL, 2019–2026($BILLION)
TABLE 17. NORTH AMERICA FUNCTIONAL APPARELS MARKET VALUE, BY DISTRIBUTION CHANNEL, 2019–2026($BILLION)
TABLE 18. U.S. FUNCTIONAL APPARELS MARKET REVENUE, BY PRODUCT TYPE 2019–2026($BILLION)
TABLE 19. U.S. FUNCTIONAL APPARELS MARKET REVENUE, BY APPLICATION 2019–2026($BILLION)
TABLE 20. U.S. FUNCTIONAL APPARELS MARKET REVENUE, BY DISTRIBUTION CHANNEL 2019–2026($BILLION)
TABLE 21. CANADA FUNCTIONAL APPARELS MARKET REVENUE, BY PRODUCT TYPE 2019–2026($BILLION)
TABLE 22. CANADA FUNCTIONAL APPARELS MARKET REVENUE, BY APPLICATION 2019–2026($BILLION)
TABLE 23. CANADA FUNCTIONAL APPARELS MARKET REVENUE, BY DISTRIBUTION CHANNEL 2019–2026($BILLION)
TABLE 24. MEXICO FUNCTIONAL APPARELS MARKET REVENUE, BY PRODUCT TYPE 2019–2026($BILLION)
TABLE 25. MEXICO FUNCTIONAL APPARELS MARKET REVENUE, BY APPLICATION 2019–2026($BILLION)
TABLE 26. MEXICO FUNCTIONAL APPARELS MARKET REVENUE, BY DISTRIBUTION CHANNEL 2019–2026($BILLION)
TABLE 27. EUROPE FUNCTIONAL APPARELS MARKET REVENUE, BY PRODUCT TYPE 2019–2026($BILLION)
TABLE 28. EUROPE FUNCTIONAL APPARELS MARKET REVENUE, BY APPLICATION 2019–2026($BILLION)
TABLE 29. EUROPE FUNCTIONAL APPARELS MARKET REVENUE, BY DISTRIBUTION CHANNEL 2019–2026($BILLION)
TABLE 30. EUROPE FUNCTIONAL APPARELS MARKET REVENUE, BY COUNTRY 2019–2026($BILLION)
TABLE 31. GERMANY FUNCTIONAL APPARELS MARKET REVENUE, BY PRODUCT TYPE 2019–2026($BILLION)
TABLE 32. GERMANY FUNCTIONAL APPARELS MARKET REVENUE, BY APPLICATION 2019–2026($BILLION)
TABLE 33. GERMANY FUNCTIONAL APPARELS MARKET REVENUE, BY DISTRIBUTION CHANNEL 2019–2026($BILLION)
TABLE 34. UK FUNCTIONAL APPARELS MARKET REVENUE, BY PRODUCT TYPE 2019–2026($BILLION)
TABLE 35. UK FUNCTIONAL APPARELS MARKET REVENUE, BY APPLICATION 2019–2026($BILLION)
TABLE 36. UK FUNCTIONAL APPARELS MARKET REVENUE, BY DISTRIBUTION CHANNEL 2019–2026($BILLION)
TABLE 37. FRANCE FUNCTIONAL APPARELS MARKET REVENUE, BY PRODUCT TYPE 2019–2026($BILLION)
TABLE 38. FRANCE FUNCTIONAL APPARELS MARKET REVENUE, BY APPLICATION 2019–2026($BILLION)
TABLE 39. FRANCE FUNCTIONAL APPARELS MARKET REVENUE, BY DISTRIBUTION CHANNEL 2019–2026($BILLION)
TABLE 40. ITALY FUNCTIONAL APPARELS MARKET REVENUE, BY PRODUCT TYPE 2019–2026($BILLION)
TABLE 41. ITALY FUNCTIONAL APPARELS MARKET REVENUE, BY APPLICATION 2019–2026($BILLION)
TABLE 42. ITALY FUNCTIONAL APPARELS MARKET REVENUE, BY DISTRIBUTION CHANNEL 2019–2026($BILLION)
TABLE 43. SPAIN FUNCTIONAL APPARELS MARKET REVENUE, BY PRODUCT TYPE 2019–2026($BILLION)
TABLE 44. SPAIN FUNCTIONAL APPARELS MARKET REVENUE, BY APPLICATION 2019–2026($BILLION)
TABLE 45. SPAIN FUNCTIONAL APPARELS MARKET REVENUE, BY DISTRIBUTION CHANNEL 2019–2026($BILLION)
TABLE 46. REST OF EUROPE FUNCTIONAL APPARELS MARKET REVENUE, BY PRODUCT TYPE 2019–2026($BILLION)
TABLE 47. REST OF EUROPE FUNCTIONAL APPARELS MARKET REVENUE, BY APPLICATION 2019–2026($BILLION)
TABLE 48. REST OF EUROPE FUNCTIONAL APPARELS MARKET REVENUE, BY DISTRIBUTION CHANNEL 2019–2026($BILLION)
TABLE 49. ASIA-PACIFIC FUNCTIONAL APPARELS MARKET REVENUE, BY PRODUCT TYPE 2019–2026($BILLION)
TABLE 50. ASIA-PACIFIC FUNCTIONAL APPARELS MARKET REVENUE, BY APPLICATION 2019–2026($BILLION)
TABLE 51. ASIA-PACIFIC FUNCTIONAL APPARELS MARKET REVENUE, BY DISTRIBUTION CHANNEL 2019–2026($BILLION)
TABLE 52. ASIA-PACIFIC FUNCTIONAL APPARELS MARKET REVENUE, BY COUNTRY 2019–2026($BILLION)
TABLE 53. CHINA FUNCTIONAL APPARELS MARKET REVENUE, BY PRODUCT TYPE 2019–2026($BILLION)
TABLE 54. CHINA FUNCTIONAL APPARELS MARKET REVENUE, BY APPLICATION 2019–2026($BILLION)
TABLE 55. CHINA FUNCTIONAL APPARELS MARKET REVENUE, BY DISTRIBUTION CHANNEL 2019–2026($BILLION)
TABLE 56. INDIA FUNCTIONAL APPARELS MARKET REVENUE, BY PRODUCT TYPE 2019–2026($BILLION)
TABLE 57. INDIA FUNCTIONAL APPARELS MARKET REVENUE, BY APPLICATION 2019–2026($BILLION)
TABLE 58. INDIA FUNCTIONAL APPARELS MARKET REVENUE, BY DISTRIBUTION CHANNEL 2019–2026($BILLION)
TABLE 59. JAPAN FUNCTIONAL APPARELS MARKET REVENUE, BY PRODUCT TYPE 2019–2026($BILLION)
TABLE 60. JAPAN FUNCTIONAL APPARELS MARKET REVENUE, BY APPLICATION 2019–2026($BILLION)
TABLE 61. JAPAN FUNCTIONAL APPARELS MARKET REVENUE, BY DISTRIBUTION CHANNEL 2019–2026($BILLION)
TABLE 62. AUSTRALIA FUNCTIONAL APPARELS MARKET REVENUE, BY PRODUCT TYPE 2019–2026($BILLION)
TABLE 63. AUSTRALIA FUNCTIONAL APPARELS MARKET REVENUE, BY APPLICATION 2019–2026($BILLION)
TABLE 64. AUSTRALIA FUNCTIONAL APPARELS MARKET REVENUE, BY DISTRIBUTION CHANNEL 2019–2026($BILLION)
TABLE 65. NEW ZEALAND FUNCTIONAL APPARELS MARKET REVENUE, BY PRODUCT TYPE 2019–2026($BILLION)
TABLE 66. NEW ZEALAND FUNCTIONAL APPARELS MARKET REVENUE, BY APPLICATION 2019–2026($BILLION)
TABLE 67. NEW ZEALAND FUNCTIONAL APPARELS MARKET REVENUE, BY DISTRIBUTION CHANNEL 2019–2026($BILLION)
TABLE 68. REST OF ASIA-PACIFIC FUNCTIONAL APPARELS MARKET REVENUE, BY PRODUCT TYPE 2019–2026($BILLION)
TABLE 69. REST OF ASIA-PACIFIC FUNCTIONAL APPARELS MARKET REVENUE, BY APPLICATION 2019–2026($BILLION)
TABLE 70. REST OF ASIA-PACIFIC FUNCTIONAL APPARELS MARKET REVENUE, BY DISTRIBUTION CHANNEL 2019–2026($BILLION)
TABLE 71. LAMEA FUNCTIONAL APPARELS MARKET REVENUE, BY PRODUCT TYPE 2019–2026($BILLION)
TABLE 72. LAMEA FUNCTIONAL APPARELS MARKET REVENUE, BY APPLICATION 2019–2026($BILLION)
TABLE 73. LAMEA FUNCTIONAL APPARELS MARKET REVENUE, BY DISTRIBUTION CHANNEL 2019–2026($BILLION)
TABLE 74. LAMEA FUNCTIONAL APPARELS MARKET REVENUE, BY DISTRIBUTION CHANNEL 2019–2026($BILLION)
TABLE 75. LATIN AMERICA FUNCTIONAL APPARELS MARKET REVENUE, BY PRODUCT TYPE 2019–2026($BILLION)
TABLE 76. LATIN AMERICA FUNCTIONAL APPARELS MARKET REVENUE, BY APPLICATION 2019–2026($BILLION)
TABLE 77. LATIN AMERICA FUNCTIONAL APPARELS MARKET REVENUE, BY DISTRIBUTION CHANNEL 2019–2026($BILLION)
TABLE 78. MIDDLE EAST FUNCTIONAL APPARELS MARKET REVENUE, BY PRODUCT TYPE 2019–2026($BILLION)
TABLE 79. MIDDLE EAST FUNCTIONAL APPARELS MARKET REVENUE, BY APPLICATION 2019–2026($BILLION)
TABLE 80. MIDDLE EAST FUNCTIONAL APPARELS MARKET REVENUE, BY DISTRIBUTION CHANNEL 2019–2026($BILLION)
TABLE 81. AFRICA FUNCTIONAL APPARELS MARKET REVENUE, BY PRODUCT TYPE 2019–2026($BILLION)
TABLE 82. AFRICA FUNCTIONAL APPARELS MARKET REVENUE, BY APPLICATION 2019–2026($BILLION)
TABLE 83. AFRICA FUNCTIONAL APPARELS MARKET VALUE, BY DISTRIBUTION CHANNEL 2019–2026($BILLION)
TABLE 84. ADIDAS AG: KEY EXECUTIVES
TABLE 85. ADIDAS AG: COMPANY SNAPSHOT
TABLE 86. ADIDAS AG: OPERATING SEGMENTS
TABLE 87. ADIDAS AG: PRODUCT PORTFOLIO
TABLE 88. ADIDAS AG: R&D EXPENDITURE, 2016–2018 ($MILLION)
TABLE 89. ADIDAS AG: NET SALES, 2016–2018 ($MILLION)
TABLE 90. ASICS CORPORATION: KEY EXECUTIVES
TABLE 91. ASICS CORPORATION: COMPANY SNAPSHOT
TABLE 92. ASICS CORPORATION: OPERATING SEGMENTS
TABLE 93. ASICS CORPORATION: PRODUCT PORTFOLIO
TABLE 94. ASICS CORPORATION: R&D EXPENDITURE, 2016–2018 ($MILLION)
TABLE 95. ASICS CORPORATION: NET SALES, 2016–2018 ($MILLION)
TABLE 96. COLUMBIA SPORTSWEAR COMPANY: KEY EXECUTIVES
TABLE 97. COLUMBIA SPORTSWEAR COMPANY: COMPANY SNAPSHOT
TABLE 98. COLUMBIA SPORTSWEAR COMPANY: OPERATING SEGMENTS
TABLE 99. COLUMBIA SPORTSWEAR COMPANY: PRODUCT PORTFOLIO
TABLE 100. COLUMBIA SPORTSWEAR COMPANY: NET SALES, 2016–2018 ($MILLION)
TABLE 101. LULULEMON ATHLETICA INC. : KEY EXECUTIVES
TABLE 102. LULULEMON ATHLETICA INC.: COMPANY SNAPSHOT
TABLE 103. LULULEMON ATHLETICA INC.: PRODUCT PORTFOLIO
TABLE 104. LULULEMON ATHLETICA INC.: NET SALES, 2016–2018 ($MILLION)
TABLE 105. NIKE, INC.: KEY EXECUTIVES
TABLE 106. NIKE, INC.: COMPANY SNAPSHOT
TABLE 107. NIKE, INC.: OPERATING SEGMENTS
TABLE 108. NIKE, INC.: PRODUCT PORTFOLIO
TABLE 109. NIKE, INC.: NET SALES, 2017–2019 ($MILLION)
TABLE 110. PVH CORP.: KEY EXECUTIVES
TABLE 111. PVH CORP.: COMPANY SNAPSHOT
TABLE 112. PVH CORP.: OPERATING SEGMENTS
TABLE 113. PVH CORP.: PRODUCT PORTFOLIO
TABLE 114. PVH CORP.: NET SALES, 2016–2018 ($MILLION)
TABLE 115. PUMA SE: KEY EXECUTIVES
TABLE 116. PUMA SE: COMPANY SNAPSHOT
TABLE 117. PUMA SE: OPERATING SEGMENTS
TABLE 118. PUMA SE: PRODUCT PORTFOLIO
TABLE 119. PUMA SE: NET SALES, 2016–2018 ($MILLION)
TABLE 120. THE GAP, INC.: KEY EXECUTIVES
TABLE 121. THE GAP, INC.: COMPANY SNAPSHOT
TABLE 122. THE GAP, INC.: PRODUCT PORTFOLIO
TABLE 123. THE GAP, INC.: R&D EXPENDITURE, 2016–2018 ($MILLION)
TABLE 124. THE GAP, INC.: NET SALES, 2016–2018 ($MILLION)
TABLE 125. THE NORTH FACE (VFC): KEY EXECUTIVES
TABLE 126. THE NORTH FACE (VFC): COMPANY SNAPSHOT
TABLE 127. THE NORTH FACE (VFC): OPERATING SEGMENTS
TABLE 128. THE NORTH FACE (VFC): PRODUCT PORTFOLIO
TABLE 129. THE NORTH FACE (VFC): NET SALES, 2016–2018 ($MILLION)
TABLE 130. UNDER ARMOUR, INC.: KEY EXECUTIVES
TABLE 131. UNDER ARMOUR, INC.: COMPANY SNAPSHOT
TABLE 132. UNDER ARMOUR, INC.: OPERATING SEGMENTS
TABLE 133. UNDER ARMOUR, INC.: PRODUCT PORTFOLIO
TABLE 134. UNDER ARMOUR, INC.: NET SALES, 2016–2018 ($MILLION)

LIST OF FIGURES

FIGURE 01. KEY MARKET SEGMENTS
FIGURE 02. EXECUTIVE SUMMARY
FIGURE 03. TOP IMPACTING FACTORS
FIGURE 04. TOP INVESTMENT POCKETS
FIGURE 05. GLOBAL FUNCTIONAL APPARELS MARKET, BY PRODUCT TYPE, 2019-2026 ($MILLION)
FIGURE 06. COMPARATIVE VALUE SHARE ANALYSIS OF SPORTSWEAR MARKET, BY COUNTRY, 2018 & 2026 (%)
FIGURE 07. COMPARATIVE VALUE SHARE ANALYSIS OF ACTIVEWEAR MARKET, BY COUNTRY, 2018 & 2026 (%)
FIGURE 08. COMPARATIVE VALUE SHARE ANALYSIS OF PROTECTIVE CLOTHING MARKET, BY COUNTRY, 2018 & 2026 (%)
FIGURE 09. COMPARATIVE VALUE SHARE ANALYSIS OF PROTECTIVE CLOTHING MARKET, BY COUNTRY, 2018 & 2026 (%)
FIGURE 10. GLOBAL FUNCTIONAL APPARELS MARKET, BY APPLICATION, 2019-2026 ($MILLION)
FIGURE 11. COMPARATIVE VALUE SHARE ANALYSIS OF FUNCTIONAL APPARELS MARKET FOR SPORTS INDUSTRY, BY COUNTRY,  2018 & 2026 (%)
FIGURE 12. COMPARATIVE VALUE SHARE ANALYSIS OF FUNCTIONAL APPARELS MARKET FOR OUTDOOR CLOTHING, BY COUNTRY,  2018 & 2026 (%)
FIGURE 13. COMPARATIVE VALUE SHARE ANALYSIS OF FUNCTIONAL APPARELS MARKET FOR HEALTHCARE CLOTHING, BY COUNTRY,  2018 & 2026 (%)
FIGURE 14. GLOBAL FUNCTIONAL APPARELS MARKET, BY DISTRIBUTION CHANNEL, 2019-2026
FIGURE 15. COMPARATIVE SHARE ANALYSIS OF FUNCTIONAL APPARELS MARKET IN OFFLINE, BY COUNTRY,  2018 & 2026 (%)
FIGURE 16. COMPARATIVE SHARE ANALYSIS OF FUNCTIONAL APPARELS MARKET IN ONLINE STORE, BY COUNTRY,  2018 & 2026 (%)
FIGURE 17. GLOBAL FUNCTIONAL APPARELS MARKET, BY REGION, 2019-2026
FIGURE 18. U.S. FUNCTIONAL APPARELS MARKET REVENUE, 2019-2026($BILLION)
FIGURE 19. CANADA FUNCTIONAL APPARELS MARKET REVENUE, 2019-2026($BILLION)
FIGURE 20. MEXICO FUNCTIONAL APPARELS MARKET REVENUE, 2019-2026($BILLION)
FIGURE 21. GERMANY FUNCTIONAL APPARELS MARKET REVENUE, 2019-2026($BILLION)
FIGURE 22. UK FUNCTIONAL APPARELS MARKET REVENUE, 2019-2026($BILLION)
FIGURE 23. FRANCE FUNCTIONAL APPARELS MARKET REVENUE, 2019-2026($BILLION)
FIGURE 24. ITALY FUNCTIONAL APPARELS MARKET REVENUE, 2019-2026($BILLION)
FIGURE 25. SPAIN FUNCTIONAL APPARELS MARKET REVENUE, 2019-2026($BILLION)
FIGURE 26. REST OF EUROPE FUNCTIONAL APPARELS MARKET REVENUE, 2019-2026($BILLION)
FIGURE 27. CHINA FUNCTIONAL APPARELS MARKET REVENUE, 2019-2026($BILLION)
FIGURE 28. INDIA FUNCTIONAL APPARELS MARKET REVENUE, 2019-2026($BILLION)
FIGURE 29. JAPAN FUNCTIONAL APPARELS MARKET REVENUE, 2019-2026($BILLION)
FIGURE 30. AUSTRALIA FUNCTIONAL APPARELS MARKET REVENUE, 2019-2026($BILLION)
FIGURE 31. NEW ZEALAND FUNCTIONAL APPARELS MARKET REVENUE, 2019-2026($BILLION)
FIGURE 32. REST OF ASIA-PACIFIC FUNCTIONAL APPARELS MARKET REVENUE, 2019-2026($BILLION)
FIGURE 33. LATIN AMERICA FUNCTIONAL APPARELS MARKET REVENUE, 2019-2026($BILLION)
FIGURE 34. MIDDLE EAST FUNCTIONAL APPARELS MARKET REVENUE, 2019-2026($BILLION)
FIGURE 35. AFRICA FUNCTIONAL APPARELS MARKET REVENUE, 2019-2026($BILLION)
FIGURE 36. TOP WINNING STRATEGIES, BY YEAR, 2016–2019*
FIGURE 37. TOP WINNING STRATEGIES, BY DEVELOPMENT, 2016–2019* (%)
FIGURE 38. TOP WINNING STRATEGIES, BY COMPANY, 2016–2019*
FIGURE 39. PRODUCT MAPPING OF TOP 10 KEY PLAYERS
FIGURE 40. COMPETITIVE DASHBOARD OF TOP 10 KEY PLAYERS
FIGURE 41. COMPETITIVE HEATMAP OF TOP 10 KEY PLAYERS
FIGURE 42. ADIDAS AG: R&D EXPENDITURE, 2016–2018 ($MILLION)
FIGURE 43. ADIDAS AG: NET SALES, 2016–2018 ($MILLION)
FIGURE 44. ADIDAS AG: REVENUE SHARE BY SEGMENT, 2018 (%)
FIGURE 45. ADIDAS AG: REVENUE SHARE BY PRODUCT CATEGORY, 2018 (%)
FIGURE 46. ASICS CORPORATION: R&D EXPENDITURE, 2016–2018 ($MILLION)
FIGURE 47. ASICS CORPORATION: NET SALES, 2016–2018 ($MILLION)
FIGURE 48. ASICS CORPORATION: REVENUE SHARE BY SEGMENT, 2018 (%)
FIGURE 49. ASICS CORPORATION: REVENUE SHARE BY REGION, 2018 (%)
FIGURE 50. COLUMBIA SPORTSWEAR COMPANY: NET SALES, 2016–2018 ($MILLION)
FIGURE 51. COLUMBIA SPORTSWEAR COMPANY: REVENUE SHARE BY SEGMENT, 2018 (%)
FIGURE 52. COLUMBIA SPORTSWEAR COMPANY: REVENUE SHARE BY PRODUCT TYPE, 2018 (%)
FIGURE 53. LULULEMON ATHLETICA INC.: NET SALES, 2016–2018 ($MILLION)
FIGURE 54. LULULEMON ATHLETICA INC.: REVENUE SHARE BY SEGMENT, 2018 (%)
FIGURE 55. LULULEMON ATHLETICA INC.: REVENUE SHARE BY REGION, 2018 (%)
FIGURE 56. NIKE, INC.: NET SALES, 2017–2019 ($MILLION)
FIGURE 57. NIKE, INC.: REVENUE SHARE BY SEGMENT, 2019 (%)
FIGURE 58. NIKE, INC.: REVENUE SHARE BY PRODUCT TYPE, 2019 (%)
FIGURE 59. PVH CORP.: NET SALES, 2016–2018 ($MILLION)
FIGURE 60. PVH CORP.: REVENUE SHARE BY SEGMENT, 2018 (%)
FIGURE 61. PVH CORP.: REVENUE SHARE BY REGION, 2018 (%)
FIGURE 62. PUMA SE: NET SALES, 2016–2018 ($MILLION)
FIGURE 63. PUMA SE: REVENUE SHARE BY SEGMENT, 2018 (%)
FIGURE 64. PUMA SE: REVENUE SHARE BY REGION, 2018 (%)
FIGURE 65. THE GAP, INC.: R&D EXPENDITURE, 2016–2018 ($MILLION)
FIGURE 66. THE GAP, INC.: NET SALES, 2016–2018 ($MILLION)
FIGURE 67. THE GAP, INC.: REVENUE SHARE BY SEGMENT, 2018 (%)
FIGURE 68. THE GAP, INC.: REVENUE SHARE BY REGION, 2018 (%)
FIGURE 69. THE NORTH FACE (VFC): NET SALES, 2016–2018 ($MILLION)
FIGURE 70. THE NORTH FACE (VFC): REVENUE SHARE BY SEGMENT, 2018 (%)
FIGURE 71. THE NORTH FACE (VFC): REVENUE SHARE BY REGION, 2018 (%)
FIGURE 72. UNDER ARMOUR, INC.: NET SALES, 2016–2018 ($MILLION)
FIGURE 73. UNDER ARMOUR, INC.: REVENUE SHARE BY SEGMENT, 2018 (%)


According to the insights of the CXOs of leading companies, the rise in health and wellness trend around the globe, is one of the key factors in driving the demand for the global functional apparel market.

With the rise in demand for various functional apparel products incurring from the target segments, companies have been initiating several key mergers and acquisitions in the view of generating revenue from the athleisure segment. For instance, in 2018, JD Sports announced acquisition of the U.S. retailer Finish Line for $558 billion. Finish Line is one the largest retailers of premium multi-branded athletic footwear, apparel, and accessories in the U.S. Apart from merger and acquisition, companies have also been strategizing on expanding their operations in the view of catering to the surging demand for athleisure products. For instance, high-end athleisure company Hylete has agreed to acquire rival Gracedbygrit in an all-stock transaction.

The rise in rate of internet penetration around the major parts of the world makes way for manufacturers to initiate several key online marketing programs as online platforms are one of the easiest ways to create awareness about the specifications and features of the athleisure products among the target customers.

PURCHASE OPTIONS

Call or Email us

U.S.-Canada Toll-free: +1-800-792-5285
Int'l : +1-503-894-6022
Europe : +44-845-528-1300
Email : help@alliedmarketresearch.com
 
FREQUENTLY ASKED QUESTIONS?

A. The forecast period for Global functional apparel market in the report is from 2019 to 2026.

A. The global functional apparel market was valued at US$282.30 Billion in 2018.

A. Puma, Nike, Under Armour, ASIC Corporation and Lululemon Athletic are some of the key players in global functional apparel market.

A. The functional apparel market report illustrates value chain analysis in detailed manner.

A. The rise in number of health conscious customers has been considered as an influential trend in the global functional apparel market.

A. Asia-Pacific region has been considered as one of the emerging regions in the global functional apparel market registering a CAGR of 8.9%.

A. North America holds the maximum market share in the global functional apparel market.

Looking for Customization?

 Customization Request

Have a Question?

 Speak with Analyst

Any Confusion?

 Inquire Before Buying

Have a glance of the Report

  Request Sample
RELATED TAGS

Purchase Full Report of
Functional Apparel Market

Start reading instantly.
This Report and over 67,068+ more Reports, Available with Avenue Library. T&C*.

  • Online Only
  • $3,539
  • Online cloud access only
  • Restricted print, copy, paste & download
  • Read only
  • Free industry update
    (Within 180 days)
  • Free report update in next update cycle
    (Mar 2021 - Mar 2022)
  • Data Pack
  • $3,933
  • Restricted to one authorized user
  • One print only
  • Available in
    Excel
  • Free industry update
    (Within 180 days)
  •   Free report update in next update cycle
    (Mar 2021 - Mar 2022)
  • Single User
  • $5,500
  • Restricted to one authorized user
  • One print only
  • Available in
    PDF
  • Free industry update
    (Within 180 days)
  •   Free report update in next update cycle
    (Mar 2021 - Mar 2022)
  • Five Users
  • $6,606
  • Limited to five authorized users
  • Print upto five copies
  • Available in
    PDF
  • Free industry update
    (Within 180 days)
  •   Free report update in next update cycle
    (Mar 2021 - Mar 2022)
  • Enterprise
    License/PDF

  • $10,213
  • Unlimited
    within
    company/enterprise
  • Available in Excel & PDF
  • Free industry update
    (Within 180 days)
  •   Free report update in next update cycle
    (Mar 2021 - Mar 2022)
  • Library
    Membership

  • $999 $ 1,175
    Per User/ Per month/ Billed annually
  • Published Content
    E-access
  • Company Profiles
    E-access
  • Newly Added Content Access
  • 10 PDF
    Downloads
  • 5 Excel Data
    Pack Downloads
  • 250 Company Profiles PDF Downloads
  • Buy Now

*Taxes/Fees, if applicable will be added during checkout. All prices in USD

RELATED REPORTS
 

Why Allied Market Research?


Infallible Methodology

To ensure high-level data integrity, accurate analysis, and impeccable forecasts

Analyst Support

For complete satisfaction

Customization

On-demand customization of scope of the report to exactly meet your needs

TARGETED MARKET VIEW

Targeted market view to provide pertinent information and save time of readers

Get fresh content delivered

Get insights on topics that are crucial for your business. Stay abreast of your interest areas.

Get Industry Data Alerts

Why Allied Market Research?

Infallible Methodology

To ensure high-level data integrity, accurate analysis, and impeccable forecasts

Analyst Support

For complete satisfaction

Customization

On-demand customization of scope of the report to exactly meet your needs

TARGETED MARKET VIEW

Targeted market view to provide pertinent information and save time of readers