0
2022
Gaming Accessories Market

Gaming Accessories Market

by Component (Headsets, Keyboard, Mice, Controller, Others), by Device Type (PC, Gaming Console), by Connectivity type (Wired, Wireless), by End Use (Online, Offline): Global Opportunity Analysis and Industry Forecast, 2021-2030

✷  Report Code: A12964
Jun 2022 | Pages: 180
Tables: 178
Charts: 69
  • Formats*:

  • pdf

    Single User License, Five User
    License & Enterprise User License

  • xls

    Data Pack Excel License

  • ppt

    It comes with the additional cost
    of $2500.00 contact sales.


Gaming Accessories Market Research, 2030

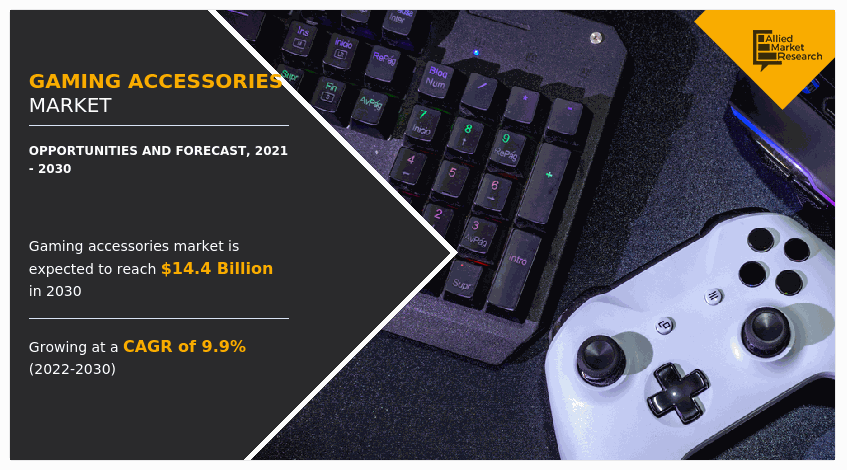
The global gaming accessories market was valued at $6.1 billion in 2021, and is projected to reach $14.4 billion by 2030, growing at a CAGR of 9.9% from 2022 to 2030.

The pandemic has had a minor influence on the gaming accessories business. The COVID-19 pandemic has had a tremendous impact on the world economy; many companies halted their manufacturing, production, and distribution of other gaming accessories products. Additionally, government regulations about social distancing, lockdown limitations, and periodic industry shutdowns have forced many gaming parlors to close for some unpredictable time. This factor has had a negative impact on global market

Gaming Accessories Market, Gaming Accessories Industry, Gaming Accessories Market Size, Gaming Accessories Market Share, Gaming Accessories Market Growth, Gaming Accessories Market Trends, Gaming Accessories Market Analysis, Gaming Accessories Market Forecast, Gaming Accessories Market Outlook, Gaming Accessories Market opportunity

The gaming accessories market is segmented into Component, Device Type, Connectivity type and End Use.

Gaming accessory is a piece of hardware that is either necessary to utilize a video game console or enhance the gameplay experience. Controllers, headsets, joysticks, and web cameras are all examples of video game accessories. The controllers used to play the games are the most common video game system accessory. One of the fastest-growing entertainment industries around the world is gaming. This industry has also registered a number of online gaming events that require cutting-edge technology to run smoothly. This has prompted players to invest in the most up-to-date gaming peripherals, resulting in the expansion of the gaming accessories market size.

The gaming accessories market growth is highly driven by the release of new gaming content with high graphic needs. Console gaming is in the process of transitioning to on-demand visual content, which has already begun. The Xbox Series X has been introduced by Microsoft (the successor of its range-topping Xbox One X gaming console). It will have far more powerful technology, including 4K gaming at up to 120 frames per second, support for variable refresh rate gameplay, and compatibility with 8K monitors. Furthermore, the decreasing prices of these accessories are a major driver of the gaming accessories market opportunity. Also, the ongoing development of e-sports leagues, as well as the growing number of gamers who choose it as a job, presents a profitable opportunity for the gaming accessories market growth.
The gaming accessories market share is segmented on the basis of component, device type, connectivity type, end-use and region. Based on component, the market is bifurcated into headsets, keyboard, mike, controller, and others. By device type, it is categorized into pc, and gaming consoles. By connectivity type, the market is segmented into wired and wireless. Based on end-use, the market is bifurcated into online and offline. Based on region, the market is analysed across North America, Europe, Asia-Pacific, and LAMEA.

Key players operating in the gaming accessories industry include Nintendo Co., Ltd., Logitech International SA, Razer Inc., Corsair, Sennheiser, SADES Technological Corporation, Alienware, Plantronics, Google Inc., Cooler Master. These players adopt collaboration, partnership, and agreement as their key developmental strategies to increase the revenue of the gaming accessories industry and develop new products to enhance their product portfolio.

Gaming Accessories Market

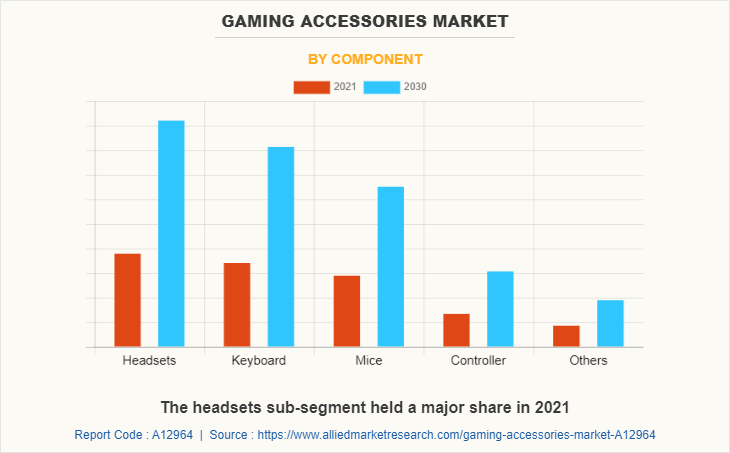
By component, headsets sub-segment is predicted to have the maximum market share in the forecast period. The sub-segment growth is observed mainly due to rising demand for enhanced, crisp and clear background sounds in gaming, among people, especially young adults. This is a major factor that is expected to have a positive impact on the market growth.
Gaming Accessories Market

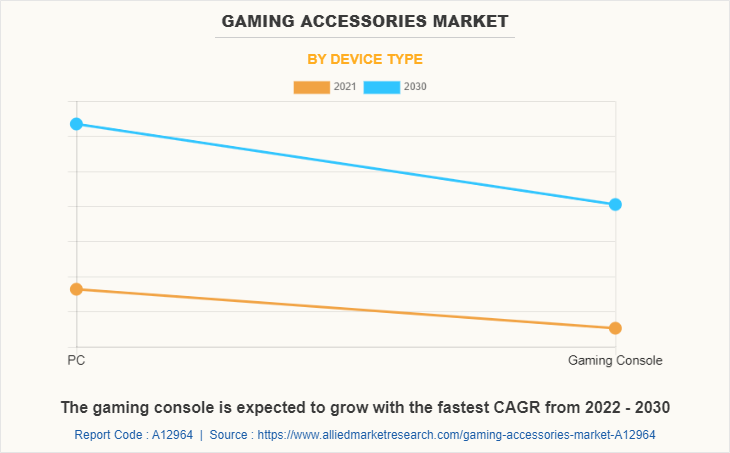
By device type, PC sub-segment is predicted to have the highest market share in the forecast period. The growth is attributed to rising demand of gaming pcs among young generation. Gaming PCs are typically custom-built with specifications such as a high-end processor, graphics processing unit (GPU), overclocked processor, and liquid cooling, among others, in order to pique the interest and enthusiasm of gamers.
Gaming Accessories Market

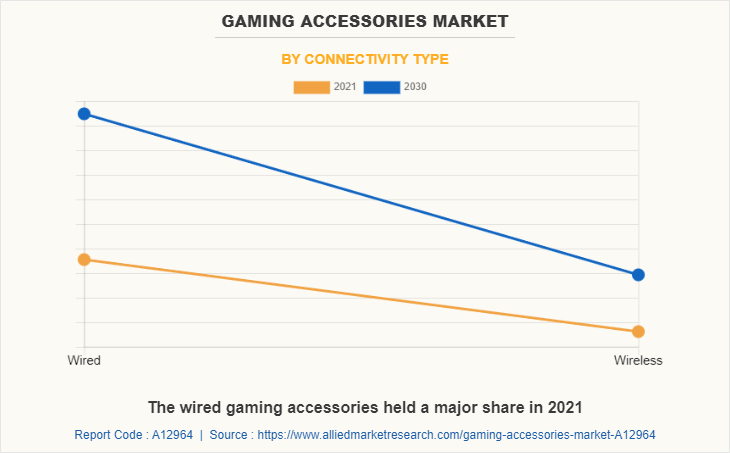
By connectivity type, the wired sub-segment is expected to observe highest market share in the forecast timeframe. The sub-segment growth is attributed to the fact that wired devices are just more reliable compared to wireless, making it one of the main factors in gaming peripheral market booming the demand for wired devices.
Gaming Accessories Market

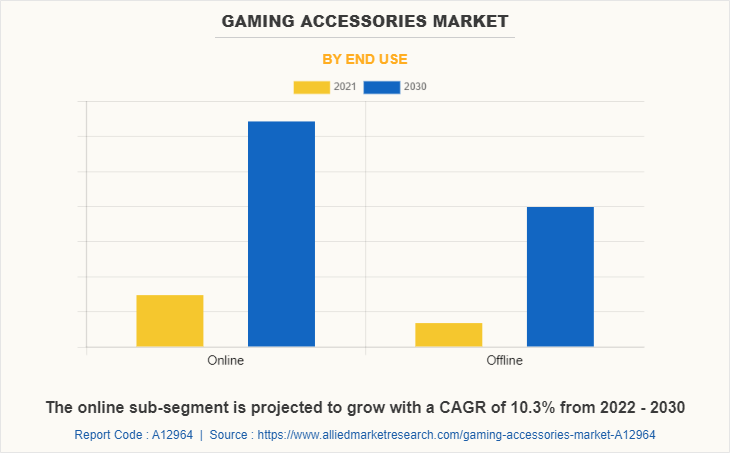
By end use, the online sub-segment is expected to observe highest market share in the forecast time frame owing to the growing popularity of online retailers such as Amazon, Flipkart, as well as the increased use of smartphones and other similar devices.
Gaming Accessories Market

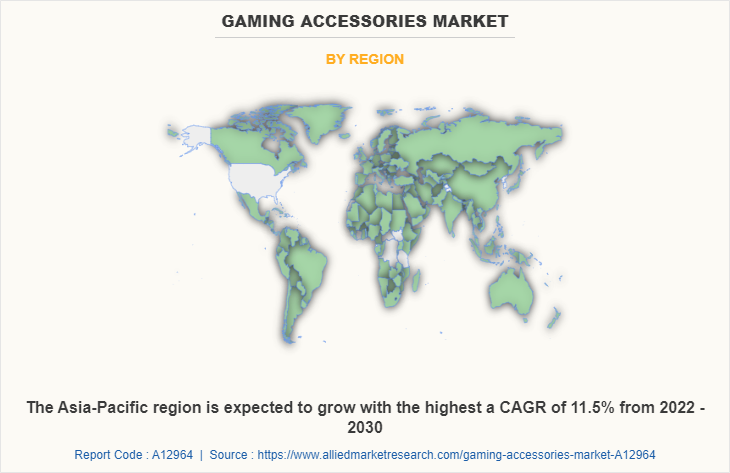
By region, Asia-Pacific region is projected to remain the fastest-growing segment during the forecast period. One of the key factors driving market growth in the Asia-Pacific region is the growing number of professional gamers. Aside from that, advancements in wireless technologies, as well as an increase in demand for online games, are fuelling market growth.
KEY BENEFITS FOR STAKEHOLDERS

The report provides an in-depth analysis of the global gaming accessories market trends along with the current and future market forecast.

This report highlights the key drivers, opportunities, and restraints of the market along with the impact analyses during the forecast period.

Porter’s five forces analysis helps analyse the potential of the buyers & suppliers and the competitive scenario of the global gaming accessories industry for strategy building.

A comprehensive global gaming accessories market analysis covers factors that drive and restrain the market growth.

The report provides a gaming accessories market outlook for 2021 and gaming accessories market forecast from 2022 - 2030 for each segment, region, and country(s).

The qualitative data in this report aims on market dynamics, trends, and developments.

IMPACT OF COVID-19 ON THE GLOBAL GAMING ACCESSORIES MARKET

The pandemic has had a minor influence on the gaming accessories business. The COVID-19 pandemic has had a tremendous impact on the world economy; many companies halted their manufacturing, production, and distribution of other gaming accessories products. Additionally, government regulations about social distancing, lockdown limitations, and periodic industry shutdowns have forced many gaming parlors to close for some unpredictable time. This factor has had a negative impact on global market.

People were forced to stay at home during pandemic to prevent themselves from any infection transmission. Since, the lockdown period was long, many people opted to use games as a medium for improving their mood and for some entertainment. Thus, the demand and sales of games and its related accessories like headsets and keyboards have increased, resulting in the positive impact on the market growth.

Gaming Accessories Market Report Highlights

Aspects Details
By Component
  • Mice
  • Controller
  • Others
  • Headsets
  • Keyboard
By Device Type
  • PC
  • Gaming Console
By Connectivity type
  • Wired
  • Wireless
By End Use
  • Online
  • Offline
By Region
  • North America  (U.S., Canada, Mexico)
  • Europe  (U.K., Germany, France, Sweden, Russia, Rest of Europe)
  • Asia-Pacific  (China, India, Japan, South Korea, Australia, Rest of Asia-Pacific)
  • LAMEA  (Brazil, Saudi Arabia, UAE, South Africa, Rest of LAMEA)
Key Market Players DuckyChannel International Co., Ltd., ZOWIE (BenQ), Cooler Master Technology Inc., Razer, steelseries, Logitech International SA, hyperx, mad catz, Corsair, Plantronics Inc.
 
  • CHAPTER 1:INTRODUCTION

    • 1.1.Report description

    • 1.2.Key market segments

    • 1.3.Key benefits to the stakeholders

    • 1.4.Research Methodology

      • 1.4.1.Secondary research

      • 1.4.2.Primary research

      • 1.4.3.Analyst tools and models

  • CHAPTER 2:EXECUTIVE SUMMARY

    • 2.1.Key findings of the study

    • 2.2.CXO Perspective

  • CHAPTER 3:MARKET OVERVIEW

    • 3.1.Market definition and scope

    • 3.2.Key findings

      • 3.2.1.Top investment pockets

    • 3.3.Porter’s five forces analysis

    • 3.4.Top player positioning

    • 3.5.Market dynamics

      • 3.5.1.Drivers

      • 3.5.2.Restraints

      • 3.5.3.Opportunities

    • 3.6.COVID-19 Impact Analysis on the market

    • 3.7.Value Chain Analysis

    • 3.8.Key Regulation Analysis

    • 3.9.Patent Landscape

    • 3.10.Market Share Analysis

    • 3.11.Regulatory Guidelines

  • CHAPTER 4: GAMING ACCESSORIES MARKET, BY COMPONENT

    • 4.1 Overview

      • 4.1.1 Market size and forecast

    • 4.2 Headsets

      • 4.2.1 Key market trends, growth factors and opportunities

      • 4.2.2 Market size and forecast, by region

      • 4.2.3 Market analysis by country

    • 4.3 Keyboard

      • 4.3.1 Key market trends, growth factors and opportunities

      • 4.3.2 Market size and forecast, by region

      • 4.3.3 Market analysis by country

    • 4.4 Mice

      • 4.4.1 Key market trends, growth factors and opportunities

      • 4.4.2 Market size and forecast, by region

      • 4.4.3 Market analysis by country

    • 4.5 Controller

      • 4.5.1 Key market trends, growth factors and opportunities

      • 4.5.2 Market size and forecast, by region

      • 4.5.3 Market analysis by country

    • 4.6 Others

      • 4.6.1 Key market trends, growth factors and opportunities

      • 4.6.2 Market size and forecast, by region

      • 4.6.3 Market analysis by country

  • CHAPTER 5: GAMING ACCESSORIES MARKET, BY DEVICE TYPE

    • 5.1 Overview

      • 5.1.1 Market size and forecast

    • 5.2 PC

      • 5.2.1 Key market trends, growth factors and opportunities

      • 5.2.2 Market size and forecast, by region

      • 5.2.3 Market analysis by country

    • 5.3 Gaming Console

      • 5.3.1 Key market trends, growth factors and opportunities

      • 5.3.2 Market size and forecast, by region

      • 5.3.3 Market analysis by country

  • CHAPTER 6: GAMING ACCESSORIES MARKET, BY CONNECTIVITY TYPE

    • 6.1 Overview

      • 6.1.1 Market size and forecast

    • 6.2 Wired

      • 6.2.1 Key market trends, growth factors and opportunities

      • 6.2.2 Market size and forecast, by region

      • 6.2.3 Market analysis by country

    • 6.3 Wireless

      • 6.3.1 Key market trends, growth factors and opportunities

      • 6.3.2 Market size and forecast, by region

      • 6.3.3 Market analysis by country

  • CHAPTER 7: GAMING ACCESSORIES MARKET, BY END USE

    • 7.1 Overview

      • 7.1.1 Market size and forecast

    • 7.2 Online

      • 7.2.1 Key market trends, growth factors and opportunities

      • 7.2.2 Market size and forecast, by region

      • 7.2.3 Market analysis by country

    • 7.3 Offline

      • 7.3.1 Key market trends, growth factors and opportunities

      • 7.3.2 Market size and forecast, by region

      • 7.3.3 Market analysis by country

  • CHAPTER 8: GAMING ACCESSORIES MARKET, BY REGION

    • 8.1 Overview

      • 8.1.1 Market size and forecast

    • 8.2 North America

      • 8.2.1 Key trends and opportunities

      • 8.2.2 North America Market size and forecast, by Component

      • 8.2.3 North America Market size and forecast, by Device Type

      • 8.2.4 North America Market size and forecast, by Connectivity type

      • 8.2.5 North America Market size and forecast, by End Use

      • 8.2.6 North America Market size and forecast, by country

        • 8.2.6.1 U.S.
          • 8.2.6.1.1 Market size and forecast, by Component
          • 8.2.6.1.2 Market size and forecast, by Device Type
          • 8.2.6.1.3 Market size and forecast, by Connectivity type
          • 8.2.6.1.4 Market size and forecast, by End Use
        • 8.2.6.2 Canada
          • 8.2.6.2.1 Market size and forecast, by Component
          • 8.2.6.2.2 Market size and forecast, by Device Type
          • 8.2.6.2.3 Market size and forecast, by Connectivity type
          • 8.2.6.2.4 Market size and forecast, by End Use
        • 8.2.6.3 Mexico
          • 8.2.6.3.1 Market size and forecast, by Component
          • 8.2.6.3.2 Market size and forecast, by Device Type
          • 8.2.6.3.3 Market size and forecast, by Connectivity type
          • 8.2.6.3.4 Market size and forecast, by End Use
    • 8.3 Europe

      • 8.3.1 Key trends and opportunities

      • 8.3.2 Europe Market size and forecast, by Component

      • 8.3.3 Europe Market size and forecast, by Device Type

      • 8.3.4 Europe Market size and forecast, by Connectivity type

      • 8.3.5 Europe Market size and forecast, by End Use

      • 8.3.6 Europe Market size and forecast, by country

        • 8.3.6.1 U.K.
          • 8.3.6.1.1 Market size and forecast, by Component
          • 8.3.6.1.2 Market size and forecast, by Device Type
          • 8.3.6.1.3 Market size and forecast, by Connectivity type
          • 8.3.6.1.4 Market size and forecast, by End Use
        • 8.3.6.2 Germany
          • 8.3.6.2.1 Market size and forecast, by Component
          • 8.3.6.2.2 Market size and forecast, by Device Type
          • 8.3.6.2.3 Market size and forecast, by Connectivity type
          • 8.3.6.2.4 Market size and forecast, by End Use
        • 8.3.6.3 France
          • 8.3.6.3.1 Market size and forecast, by Component
          • 8.3.6.3.2 Market size and forecast, by Device Type
          • 8.3.6.3.3 Market size and forecast, by Connectivity type
          • 8.3.6.3.4 Market size and forecast, by End Use
        • 8.3.6.4 Sweden
          • 8.3.6.4.1 Market size and forecast, by Component
          • 8.3.6.4.2 Market size and forecast, by Device Type
          • 8.3.6.4.3 Market size and forecast, by Connectivity type
          • 8.3.6.4.4 Market size and forecast, by End Use
        • 8.3.6.5 Russia
          • 8.3.6.5.1 Market size and forecast, by Component
          • 8.3.6.5.2 Market size and forecast, by Device Type
          • 8.3.6.5.3 Market size and forecast, by Connectivity type
          • 8.3.6.5.4 Market size and forecast, by End Use
        • 8.3.6.6 Rest of Europe
          • 8.3.6.6.1 Market size and forecast, by Component
          • 8.3.6.6.2 Market size and forecast, by Device Type
          • 8.3.6.6.3 Market size and forecast, by Connectivity type
          • 8.3.6.6.4 Market size and forecast, by End Use
    • 8.4 Asia-Pacific

      • 8.4.1 Key trends and opportunities

      • 8.4.2 Asia-Pacific Market size and forecast, by Component

      • 8.4.3 Asia-Pacific Market size and forecast, by Device Type

      • 8.4.4 Asia-Pacific Market size and forecast, by Connectivity type

      • 8.4.5 Asia-Pacific Market size and forecast, by End Use

      • 8.4.6 Asia-Pacific Market size and forecast, by country

        • 8.4.6.1 China
          • 8.4.6.1.1 Market size and forecast, by Component
          • 8.4.6.1.2 Market size and forecast, by Device Type
          • 8.4.6.1.3 Market size and forecast, by Connectivity type
          • 8.4.6.1.4 Market size and forecast, by End Use
        • 8.4.6.2 India
          • 8.4.6.2.1 Market size and forecast, by Component
          • 8.4.6.2.2 Market size and forecast, by Device Type
          • 8.4.6.2.3 Market size and forecast, by Connectivity type
          • 8.4.6.2.4 Market size and forecast, by End Use
        • 8.4.6.3 Japan
          • 8.4.6.3.1 Market size and forecast, by Component
          • 8.4.6.3.2 Market size and forecast, by Device Type
          • 8.4.6.3.3 Market size and forecast, by Connectivity type
          • 8.4.6.3.4 Market size and forecast, by End Use
        • 8.4.6.4 South Korea
          • 8.4.6.4.1 Market size and forecast, by Component
          • 8.4.6.4.2 Market size and forecast, by Device Type
          • 8.4.6.4.3 Market size and forecast, by Connectivity type
          • 8.4.6.4.4 Market size and forecast, by End Use
        • 8.4.6.5 Australia
          • 8.4.6.5.1 Market size and forecast, by Component
          • 8.4.6.5.2 Market size and forecast, by Device Type
          • 8.4.6.5.3 Market size and forecast, by Connectivity type
          • 8.4.6.5.4 Market size and forecast, by End Use
        • 8.4.6.6 Rest of Asia-Pacific
          • 8.4.6.6.1 Market size and forecast, by Component
          • 8.4.6.6.2 Market size and forecast, by Device Type
          • 8.4.6.6.3 Market size and forecast, by Connectivity type
          • 8.4.6.6.4 Market size and forecast, by End Use
    • 8.5 LAMEA

      • 8.5.1 Key trends and opportunities

      • 8.5.2 LAMEA Market size and forecast, by Component

      • 8.5.3 LAMEA Market size and forecast, by Device Type

      • 8.5.4 LAMEA Market size and forecast, by Connectivity type

      • 8.5.5 LAMEA Market size and forecast, by End Use

      • 8.5.6 LAMEA Market size and forecast, by country

        • 8.5.6.1 Brazil
          • 8.5.6.1.1 Market size and forecast, by Component
          • 8.5.6.1.2 Market size and forecast, by Device Type
          • 8.5.6.1.3 Market size and forecast, by Connectivity type
          • 8.5.6.1.4 Market size and forecast, by End Use
        • 8.5.6.2 Saudi Arabia
          • 8.5.6.2.1 Market size and forecast, by Component
          • 8.5.6.2.2 Market size and forecast, by Device Type
          • 8.5.6.2.3 Market size and forecast, by Connectivity type
          • 8.5.6.2.4 Market size and forecast, by End Use
        • 8.5.6.3 UAE
          • 8.5.6.3.1 Market size and forecast, by Component
          • 8.5.6.3.2 Market size and forecast, by Device Type
          • 8.5.6.3.3 Market size and forecast, by Connectivity type
          • 8.5.6.3.4 Market size and forecast, by End Use
        • 8.5.6.4 South Africa
          • 8.5.6.4.1 Market size and forecast, by Component
          • 8.5.6.4.2 Market size and forecast, by Device Type
          • 8.5.6.4.3 Market size and forecast, by Connectivity type
          • 8.5.6.4.4 Market size and forecast, by End Use
        • 8.5.6.5 Rest of LAMEA
          • 8.5.6.5.1 Market size and forecast, by Component
          • 8.5.6.5.2 Market size and forecast, by Device Type
          • 8.5.6.5.3 Market size and forecast, by Connectivity type
          • 8.5.6.5.4 Market size and forecast, by End Use
  • CHAPTER 9: COMPANY LANDSCAPE

    • 9.1. Introduction

    • 9.2. Top winning strategies

    • 9.3. Product Mapping of Top 10 Player

    • 9.4. Competitive Dashboard

    • 9.5. Competitive Heatmap

    • 9.6. Key developments

  • CHAPTER 10: COMPANY PROFILES

    • 10.1 Logitech International SA

      • 10.1.1 Company overview

      • 10.1.2 Company snapshot

      • 10.1.3 Operating business segments

      • 10.1.4 Product portfolio

      • 10.1.5 Business performance

      • 10.1.6 Key strategic moves and developments

    • 10.2 DuckyChannel International Co., Ltd.

      • 10.2.1 Company overview

      • 10.2.2 Company snapshot

      • 10.2.3 Operating business segments

      • 10.2.4 Product portfolio

      • 10.2.5 Business performance

      • 10.2.6 Key strategic moves and developments

    • 10.3 Corsair

      • 10.3.1 Company overview

      • 10.3.2 Company snapshot

      • 10.3.3 Operating business segments

      • 10.3.4 Product portfolio

      • 10.3.5 Business performance

      • 10.3.6 Key strategic moves and developments

    • 10.4 steelseries

      • 10.4.1 Company overview

      • 10.4.2 Company snapshot

      • 10.4.3 Operating business segments

      • 10.4.4 Product portfolio

      • 10.4.5 Business performance

      • 10.4.6 Key strategic moves and developments

    • 10.5 Razer

      • 10.5.1 Company overview

      • 10.5.2 Company snapshot

      • 10.5.3 Operating business segments

      • 10.5.4 Product portfolio

      • 10.5.5 Business performance

      • 10.5.6 Key strategic moves and developments

    • 10.6 hyperx

      • 10.6.1 Company overview

      • 10.6.2 Company snapshot

      • 10.6.3 Operating business segments

      • 10.6.4 Product portfolio

      • 10.6.5 Business performance

      • 10.6.6 Key strategic moves and developments

    • 10.7 ZOWIE (BenQ)

      • 10.7.1 Company overview

      • 10.7.2 Company snapshot

      • 10.7.3 Operating business segments

      • 10.7.4 Product portfolio

      • 10.7.5 Business performance

      • 10.7.6 Key strategic moves and developments

    • 10.8 mad catz

      • 10.8.1 Company overview

      • 10.8.2 Company snapshot

      • 10.8.3 Operating business segments

      • 10.8.4 Product portfolio

      • 10.8.5 Business performance

      • 10.8.6 Key strategic moves and developments

    • 10.9 Cooler Master Technology Inc.

      • 10.9.1 Company overview

      • 10.9.2 Company snapshot

      • 10.9.3 Operating business segments

      • 10.9.4 Product portfolio

      • 10.9.5 Business performance

      • 10.9.6 Key strategic moves and developments

    • 10.10 Plantronics Inc.

      • 10.10.1 Company overview

      • 10.10.2 Company snapshot

      • 10.10.3 Operating business segments

      • 10.10.4 Product portfolio

      • 10.10.5 Business performance

      • 10.10.6 Key strategic moves and developments

  • LIST OF TABLES

  • TABLE 46. EUROPE GAMING ACCESSORIES MARKET, BY DEVICE TYPE, 2021-2030,($MILLION)
    TABLE 47. EUROPE GAMING ACCESSORIES MARKET, BY CONNECTIVITY TYPE, 2021-2030,($MILLION)
    TABLE 48. EUROPE GAMING ACCESSORIES MARKET, BY END USE, 2021-2030,($MILLION)
    TABLE 49. EUROPE GAMING ACCESSORIES MARKET, BY COUNTRY, 2021-2030,($MILLION)
    TABLE 50. U.K. GAMING ACCESSORIES MARKET, BY COMPONENT, 2021-2030,($MILLION)
    TABLE 51. U.K. GAMING ACCESSORIES MARKET, BY DEVICE TYPE, 2021-2030,($MILLION)
    TABLE 52. U.K. GAMING ACCESSORIES MARKET, BY CONNECTIVITY TYPE, 2021-2030,($MILLION)
    TABLE 64. SWEDEN GAMING ACCESSORIES MARKET, BY CONNECTIVITY TYPE, 2021-2030,($MILLION)
    TABLE 65. SWEDEN GAMING ACCESSORIES MARKET, BY END USE, 2021-2030,($MILLION)
    TABLE 53. U.K. GAMING ACCESSORIES MARKET, BY END USE, 2021-2030,($MILLION)
    TABLE 54. GERMANY GAMING ACCESSORIES MARKET, BY COMPONENT, 2021-2030,($MILLION)
    TABLE 55. GERMANY GAMING ACCESSORIES MARKET, BY DEVICE TYPE, 2021-2030,($MILLION)
    TABLE 56. GERMANY GAMING ACCESSORIES MARKET, BY CONNECTIVITY TYPE, 2021-2030,($MILLION)
    TABLE 57. GERMANY GAMING ACCESSORIES MARKET, BY END USE, 2021-2030,($MILLION)
    TABLE 58. FRANCE GAMING ACCESSORIES MARKET, BY COMPONENT, 2021-2030,($MILLION)
    TABLE 59. FRANCE GAMING ACCESSORIES MARKET, BY DEVICE TYPE, 2021-2030,($MILLION)
    TABLE 60. FRANCE GAMING ACCESSORIES MARKET, BY CONNECTIVITY TYPE, 2021-2030,($MILLION)
    TABLE 61. FRANCE GAMING ACCESSORIES MARKET, BY END USE, 2021-2030,($MILLION)
    TABLE 62. SWEDEN GAMING ACCESSORIES MARKET, BY COMPONENT, 2021-2030,($MILLION)
    TABLE 63. SWEDEN GAMING ACCESSORIES MARKET, BY DEVICE TYPE, 2021-2030,($MILLION)
    TABLE 66. RUSSIA GAMING ACCESSORIES MARKET, BY COMPONENT, 2021-2030,($MILLION)
    TABLE 67. RUSSIA GAMING ACCESSORIES MARKET, BY DEVICE TYPE, 2021-2030,($MILLION)
    TABLE 68. RUSSIA GAMING ACCESSORIES MARKET, BY CONNECTIVITY TYPE, 2021-2030,($MILLION)
    TABLE 69. RUSSIA GAMING ACCESSORIES MARKET, BY END USE, 2021-2030,($MILLION)
    TABLE 70. REST OF EUROPE GAMING ACCESSORIES MARKET, BY COMPONENT, 2021-2030,($MILLION)
    TABLE 71. REST OF EUROPE GAMING ACCESSORIES MARKET, BY DEVICE TYPE, 2021-2030,($MILLION)
    TABLE 72. REST OF EUROPE GAMING ACCESSORIES MARKET, BY CONNECTIVITY TYPE, 2021-2030,($MILLION)
    TABLE 73. REST OF EUROPE GAMING ACCESSORIES MARKET, BY END USE, 2021-2030,($MILLION)
    TABLE 74. ASIA-PACIFIC GAMING ACCESSORIES MARKET, BY COMPONENT, 2021-2030,($MILLION)
    TABLE 75. ASIA-PACIFIC GAMING ACCESSORIES MARKET, BY DEVICE TYPE, 2021-2030,($MILLION)
    TABLE 76. ASIA-PACIFIC GAMING ACCESSORIES MARKET, BY CONNECTIVITY TYPE, 2021-2030,($MILLION)
    TABLE 77. ASIA-PACIFIC GAMING ACCESSORIES MARKET, BY END USE, 2021-2030,($MILLION)
    TABLE 78. ASIA-PACIFIC GAMING ACCESSORIES MARKET, BY COUNTRY, 2021-2030,($MILLION)
    TABLE 79. CHINA GAMING ACCESSORIES MARKET, BY COMPONENT, 2021-2030,($MILLION)
    TABLE 80. CHINA GAMING ACCESSORIES MARKET, BY DEVICE TYPE, 2021-2030,($MILLION)
    TABLE 81. CHINA GAMING ACCESSORIES MARKET, BY CONNECTIVITY TYPE, 2021-2030,($MILLION)
    TABLE 82. CHINA GAMING ACCESSORIES MARKET, BY END USE, 2021-2030,($MILLION)
    TABLE 83. INDIA GAMING ACCESSORIES MARKET, BY COMPONENT, 2021-2030,($MILLION)
    TABLE 84. INDIA GAMING ACCESSORIES MARKET, BY DEVICE TYPE, 2021-2030,($MILLION)
    TABLE 85. INDIA GAMING ACCESSORIES MARKET, BY CONNECTIVITY TYPE, 2021-2030,($MILLION)
    TABLE 86. INDIA GAMING ACCESSORIES MARKET, BY END USE, 2021-2030,($MILLION)
    TABLE 87. JAPAN GAMING ACCESSORIES MARKET, BY COMPONENT, 2021-2030,($MILLION)
    TABLE 88. JAPAN GAMING ACCESSORIES MARKET, BY DEVICE TYPE, 2021-2030,($MILLION)
    TABLE 137.DUCKYCHANNEL INTERNATIONAL CO., LTD.: KEY STRATERGIES
    TABLE 138.CORSAIR: COMPANY SNAPSHOT
    TABLE 139.CORSAIR: OPERATING SEGMENTS
    TABLE 140.CORSAIR: PRODUCT PORTFOLIO
    TABLE 141.CORSAIR: NET SALES,
    TABLE 142.CORSAIR: KEY STRATERGIES
    TABLE 143.STEELSERIES: COMPANY SNAPSHOT
    TABLE 144.STEELSERIES: OPERATING SEGMENTS
    TABLE 145.STEELSERIES: PRODUCT PORTFOLIO
    TABLE 146.STEELSERIES: NET SALES,
    TABLE 135.DUCKYCHANNEL INTERNATIONAL CO., LTD.: PRODUCT PORTFOLIO
    TABLE 136.DUCKYCHANNEL INTERNATIONAL CO., LTD.: NET SALES,
    TABLE 147.STEELSERIES: KEY STRATERGIES
    TABLE 148.RAZER: COMPANY SNAPSHOT
    TABLE 149.RAZER: OPERATING SEGMENTS
    TABLE 150.RAZER: PRODUCT PORTFOLIO
    TABLE 151.RAZER: NET SALES,
    TABLE 152.RAZER: KEY STRATERGIES
    TABLE 153.HYPERX: COMPANY SNAPSHOT
    TABLE 154.HYPERX: OPERATING SEGMENTS
    TABLE 155.HYPERX: PRODUCT PORTFOLIO
    TABLE 156.HYPERX: NET SALES,
    TABLE 157.HYPERX: KEY STRATERGIES
    TABLE 158.ZOWIE (BENQ): COMPANY SNAPSHOT
    TABLE 159.ZOWIE (BENQ): OPERATING SEGMENTS
    TABLE 160.ZOWIE (BENQ): PRODUCT PORTFOLIO
    TABLE 161.ZOWIE (BENQ): NET SALES,
    TABLE 162.ZOWIE (BENQ): KEY STRATERGIES
    TABLE 163.MAD CATZ: COMPANY SNAPSHOT
    TABLE 164.MAD CATZ: OPERATING SEGMENTS
    TABLE 165.MAD CATZ: PRODUCT PORTFOLIO
    TABLE 166.MAD CATZ: NET SALES,
    TABLE 167.MAD CATZ: KEY STRATERGIES
    TABLE 168.COOLER MASTER TECHNOLOGY INC.: COMPANY SNAPSHOT
    TABLE 169.COOLER MASTER TECHNOLOGY INC.: OPERATING SEGMENTS
    TABLE 170.COOLER MASTER TECHNOLOGY INC.: PRODUCT PORTFOLIO
    TABLE 171.COOLER MASTER TECHNOLOGY INC.: NET SALES,
    TABLE 172.COOLER MASTER TECHNOLOGY INC.: KEY STRATERGIES
    TABLE 173.PLANTRONICS INC.: COMPANY SNAPSHOT
    TABLE 174.PLANTRONICS INC.: OPERATING SEGMENTS
    TABLE 175.PLANTRONICS INC.: PRODUCT PORTFOLIO
    TABLE 176.PLANTRONICS INC.: NET SALES,
    TABLE 177.PLANTRONICS INC.: KEY STRATERGIES
    TABLE 1. GLOBAL GAMING ACCESSORIES MARKET, BY COMPONENT, 2021-2030,($MILLION)
    TABLE 2. GAMING ACCESSORIES MARKET REVENUE, FOR HEADSETS, BY REGION , 2021-2030,($MILLION)
    TABLE 3. GAMING ACCESSORIES MARKET FOR HEADSETS BY COUNTRY, 2021-2030,($MILLION)
    TABLE 4. GAMING ACCESSORIES MARKET REVENUE, FOR KEYBOARD, BY REGION , 2021-2030,($MILLION)
    TABLE 5. GAMING ACCESSORIES MARKET FOR KEYBOARD BY COUNTRY, 2021-2030,($MILLION)
    TABLE 6. GAMING ACCESSORIES MARKET REVENUE, FOR MICE, BY REGION , 2021-2030,($MILLION)
    TABLE 7. GAMING ACCESSORIES MARKET FOR MICE BY COUNTRY, 2021-2030,($MILLION)
    TABLE 19. GAMING ACCESSORIES MARKET FOR WIRED BY COUNTRY, 2021-2030,($MILLION)
    TABLE 20. GAMING ACCESSORIES MARKET REVENUE, FOR WIRELESS, BY REGION , 2021-2030,($MILLION)
    TABLE 8. GAMING ACCESSORIES MARKET REVENUE, FOR CONTROLLER, BY REGION , 2021-2030,($MILLION)
    TABLE 9. GAMING ACCESSORIES MARKET FOR CONTROLLER BY COUNTRY, 2021-2030,($MILLION)
    TABLE 10. GAMING ACCESSORIES MARKET REVENUE, FOR OTHERS, BY REGION , 2021-2030,($MILLION)
    TABLE 11. GAMING ACCESSORIES MARKET FOR OTHERS BY COUNTRY, 2021-2030,($MILLION)
    TABLE 12. GLOBAL GAMING ACCESSORIES MARKET, BY DEVICE TYPE, 2021-2030,($MILLION)
    TABLE 13. GAMING ACCESSORIES MARKET REVENUE, FOR PC, BY REGION , 2021-2030,($MILLION)
    TABLE 14. GAMING ACCESSORIES MARKET FOR PC BY COUNTRY, 2021-2030,($MILLION)
    TABLE 15. GAMING ACCESSORIES MARKET REVENUE, FOR GAMING CONSOLE, BY REGION , 2021-2030,($MILLION)
    TABLE 16. GAMING ACCESSORIES MARKET FOR GAMING CONSOLE BY COUNTRY, 2021-2030,($MILLION)
    TABLE 21. GAMING ACCESSORIES MARKET FOR WIRELESS BY COUNTRY, 2021-2030,($MILLION)
    TABLE 22. GLOBAL GAMING ACCESSORIES MARKET, BY END USE, 2021-2030,($MILLION)
    TABLE 17. GLOBAL GAMING ACCESSORIES MARKET, BY CONNECTIVITY TYPE, 2021-2030,($MILLION)
    TABLE 18. GAMING ACCESSORIES MARKET REVENUE, FOR WIRED, BY REGION , 2021-2030,($MILLION)
    TABLE 23. GAMING ACCESSORIES MARKET REVENUE, FOR ONLINE, BY REGION , 2021-2030,($MILLION)
    TABLE 24. GAMING ACCESSORIES MARKET FOR ONLINE BY COUNTRY, 2021-2030,($MILLION)
    TABLE 25. GAMING ACCESSORIES MARKET REVENUE, FOR OFFLINE, BY REGION , 2021-2030,($MILLION)
    TABLE 26. GAMING ACCESSORIES MARKET FOR OFFLINE BY COUNTRY, 2021-2030,($MILLION)
    TABLE 27. GAMING ACCESSORIES MARKET, BY REGION, 2021-2030,($MILLION)
    TABLE 28. NORTH AMERICA GAMING ACCESSORIES MARKET, BY COMPONENT, 2021-2030,($MILLION)
    TABLE 29. NORTH AMERICA GAMING ACCESSORIES MARKET, BY DEVICE TYPE, 2021-2030,($MILLION)
    TABLE 30. NORTH AMERICA GAMING ACCESSORIES MARKET, BY CONNECTIVITY TYPE, 2021-2030,($MILLION)
    TABLE 31. NORTH AMERICA GAMING ACCESSORIES MARKET, BY END USE, 2021-2030,($MILLION)
    TABLE 32. NORTH AMERICA GAMING ACCESSORIES MARKET, BY COUNTRY, 2021-2030,($MILLION)
    TABLE 33. U.S. GAMING ACCESSORIES MARKET, BY COMPONENT, 2021-2030,($MILLION)
    TABLE 34. U.S. GAMING ACCESSORIES MARKET, BY DEVICE TYPE, 2021-2030,($MILLION)
    TABLE 35. U.S. GAMING ACCESSORIES MARKET, BY CONNECTIVITY TYPE, 2021-2030,($MILLION)
    TABLE 36. U.S. GAMING ACCESSORIES MARKET, BY END USE, 2021-2030,($MILLION)
    TABLE 37. CANADA GAMING ACCESSORIES MARKET, BY COMPONENT, 2021-2030,($MILLION)
    TABLE 38. CANADA GAMING ACCESSORIES MARKET, BY DEVICE TYPE, 2021-2030,($MILLION)
    TABLE 39. CANADA GAMING ACCESSORIES MARKET, BY CONNECTIVITY TYPE, 2021-2030,($MILLION)
    TABLE 40. CANADA GAMING ACCESSORIES MARKET, BY END USE, 2021-2030,($MILLION)
    TABLE 41. MEXICO GAMING ACCESSORIES MARKET, BY COMPONENT, 2021-2030,($MILLION)
    TABLE 42. MEXICO GAMING ACCESSORIES MARKET, BY DEVICE TYPE, 2021-2030,($MILLION)
    TABLE 43. MEXICO GAMING ACCESSORIES MARKET, BY CONNECTIVITY TYPE, 2021-2030,($MILLION)
    TABLE 44. MEXICO GAMING ACCESSORIES MARKET, BY END USE, 2021-2030,($MILLION)
    TABLE 45. EUROPE GAMING ACCESSORIES MARKET, BY COMPONENT, 2021-2030,($MILLION)
    TABLE 89. JAPAN GAMING ACCESSORIES MARKET, BY CONNECTIVITY TYPE, 2021-2030,($MILLION)
    TABLE 90. JAPAN GAMING ACCESSORIES MARKET, BY END USE, 2021-2030,($MILLION)
    TABLE 91. SOUTH KOREA GAMING ACCESSORIES MARKET, BY COMPONENT, 2021-2030,($MILLION)
    TABLE 92. SOUTH KOREA GAMING ACCESSORIES MARKET, BY DEVICE TYPE, 2021-2030,($MILLION)
    TABLE 93. SOUTH KOREA GAMING ACCESSORIES MARKET, BY CONNECTIVITY TYPE, 2021-2030,($MILLION)
    TABLE 94. SOUTH KOREA GAMING ACCESSORIES MARKET, BY END USE, 2021-2030,($MILLION)
    TABLE 95. AUSTRALIA GAMING ACCESSORIES MARKET, BY COMPONENT, 2021-2030,($MILLION)
    TABLE 96. AUSTRALIA GAMING ACCESSORIES MARKET, BY DEVICE TYPE, 2021-2030,($MILLION)
    TABLE 97. AUSTRALIA GAMING ACCESSORIES MARKET, BY CONNECTIVITY TYPE, 2021-2030,($MILLION)
    TABLE 98. AUSTRALIA GAMING ACCESSORIES MARKET, BY END USE, 2021-2030,($MILLION)
    TABLE 99. REST OF ASIA-PACIFIC GAMING ACCESSORIES MARKET, BY COMPONENT, 2021-2030,($MILLION)
    TABLE 100. REST OF ASIA-PACIFIC GAMING ACCESSORIES MARKET, BY DEVICE TYPE, 2021-2030,($MILLION)
    TABLE 101. REST OF ASIA-PACIFIC GAMING ACCESSORIES MARKET, BY CONNECTIVITY TYPE, 2021-2030,($MILLION)
    TABLE 102. REST OF ASIA-PACIFIC GAMING ACCESSORIES MARKET, BY END USE, 2021-2030,($MILLION)
    TABLE 103. LAMEA GAMING ACCESSORIES MARKET, BY COMPONENT, 2021-2030,($MILLION)
    TABLE 104. LAMEA GAMING ACCESSORIES MARKET, BY DEVICE TYPE, 2021-2030,($MILLION)
    TABLE 105. LAMEA GAMING ACCESSORIES MARKET, BY CONNECTIVITY TYPE, 2021-2030,($MILLION)
    TABLE 106. LAMEA GAMING ACCESSORIES MARKET, BY END USE, 2021-2030,($MILLION)
    TABLE 107. LAMEA GAMING ACCESSORIES MARKET, BY COUNTRY, 2021-2030,($MILLION)
    TABLE 108. BRAZIL GAMING ACCESSORIES MARKET, BY COMPONENT, 2021-2030,($MILLION)
    TABLE 109. BRAZIL GAMING ACCESSORIES MARKET, BY DEVICE TYPE, 2021-2030,($MILLION)
    TABLE 110. BRAZIL GAMING ACCESSORIES MARKET, BY CONNECTIVITY TYPE, 2021-2030,($MILLION)
    TABLE 111. BRAZIL GAMING ACCESSORIES MARKET, BY END USE, 2021-2030,($MILLION)
    TABLE 112. SAUDI ARABIA GAMING ACCESSORIES MARKET, BY COMPONENT, 2021-2030,($MILLION)
    TABLE 113. SAUDI ARABIA GAMING ACCESSORIES MARKET, BY DEVICE TYPE, 2021-2030,($MILLION)
    TABLE 114. SAUDI ARABIA GAMING ACCESSORIES MARKET, BY CONNECTIVITY TYPE, 2021-2030,($MILLION)
    TABLE 115. SAUDI ARABIA GAMING ACCESSORIES MARKET, BY END USE, 2021-2030,($MILLION)
    TABLE 116. UAE GAMING ACCESSORIES MARKET, BY COMPONENT, 2021-2030,($MILLION)
    TABLE 117. UAE GAMING ACCESSORIES MARKET, BY DEVICE TYPE, 2021-2030,($MILLION)
    TABLE 118. UAE GAMING ACCESSORIES MARKET, BY CONNECTIVITY TYPE, 2021-2030,($MILLION)
    TABLE 119. UAE GAMING ACCESSORIES MARKET, BY END USE, 2021-2030,($MILLION)
    TABLE 120. SOUTH AFRICA GAMING ACCESSORIES MARKET, BY COMPONENT, 2021-2030,($MILLION)
    TABLE 121. SOUTH AFRICA GAMING ACCESSORIES MARKET, BY DEVICE TYPE, 2021-2030,($MILLION)
    TABLE 122. SOUTH AFRICA GAMING ACCESSORIES MARKET, BY CONNECTIVITY TYPE, 2021-2030,($MILLION)
    TABLE 123. SOUTH AFRICA GAMING ACCESSORIES MARKET, BY END USE, 2021-2030,($MILLION)
    TABLE 124. REST OF LAMEA GAMING ACCESSORIES MARKET, BY COMPONENT, 2021-2030,($MILLION)
    TABLE 125. REST OF LAMEA GAMING ACCESSORIES MARKET, BY DEVICE TYPE, 2021-2030,($MILLION)
    TABLE 126. REST OF LAMEA GAMING ACCESSORIES MARKET, BY CONNECTIVITY TYPE, 2021-2030,($MILLION)
    TABLE 127. REST OF LAMEA GAMING ACCESSORIES MARKET, BY END USE, 2021-2030,($MILLION)
    TABLE 128.LOGITECH INTERNATIONAL SA: COMPANY SNAPSHOT
    TABLE 129.LOGITECH INTERNATIONAL SA: OPERATING SEGMENTS
    TABLE 130.LOGITECH INTERNATIONAL SA: PRODUCT PORTFOLIO
    TABLE 131.LOGITECH INTERNATIONAL SA: NET SALES,
    TABLE 132.LOGITECH INTERNATIONAL SA: KEY STRATERGIES
    TABLE 133.DUCKYCHANNEL INTERNATIONAL CO., LTD.: COMPANY SNAPSHOT
    TABLE 134.DUCKYCHANNEL INTERNATIONAL CO., LTD.: OPERATING SEGMENTS
  • LIST OF FIGURES

  • FIGURE 1.GAMING ACCESSORIES MARKET SEGMENTATION
    FIGURE 2.GAMING ACCESSORIES MARKET,2021-2030
    FIGURE 3.GAMING ACCESSORIES MARKET,2021-2030
    FIGURE 4. TOP INVESTMENT POCKETS, BY REGION
    FIGURE 5.PORTER FIVE-1
    FIGURE 6.PORTER FIVE-2
    FIGURE 7.PORTER FIVE-3
    FIGURE 8.PORTER FIVE-4
    FIGURE 9.PORTER FIVE-5
    FIGURE 10.TOP PLAYER POSITIONING
    FIGURE 11.GAMING ACCESSORIES MARKET:DRIVERS, RESTRAINTS AND OPPORTUNITIES
    FIGURE 12.VALUE CHAIN ANALYSIS
    FIGURE 13.KEY REGULATION ANALYSIS
    FIGURE 14.PATENT ANALYSIS BY COMPANY
    FIGURE 15.PATENT ANALYSIS BY COUNTRY
    FIGURE 16.MARKET SHARE ANALYSIS
    FIGURE 17.REGULATORY GUIDELINES
    FIGURE 18.GAMING ACCESSORIES MARKET,BY COMPONENT,2021(%)
    FIGURE 19.COMPARATIVE SHARE ANALYSIS OF HEADSETS GAMING ACCESSORIES MARKET,2021-2030(%)
    FIGURE 20.COMPARATIVE SHARE ANALYSIS OF KEYBOARD GAMING ACCESSORIES MARKET,2021-2030(%)
    FIGURE 21.COMPARATIVE SHARE ANALYSIS OF MICE GAMING ACCESSORIES MARKET,2021-2030(%)
    FIGURE 22.COMPARATIVE SHARE ANALYSIS OF CONTROLLER GAMING ACCESSORIES MARKET,2021-2030(%)
    FIGURE 23.COMPARATIVE SHARE ANALYSIS OF OTHERS GAMING ACCESSORIES MARKET,2021-2030(%)
    FIGURE 24.GAMING ACCESSORIES MARKET,BY DEVICE TYPE,2021(%)
    FIGURE 25.COMPARATIVE SHARE ANALYSIS OF PC GAMING ACCESSORIES MARKET,2021-2030(%)
    FIGURE 26.COMPARATIVE SHARE ANALYSIS OF GAMING CONSOLE GAMING ACCESSORIES MARKET,2021-2030(%)
    FIGURE 27.GAMING ACCESSORIES MARKET,BY CONNECTIVITY TYPE,2021(%)
    FIGURE 28.COMPARATIVE SHARE ANALYSIS OF WIRED GAMING ACCESSORIES MARKET,2021-2030(%)
    FIGURE 29.COMPARATIVE SHARE ANALYSIS OF WIRELESS GAMING ACCESSORIES MARKET,2021-2030(%)
    FIGURE 30.GAMING ACCESSORIES MARKET,BY END USE,2021(%)
    FIGURE 31.COMPARATIVE SHARE ANALYSIS OF ONLINE GAMING ACCESSORIES MARKET,2021-2030(%)
    FIGURE 32.COMPARATIVE SHARE ANALYSIS OF OFFLINE GAMING ACCESSORIES MARKET,2021-2030(%)
    FIGURE 33.GAMING ACCESSORIES MARKET BY REGION,2021
    FIGURE 34.U.S. GAMING ACCESSORIES MARKET,2021-2030($MILLION)
    FIGURE 35.CANADA GAMING ACCESSORIES MARKET,2021-2030($MILLION)
    FIGURE 36.MEXICO GAMING ACCESSORIES MARKET,2021-2030($MILLION)
    FIGURE 37.U.K. GAMING ACCESSORIES MARKET,2021-2030($MILLION)
    FIGURE 38.GERMANY GAMING ACCESSORIES MARKET,2021-2030($MILLION)
    FIGURE 39.FRANCE GAMING ACCESSORIES MARKET,2021-2030($MILLION)
    FIGURE 40.SWEDEN GAMING ACCESSORIES MARKET,2021-2030($MILLION)
    FIGURE 41.RUSSIA GAMING ACCESSORIES MARKET,2021-2030($MILLION)
    FIGURE 42.REST OF EUROPE GAMING ACCESSORIES MARKET,2021-2030($MILLION)
    FIGURE 43.CHINA GAMING ACCESSORIES MARKET,2021-2030($MILLION)
    FIGURE 44.INDIA GAMING ACCESSORIES MARKET,2021-2030($MILLION)
    FIGURE 45.JAPAN GAMING ACCESSORIES MARKET,2021-2030($MILLION)
    FIGURE 46.SOUTH KOREA GAMING ACCESSORIES MARKET,2021-2030($MILLION)
    FIGURE 47.AUSTRALIA GAMING ACCESSORIES MARKET,2021-2030($MILLION)
    FIGURE 48.REST OF ASIA-PACIFIC GAMING ACCESSORIES MARKET,2021-2030($MILLION)
    FIGURE 49.BRAZIL GAMING ACCESSORIES MARKET,2021-2030($MILLION)
    FIGURE 50.SAUDI ARABIA GAMING ACCESSORIES MARKET,2021-2030($MILLION)
    FIGURE 51.UAE GAMING ACCESSORIES MARKET,2021-2030($MILLION)
    FIGURE 52.SOUTH AFRICA GAMING ACCESSORIES MARKET,2021-2030($MILLION)
    FIGURE 53.REST OF LAMEA GAMING ACCESSORIES MARKET,2021-2030($MILLION)
    FIGURE 54. TOP WINNING STRATEGIES, BY YEAR
    FIGURE 55. TOP WINNING STRATEGIES, BY DEVELOPMENT
    FIGURE 56. TOP WINNING STRATEGIES, BY COMPANY
    FIGURE 57.PRODUCT MAPPING OF TOP 10 PLAYERS
    FIGURE 58.COMPETITIVE DASHBOARD
    FIGURE 59.COMPETITIVE HEATMAP OF TOP 10 KEY PLAYERS
    FIGURE 60.LOGITECH INTERNATIONAL SA.: NET SALES ,($MILLION)
    FIGURE 61.DUCKYCHANNEL INTERNATIONAL CO., LTD..: NET SALES ,($MILLION)
    FIGURE 62.CORSAIR.: NET SALES ,($MILLION)
    FIGURE 63.STEELSERIES.: NET SALES ,($MILLION)
    FIGURE 64.RAZER.: NET SALES ,($MILLION)
    FIGURE 65.HYPERX.: NET SALES ,($MILLION)
    FIGURE 66.ZOWIE (BENQ).: NET SALES ,($MILLION)
    FIGURE 67.MAD CATZ.: NET SALES ,($MILLION)
    FIGURE 68.COOLER MASTER TECHNOLOGY INC..: NET SALES ,($MILLION)
    FIGURE 69.PLANTRONICS INC..: NET SALES ,($MILLION)


According to analysts, the gaming accessories market possesses a substantial scope for growth in the future. Rapidly increasing young gamers across the world and increasing demand for high technology integrated gaming accessories is expected to drive the growth of gaming accessories market. However, high cost of gaming accessories like headsets is a major limitation to the market growth. New product launches in gaming accessories in the market is the factor that is anticipated to drive the global gaming accessories market. According to the analysts, Asia-Pacific is projected to register fast growth as compared to North American and European markets

PURCHASE OPTIONS

Call or Email us

U.S.-Canada Toll-free: +1-800-792-5285
Int'l : +1-503-894-6022
Europe : +44-845-528-1300
Email : help@alliedmarketresearch.com
 
FREQUENTLY ASKED QUESTIONS?

A. The gaming accessories market growth is highly driven by the release of new game content with high graphic needs. Also, growing interest of adults in gaming world as a new career option is likely to provide huge market growth opportunities in the next few years

A. Asia-Pacific will provide more business opportunities for global electrostatic discharge (ESD) packaging markets market in future

A. Key players operating in the gaming accessories market include Nintendo Co., Ltd., Logitech International SA, Razer Inc., Corsair, Sennheiser, SADES Technological Corporation, Alienware, Plantronics, Google Inc., Cooler Master.

A. The report provides an extensive qualitative and quantitative analysis of the current trends and future estimations of the gaming accessories market from 2021-2030 to determine the prevailing opportunities.

A. Agreement, business expansion and product launch are the key growth strategy of global gaming accessories market players.

Looking for Customization?

 Customization Request

Have a Question?

 Speak with Analyst

Any Confusion?

 Inquire Before Buying

Have a glance of the Report

  Request Sample
RELATED TAGS

Purchase Full Report of
Gaming Accessories Market

Start reading instantly.
This Report and over 66,944+ more Reports, Available with Avenue Library. T&C*.

  • Online Only
  • $3,456
  • Online cloud access only
  • Restricted print, copy, paste & download
  • Read only
  • Free industry update
    (Within 180 days)
  • Free report update in next update cycle
    (Jun 2023 - Jun 2024)
  • Data Pack
  • $3,840
  • Restricted to one authorized user
  • One print only
  • Available in
    Excel
  • Free industry update
    (Within 180 days)
  •   Free report update in next update cycle
    (Jun 2023 - Jun 2024)
  • Single User
  • $5,769
  • Restricted to one authorized user
  • One print only
  • Available in
    PDF
  • Free industry update
    (Within 180 days)
  •   Free report update in next update cycle
    (Jun 2023 - Jun 2024)
  • Five Users
  • $6,450
  • Limited to five authorized users
  • Print upto five copies
  • Available in
    PDF
  • Free industry update
    (Within 180 days)
  •   Free report update in next update cycle
    (Jun 2023 - Jun 2024)
  • Enterprise
    License/PDF

  • $10,995
  • Unlimited
    within
    company/enterprise
  • Available in Excel & PDF
  • Free industry update
    (Within 180 days)
  •   Free report update in next update cycle
    (Jun 2023 - Jun 2024)
  • Library
    Membership

  • $999 $ 1,175
    Per User/ Per month/ Billed annually
  • Published Content
    E-access
  • Company Profiles
    E-access
  • Newly Added Content Access
  • 10 PDF
    Downloads
  • 5 Excel Data
    Pack Downloads
  • 250 Company Profiles PDF Downloads
  • Buy Now

*Taxes/Fees, if applicable will be added during checkout. All prices in USD

RELATED REPORTS
 

Why Allied Market Research?


Infallible Methodology

To ensure high-level data integrity, accurate analysis, and impeccable forecasts

Analyst Support

For complete satisfaction

Customization

On-demand customization of scope of the report to exactly meet your needs

TARGETED MARKET VIEW

Targeted market view to provide pertinent information and save time of readers

Get fresh content delivered

Get insights on topics that are crucial for your business. Stay abreast of your interest areas.

Get Industry Data Alerts

Why Allied Market Research?

Infallible Methodology

To ensure high-level data integrity, accurate analysis, and impeccable forecasts

Analyst Support

For complete satisfaction

Customization

On-demand customization of scope of the report to exactly meet your needs

TARGETED MARKET VIEW

Targeted market view to provide pertinent information and save time of readers