0
2022
Gasoline Direct Injection (gdi) System Market

Gasoline Direct Injection (GDI) System Market

by Component (Fuel Injectors, Fuel Pumps, Electronic Control Units, Others), by Engine Type (4 cylinder, 6 cylinder, 8 cylinder, Others), by Vehicle Type (Passenger Cars, Commercial Vehicles), by Sales Channel (Original Equipment Manufacturer, Aftermarket): Global Opportunity Analysis and Industry Forecast, 2020-2030

✷  Report Code: A01454
Mar 2022 | Pages: 230
Tables: 164
Charts: 60
  • Formats*:

  • pdf

    Single User License, Five User
    License & Enterprise User License

  • xls

    Data Pack Excel License

  • ppt

    It comes with the additional cost
    of $2500.00 contact sales.


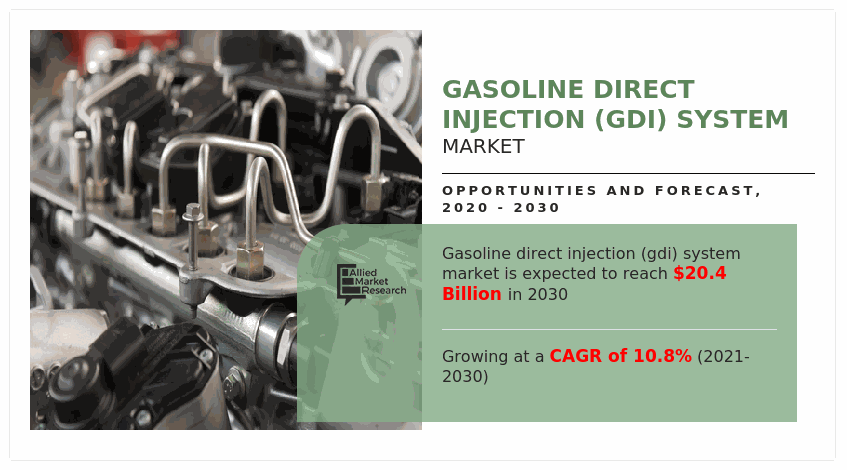
The global gasoline direct injection (gdi) system market was valued at $7.6 billion in 2020, and is projected to reach $20.4 billion by 2030, growing at a CAGR of 10.8% from 2021 to 2030.

Gasoline direct injection (GDI) is also referred to as petrol direct injection. GDI system directly injects fuel in combustion chamber. Gasoline gets highly compressed until being injected into the combustion chamber of each cylinder of the engine through a common rail fuel line. The main components of GDI system include fuel injectors, fuel pumps, sensors, and electronic control units.

The COVID-19 crisis created uncertainty in market, massive slowing of supply chain, fall in business confidence, and increase in panic among the customer segments. Governments of different regions announced total lockdown and temporarily ceased industries, thereby adversely affecting the overall production and sales of gasoline direct injection system. The COVID?19 pandemic affected sales of new vehicles, especially in 2020. It resulted in supply-chain disruptions, causing delay in manufacturing of vehicles. Several automobile manufacturers faced shortage of components and materials, leading to delay in production of vehicles. In addition, lockdown imposed by the government resulted in temporarily suspension of production of automobiles during pandemic period and low demand for automotive. However, increase in demand for vehicles will be observed, boosting the growth of the gasoline direct injection system market post pandemic.

The growth of global gasoline direct injection system market is propelling, due to rise in demand for fuel efficiency, increase in thermal efficiency & greater engine performance, surge in introduction of stringent regulations associated with emissions, and growth in inclination toward engine downsizing & reduced weight of vehicles. However, high cost of GDI system and electrification of vehicles hinder the growth of the gasoline direct injection system industry. Furthermore, incorporation of GDI system in hybrid vehicles, technological advancements (turbo GDI system), and rise in demand for passenger vehicles in developing countries are the factors expected to offer lucrative growth opportunities during the forecast period.

The global gasoline direct injection system market is segmented on the basis of component, engine type, vehicle type, sales channel, and region. Depending on component, it is classified into fuel injectors, fuel pumps, electronic control units, and others. Based on engine type, it is divided into 4 Cylinder, 6 Cylinder, 8 Cylinder, and others. According to vehicle type, it is fragmented into passenger cars and commercial vehicles. By sales channel, it is segmented into original equipment manufacturer and aftermarket. Region wise, it is analyzed across North America, Europe, Asia-Pacific, and LAMEA.

Gasoline Direct Injection (GDI) System Market

Some leading companies profiled in the gasoline direct injection system market report comprises Borgwarner Inc., Continental AG, Denso Corporation, Hitachi Ltd., Marelli Holdings Co., Ltd., Mitsubishi Electric Corporation, Motonic Corporation, Park-Ohio Holdings Corporation, Robert Bosch GmbH, and Stanadyne LLC.

Rise in Demand for Fuel & Thermal Efficiency and Enhanced Engine Performance

Several regulations have been implemented that require automobile manufacturers to reduce harmful emissions caused by automobiles. In addition, automakers are shifting towards manufacturing of vehicles with high fuel efficiency and enhanced engine performance. Therefore, automobile manufacturers adopt GDI engines as next generation platform, which, in turn, is expected to increase the demand for GDI system. Hence, rise in demand for fuel & thermal efficiency and enhanced engine performance drive the growth of the market.

Gasoline Direct Injection (GDI) System Market

Introduction of Stringent Regulations Associated with Emissions

Numerous countries across the globe have introduced stringent regulations in terms of emissions for automobiles owing to increase in level of CO2 emissions. For instance, in 2020, India introduced BS-VI emissions norms for automobile manufacturers. In addition, Europe already adopted European emissions standard “Euro 6” in 2015 and planning to adopt “EURO 7” emissions standard by 2025. Moreover, automobile manufacturers comply with these new emission standard to manufacture automobile with improved fuel efficiency and performance. Hence, introduction of stringent regulations associated with emissions is one of the factors that is expected to contribute in the growth of GDI system industry.

Growth in Inclination toward Engine Downsizing and Reduction in Weight of Vehicles

Engine downsizing is a method that aids in reducing emissions & fuel consumption of internal combustion engines. Manufacturers focus on engine downsizing to increase fuel efficiency and engine performance, owing to this reason. For instance, in 2021, Hyundai launched the new downsized engine named “SmartStream 3.5 FR T-GDI” to replace its 5.0-litre V8 engine. This inclination toward engine downsizing is expected to increase the demand for GDI system in future. Hence, growth in inclination toward engine downsizing and reduction in weight of vehicles drive the growth of the gasoline direct injection system market.

Gasoline Direct Injection (GDI) System Market

Key Benefits For Stakeholders

  • This report provides a quantitative analysis of the market segments, current trends, estimations, and dynamics of the gasoline direct injection (gdi) system market analysis from 2020 to 2030 to identify the prevailing gasoline direct injection (gdi) system market opportunities.
  • The market research is offered along with information related to key drivers, restraints, and opportunities.
  • Porter's five forces analysis highlights the potency of buyers and suppliers to enable stakeholders make profit-oriented business decisions and strengthen their supplier-buyer network.
  • In-depth analysis of the gasoline direct injection (gdi) system market segmentation assists to determine the prevailing market opportunities.
  • Major countries in each region are mapped according to their revenue contribution to the global market.
  • Market player positioning facilitates benchmarking and provides a clear understanding of the present position of the market players.
  • The report includes the analysis of the regional as well as global gasoline direct injection (gdi) system market trends, key players, market segments, application areas, and market growth strategies.

Gasoline Direct Injection (GDI) System Market Report Highlights

Aspects Details
By Component
  • Others
  • Fuel Injectors
  • Fuel Pumps
  • Electronic Control Units
By Engine Type
  • 4 cylinder
  • 6 cylinder
  • 8 cylinder
  • Others
By Vehicle Type
  • Passenger Cars
  • Commercial Vehicles
By Sales Channel
  • Original Equipment Manufacturer
  • Aftermarket
By Region
  • North America  (U.S., Canada, Mexico)
  • Europe  (United Kingdom, Germany, France, Russia, Rest of Europe)
  • Asia-Pacific  (China, Japan, India, South Korea, Rest Of Asia Pacific)
  • LAMEA  (Latin America, Middle East, Africa)
Key Market Players Stanadyne LLC, Denso Corporation, BorgWarner Inc., Robert Bosch GmbH, Hitachi, Ltd., Motonic Corporation, Marelli Holdings Co., Ltd., Mitsubishi Electric Corporation, Park-Ohio Holdings Corporation, Continental AG
Renesas Electronics Corporation(Japan), Nostrum Energy (U.S.), GP Performance(Germany), Infineon Technologies AG (Germany), Synerject LLC (U.S.)
 
  • CHAPTER 1:INTRODUCTION

    • 1.1.Report description

    • 1.2.Key market segments

    • 1.3.Key benefits to the stakeholders

    • 1.4.Research Methodology

      • 1.4.1.Secondary research

      • 1.4.2.Primary research

      • 1.4.3.Analyst tools and models

  • CHAPTER 2:EXECUTIVE SUMMARY

    • 2.1.Key findings of the study

    • 2.2.CXO Perspective

  • CHAPTER 3:MARKET OVERVIEW

    • 3.1.Market definition and scope

    • 3.2.Key findings

      • 3.2.1.Top investment pockets

    • 3.3.Porter’s five forces analysis

    • 3.4.Top player positioning

    • 3.5.Market dynamics

      • 3.5.1.Drivers

      • 3.5.2.Restraints

      • 3.5.3.Opportunities

    • 3.6.COVID-19 Impact Analysis on the market

  • CHAPTER 4: GASOLINE DIRECT INJECTION (GDI) SYSTEM MARKET, BY BY COMPONENT

    • 4.1 Overview

      • 4.1.1 Market size and forecast

    • 4.2 Fuel Injectors

      • 4.2.1 Key market trends, growth factors and opportunities

      • 4.2.2 Market size and forecast, by region

      • 4.2.3 Market analysis by country

    • 4.3 Fuel Pumps

      • 4.3.1 Key market trends, growth factors and opportunities

      • 4.3.2 Market size and forecast, by region

      • 4.3.3 Market analysis by country

    • 4.4 Electronic Control Units

      • 4.4.1 Key market trends, growth factors and opportunities

      • 4.4.2 Market size and forecast, by region

      • 4.4.3 Market analysis by country

    • 4.5 Others

      • 4.5.1 Key market trends, growth factors and opportunities

      • 4.5.2 Market size and forecast, by region

      • 4.5.3 Market analysis by country

  • CHAPTER 5: GASOLINE DIRECT INJECTION (GDI) SYSTEM MARKET, BY ENGINE TYPE

    • 5.1 Overview

      • 5.1.1 Market size and forecast

    • 5.2 4 cylinder

      • 5.2.1 Key market trends, growth factors and opportunities

      • 5.2.2 Market size and forecast, by region

      • 5.2.3 Market analysis by country

    • 5.3 6 cylinder

      • 5.3.1 Key market trends, growth factors and opportunities

      • 5.3.2 Market size and forecast, by region

      • 5.3.3 Market analysis by country

    • 5.4 8 cylinder

      • 5.4.1 Key market trends, growth factors and opportunities

      • 5.4.2 Market size and forecast, by region

      • 5.4.3 Market analysis by country

    • 5.5 Others

      • 5.5.1 Key market trends, growth factors and opportunities

      • 5.5.2 Market size and forecast, by region

      • 5.5.3 Market analysis by country

  • CHAPTER 6: GASOLINE DIRECT INJECTION (GDI) SYSTEM MARKET, BY VEHICLE TYPE

    • 6.1 Overview

      • 6.1.1 Market size and forecast

    • 6.2 Passenger Cars

      • 6.2.1 Key market trends, growth factors and opportunities

      • 6.2.2 Market size and forecast, by region

      • 6.2.3 Market analysis by country

    • 6.3 Commercial Vehicles

      • 6.3.1 Key market trends, growth factors and opportunities

      • 6.3.2 Market size and forecast, by region

      • 6.3.3 Market analysis by country

  • CHAPTER 7: GASOLINE DIRECT INJECTION (GDI) SYSTEM MARKET, BY SALES CHANNEL

    • 7.1 Overview

      • 7.1.1 Market size and forecast

    • 7.2 Original Equipment Manufacturer

      • 7.2.1 Key market trends, growth factors and opportunities

      • 7.2.2 Market size and forecast, by region

      • 7.2.3 Market analysis by country

    • 7.3 Aftermarket

      • 7.3.1 Key market trends, growth factors and opportunities

      • 7.3.2 Market size and forecast, by region

      • 7.3.3 Market analysis by country

  • CHAPTER 8: GASOLINE DIRECT INJECTION (GDI) SYSTEM MARKET, BY REGION

    • 8.1 Overview

      • 8.1.1 Market size and forecast

    • 8.2 North America

      • 8.2.1 Key trends and opportunities

      • 8.2.2 North America Market size and forecast, by By Component

      • 8.2.3 North America Market size and forecast, by Engine Type

      • 8.2.4 North America Market size and forecast, by Vehicle Type

      • 8.2.5 North America Market size and forecast, by Sales Channel

      • 8.2.6 North America Market size and forecast, by country

        • 8.2.6.1 U.S.
          • 8.2.6.1.1 Market size and forecast, by By Component
          • 8.2.6.1.2 Market size and forecast, by Engine Type
          • 8.2.6.1.3 Market size and forecast, by Vehicle Type
          • 8.2.6.1.4 Market size and forecast, by Sales Channel
        • 8.2.6.2 Canada
          • 8.2.6.2.1 Market size and forecast, by By Component
          • 8.2.6.2.2 Market size and forecast, by Engine Type
          • 8.2.6.2.3 Market size and forecast, by Vehicle Type
          • 8.2.6.2.4 Market size and forecast, by Sales Channel
        • 8.2.6.3 Mexico
          • 8.2.6.3.1 Market size and forecast, by By Component
          • 8.2.6.3.2 Market size and forecast, by Engine Type
          • 8.2.6.3.3 Market size and forecast, by Vehicle Type
          • 8.2.6.3.4 Market size and forecast, by Sales Channel
    • 8.3 Europe

      • 8.3.1 Key trends and opportunities

      • 8.3.2 Europe Market size and forecast, by By Component

      • 8.3.3 Europe Market size and forecast, by Engine Type

      • 8.3.4 Europe Market size and forecast, by Vehicle Type

      • 8.3.5 Europe Market size and forecast, by Sales Channel

      • 8.3.6 Europe Market size and forecast, by country

        • 8.3.6.1 United Kingdom
          • 8.3.6.1.1 Market size and forecast, by By Component
          • 8.3.6.1.2 Market size and forecast, by Engine Type
          • 8.3.6.1.3 Market size and forecast, by Vehicle Type
          • 8.3.6.1.4 Market size and forecast, by Sales Channel
        • 8.3.6.2 Germany
          • 8.3.6.2.1 Market size and forecast, by By Component
          • 8.3.6.2.2 Market size and forecast, by Engine Type
          • 8.3.6.2.3 Market size and forecast, by Vehicle Type
          • 8.3.6.2.4 Market size and forecast, by Sales Channel
        • 8.3.6.3 France
          • 8.3.6.3.1 Market size and forecast, by By Component
          • 8.3.6.3.2 Market size and forecast, by Engine Type
          • 8.3.6.3.3 Market size and forecast, by Vehicle Type
          • 8.3.6.3.4 Market size and forecast, by Sales Channel
        • 8.3.6.4 Russia
          • 8.3.6.4.1 Market size and forecast, by By Component
          • 8.3.6.4.2 Market size and forecast, by Engine Type
          • 8.3.6.4.3 Market size and forecast, by Vehicle Type
          • 8.3.6.4.4 Market size and forecast, by Sales Channel
        • 8.3.6.5 Rest of Europe
          • 8.3.6.5.1 Market size and forecast, by By Component
          • 8.3.6.5.2 Market size and forecast, by Engine Type
          • 8.3.6.5.3 Market size and forecast, by Vehicle Type
          • 8.3.6.5.4 Market size and forecast, by Sales Channel
    • 8.4 Asia-Pacific

      • 8.4.1 Key trends and opportunities

      • 8.4.2 Asia-Pacific Market size and forecast, by By Component

      • 8.4.3 Asia-Pacific Market size and forecast, by Engine Type

      • 8.4.4 Asia-Pacific Market size and forecast, by Vehicle Type

      • 8.4.5 Asia-Pacific Market size and forecast, by Sales Channel

      • 8.4.6 Asia-Pacific Market size and forecast, by country

        • 8.4.6.1 China
          • 8.4.6.1.1 Market size and forecast, by By Component
          • 8.4.6.1.2 Market size and forecast, by Engine Type
          • 8.4.6.1.3 Market size and forecast, by Vehicle Type
          • 8.4.6.1.4 Market size and forecast, by Sales Channel
        • 8.4.6.2 Japan
          • 8.4.6.2.1 Market size and forecast, by By Component
          • 8.4.6.2.2 Market size and forecast, by Engine Type
          • 8.4.6.2.3 Market size and forecast, by Vehicle Type
          • 8.4.6.2.4 Market size and forecast, by Sales Channel
        • 8.4.6.3 India
          • 8.4.6.3.1 Market size and forecast, by By Component
          • 8.4.6.3.2 Market size and forecast, by Engine Type
          • 8.4.6.3.3 Market size and forecast, by Vehicle Type
          • 8.4.6.3.4 Market size and forecast, by Sales Channel
        • 8.4.6.4 South Korea
          • 8.4.6.4.1 Market size and forecast, by By Component
          • 8.4.6.4.2 Market size and forecast, by Engine Type
          • 8.4.6.4.3 Market size and forecast, by Vehicle Type
          • 8.4.6.4.4 Market size and forecast, by Sales Channel
        • 8.4.6.5 Rest Of Asia Pacific
          • 8.4.6.5.1 Market size and forecast, by By Component
          • 8.4.6.5.2 Market size and forecast, by Engine Type
          • 8.4.6.5.3 Market size and forecast, by Vehicle Type
          • 8.4.6.5.4 Market size and forecast, by Sales Channel
    • 8.5 LAMEA

      • 8.5.1 Key trends and opportunities

      • 8.5.2 LAMEA Market size and forecast, by By Component

      • 8.5.3 LAMEA Market size and forecast, by Engine Type

      • 8.5.4 LAMEA Market size and forecast, by Vehicle Type

      • 8.5.5 LAMEA Market size and forecast, by Sales Channel

      • 8.5.6 LAMEA Market size and forecast, by country

        • 8.5.6.1 Latin America
          • 8.5.6.1.1 Market size and forecast, by By Component
          • 8.5.6.1.2 Market size and forecast, by Engine Type
          • 8.5.6.1.3 Market size and forecast, by Vehicle Type
          • 8.5.6.1.4 Market size and forecast, by Sales Channel
        • 8.5.6.2 Middle East
          • 8.5.6.2.1 Market size and forecast, by By Component
          • 8.5.6.2.2 Market size and forecast, by Engine Type
          • 8.5.6.2.3 Market size and forecast, by Vehicle Type
          • 8.5.6.2.4 Market size and forecast, by Sales Channel
        • 8.5.6.3 Africa
          • 8.5.6.3.1 Market size and forecast, by By Component
          • 8.5.6.3.2 Market size and forecast, by Engine Type
          • 8.5.6.3.3 Market size and forecast, by Vehicle Type
          • 8.5.6.3.4 Market size and forecast, by Sales Channel
  • CHAPTER 9: COMPANY LANDSCAPE

    • 9.1. Introduction

    • 9.2. Top winning strategies

    • 9.3. Product Mapping of Top 10 Player

    • 9.4. Competitive Dashboard

    • 9.5. Competitive Heatmap

    • 9.6. Key developments

  • CHAPTER 10: COMPANY PROFILES

    • 10.1 Denso Corporation

      • 10.1.1 Company overview

      • 10.1.2 Company snapshot

      • 10.1.3 Operating business segments

      • 10.1.4 Product portfolio

      • 10.1.5 Business performance

      • 10.1.6 Key strategic moves and developments

    • 10.2 Hitachi, Ltd.

      • 10.2.1 Company overview

      • 10.2.2 Company snapshot

      • 10.2.3 Operating business segments

      • 10.2.4 Product portfolio

      • 10.2.5 Business performance

      • 10.2.6 Key strategic moves and developments

    • 10.3 Marelli Holdings Co., Ltd.

      • 10.3.1 Company overview

      • 10.3.2 Company snapshot

      • 10.3.3 Operating business segments

      • 10.3.4 Product portfolio

      • 10.3.5 Business performance

      • 10.3.6 Key strategic moves and developments

    • 10.4 Mitsubishi Electric Corporation

      • 10.4.1 Company overview

      • 10.4.2 Company snapshot

      • 10.4.3 Operating business segments

      • 10.4.4 Product portfolio

      • 10.4.5 Business performance

      • 10.4.6 Key strategic moves and developments

    • 10.5 Motonic Corporation

      • 10.5.1 Company overview

      • 10.5.2 Company snapshot

      • 10.5.3 Operating business segments

      • 10.5.4 Product portfolio

      • 10.5.5 Business performance

      • 10.5.6 Key strategic moves and developments

    • 10.6 Park-Ohio Holdings Corporation

      • 10.6.1 Company overview

      • 10.6.2 Company snapshot

      • 10.6.3 Operating business segments

      • 10.6.4 Product portfolio

      • 10.6.5 Business performance

      • 10.6.6 Key strategic moves and developments

    • 10.7 Robert Bosch GmbH

      • 10.7.1 Company overview

      • 10.7.2 Company snapshot

      • 10.7.3 Operating business segments

      • 10.7.4 Product portfolio

      • 10.7.5 Business performance

      • 10.7.6 Key strategic moves and developments

    • 10.8 Stanadyne LLC

      • 10.8.1 Company overview

      • 10.8.2 Company snapshot

      • 10.8.3 Operating business segments

      • 10.8.4 Product portfolio

      • 10.8.5 Business performance

      • 10.8.6 Key strategic moves and developments

    • 10.9 Continental AG

      • 10.9.1 Company overview

      • 10.9.2 Company snapshot

      • 10.9.3 Operating business segments

      • 10.9.4 Product portfolio

      • 10.9.5 Business performance

      • 10.9.6 Key strategic moves and developments

    • 10.10 BorgWarner Inc.

      • 10.10.1 Company overview

      • 10.10.2 Company snapshot

      • 10.10.3 Operating business segments

      • 10.10.4 Product portfolio

      • 10.10.5 Business performance

      • 10.10.6 Key strategic moves and developments

  • LIST OF TABLES

  • TABLE 1. GLOBAL GASOLINE DIRECT INJECTION (GDI) SYSTEM MARKET, BY BY COMPONENT, 2020-2030,($MILLION)
    TABLE 2. GASOLINE DIRECT INJECTION (GDI) SYSTEM MARKET REVENUE, FOR FUEL INJECTORS, BY REGION , 2020-2030,($MILLION)
    TABLE 3. GASOLINE DIRECT INJECTION (GDI) SYSTEM MARKET FUEL INJECTORS BY COUNTRY, 2020-2030,($MILLION)
    TABLE 4. GASOLINE DIRECT INJECTION (GDI) SYSTEM MARKET REVENUE, FOR FUEL PUMPS, BY REGION , 2020-2030,($MILLION)
    TABLE 5. GASOLINE DIRECT INJECTION (GDI) SYSTEM MARKET FUEL PUMPS BY COUNTRY, 2020-2030,($MILLION)
    TABLE 6. GASOLINE DIRECT INJECTION (GDI) SYSTEM MARKET REVENUE, FOR ELECTRONIC CONTROL UNITS, BY REGION , 2020-2030,($MILLION)
    TABLE 7. GASOLINE DIRECT INJECTION (GDI) SYSTEM MARKET ELECTRONIC CONTROL UNITS BY COUNTRY, 2020-2030,($MILLION)
    TABLE 8. GASOLINE DIRECT INJECTION (GDI) SYSTEM MARKET REVENUE, FOR OTHERS, BY REGION , 2020-2030,($MILLION)
    TABLE 9. GASOLINE DIRECT INJECTION (GDI) SYSTEM MARKET OTHERS BY COUNTRY, 2020-2030,($MILLION)
    TABLE 10. GLOBAL GASOLINE DIRECT INJECTION (GDI) SYSTEM MARKET, BY ENGINE TYPE, 2020-2030,($MILLION)
    TABLE 11. GASOLINE DIRECT INJECTION (GDI) SYSTEM MARKET REVENUE, FOR 4 CYLINDER, BY REGION , 2020-2030,($MILLION)
    TABLE 12. GASOLINE DIRECT INJECTION (GDI) SYSTEM MARKET 4 CYLINDER BY COUNTRY, 2020-2030,($MILLION)
    TABLE 13. GASOLINE DIRECT INJECTION (GDI) SYSTEM MARKET REVENUE, FOR 6 CYLINDER, BY REGION , 2020-2030,($MILLION)
    TABLE 14. GASOLINE DIRECT INJECTION (GDI) SYSTEM MARKET 6 CYLINDER BY COUNTRY, 2020-2030,($MILLION)
    TABLE 15. GASOLINE DIRECT INJECTION (GDI) SYSTEM MARKET REVENUE, FOR 8 CYLINDER, BY REGION , 2020-2030,($MILLION)
    TABLE 16. GASOLINE DIRECT INJECTION (GDI) SYSTEM MARKET 8 CYLINDER BY COUNTRY, 2020-2030,($MILLION)
    TABLE 17. GASOLINE DIRECT INJECTION (GDI) SYSTEM MARKET REVENUE, FOR OTHERS, BY REGION , 2020-2030,($MILLION)
    TABLE 18. GASOLINE DIRECT INJECTION (GDI) SYSTEM MARKET OTHERS BY COUNTRY, 2020-2030,($MILLION)
    TABLE 19. GLOBAL GASOLINE DIRECT INJECTION (GDI) SYSTEM MARKET, BY VEHICLE TYPE, 2020-2030,($MILLION)
    TABLE 20. GASOLINE DIRECT INJECTION (GDI) SYSTEM MARKET REVENUE, FOR PASSENGER CARS, BY REGION , 2020-2030,($MILLION)
    TABLE 21. GASOLINE DIRECT INJECTION (GDI) SYSTEM MARKET PASSENGER CARS BY COUNTRY, 2020-2030,($MILLION)
    TABLE 22. GASOLINE DIRECT INJECTION (GDI) SYSTEM MARKET REVENUE, FOR COMMERCIAL VEHICLES, BY REGION , 2020-2030,($MILLION)
    TABLE 23. GASOLINE DIRECT INJECTION (GDI) SYSTEM MARKET COMMERCIAL VEHICLES BY COUNTRY, 2020-2030,($MILLION)
    TABLE 24. GLOBAL GASOLINE DIRECT INJECTION (GDI) SYSTEM MARKET, BY SALES CHANNEL, 2020-2030,($MILLION)
    TABLE 25. GASOLINE DIRECT INJECTION (GDI) SYSTEM MARKET REVENUE, FOR ORIGINAL EQUIPMENT MANUFACTURER, BY REGION , 2020-2030,($MILLION)
    TABLE 26. GASOLINE DIRECT INJECTION (GDI) SYSTEM MARKET ORIGINAL EQUIPMENT MANUFACTURER BY COUNTRY, 2020-2030,($MILLION)
    TABLE 27. GASOLINE DIRECT INJECTION (GDI) SYSTEM MARKET REVENUE, FOR AFTERMARKET, BY REGION , 2020-2030,($MILLION)
    TABLE 28. GASOLINE DIRECT INJECTION (GDI) SYSTEM MARKET AFTERMARKET BY COUNTRY, 2020-2030,($MILLION)
    TABLE 29. GASOLINE DIRECT INJECTION (GDI) SYSTEM MARKET, BY REGION, 2020-2030,($MILLION)
    TABLE 30. NORTH AMERICA GASOLINE DIRECT INJECTION (GDI) SYSTEM MARKET, BY BY COMPONENT, 2020-2030,($MILLION)
    TABLE 31. NORTH AMERICA GASOLINE DIRECT INJECTION (GDI) SYSTEM MARKET, BY ENGINE TYPE, 2020-2030,($MILLION)
    TABLE 32. NORTH AMERICA GASOLINE DIRECT INJECTION (GDI) SYSTEM MARKET, BY VEHICLE TYPE, 2020-2030,($MILLION)
    TABLE 33. NORTH AMERICA GASOLINE DIRECT INJECTION (GDI) SYSTEM MARKET, BY SALES CHANNEL, 2020-2030,($MILLION)
    TABLE 34. NORTH AMERICA GASOLINE DIRECT INJECTION (GDI) SYSTEM MARKET, BY COUNTRY, 2020-2030,($MILLION)
    TABLE 35. U.S. GASOLINE DIRECT INJECTION (GDI) SYSTEM MARKET BY BY COMPONENT 2020-2030,($MILLION)
    TABLE 36. U.S. GASOLINE DIRECT INJECTION (GDI) SYSTEM MARKET BY ENGINE TYPE 2020-2030,($MILLION)
    TABLE 37. U.S. GASOLINE DIRECT INJECTION (GDI) SYSTEM MARKET BY VEHICLE TYPE 2020-2030,($MILLION)
    TABLE 38. U.S. GASOLINE DIRECT INJECTION (GDI) SYSTEM MARKET BY SALES CHANNEL 2020-2030,($MILLION)
    TABLE 39. CANADA GASOLINE DIRECT INJECTION (GDI) SYSTEM MARKET BY BY COMPONENT 2020-2030,($MILLION)
    TABLE 40. CANADA GASOLINE DIRECT INJECTION (GDI) SYSTEM MARKET BY ENGINE TYPE 2020-2030,($MILLION)
    TABLE 41. CANADA GASOLINE DIRECT INJECTION (GDI) SYSTEM MARKET BY VEHICLE TYPE 2020-2030,($MILLION)
    TABLE 42. CANADA GASOLINE DIRECT INJECTION (GDI) SYSTEM MARKET BY SALES CHANNEL 2020-2030,($MILLION)
    TABLE 43. MEXICO GASOLINE DIRECT INJECTION (GDI) SYSTEM MARKET BY BY COMPONENT 2020-2030,($MILLION)
    TABLE 44. MEXICO GASOLINE DIRECT INJECTION (GDI) SYSTEM MARKET BY ENGINE TYPE 2020-2030,($MILLION)
    TABLE 45. MEXICO GASOLINE DIRECT INJECTION (GDI) SYSTEM MARKET BY VEHICLE TYPE 2020-2030,($MILLION)
    TABLE 46. MEXICO GASOLINE DIRECT INJECTION (GDI) SYSTEM MARKET BY SALES CHANNEL 2020-2030,($MILLION)
    TABLE 47. EUROPE GASOLINE DIRECT INJECTION (GDI) SYSTEM MARKET, BY BY COMPONENT, 2020-2030,($MILLION)
    TABLE 48. EUROPE GASOLINE DIRECT INJECTION (GDI) SYSTEM MARKET, BY ENGINE TYPE, 2020-2030,($MILLION)
    TABLE 49. EUROPE GASOLINE DIRECT INJECTION (GDI) SYSTEM MARKET, BY VEHICLE TYPE, 2020-2030,($MILLION)
    TABLE 50. EUROPE GASOLINE DIRECT INJECTION (GDI) SYSTEM MARKET, BY SALES CHANNEL, 2020-2030,($MILLION)
    TABLE 51. EUROPE GASOLINE DIRECT INJECTION (GDI) SYSTEM MARKET, BY COUNTRY, 2020-2030,($MILLION)
    TABLE 52. UNITED KINGDOM GASOLINE DIRECT INJECTION (GDI) SYSTEM MARKET BY BY COMPONENT 2020-2030,($MILLION)
    TABLE 53. UNITED KINGDOM GASOLINE DIRECT INJECTION (GDI) SYSTEM MARKET BY ENGINE TYPE 2020-2030,($MILLION)
    TABLE 54. UNITED KINGDOM GASOLINE DIRECT INJECTION (GDI) SYSTEM MARKET BY VEHICLE TYPE 2020-2030,($MILLION)
    TABLE 55. UNITED KINGDOM GASOLINE DIRECT INJECTION (GDI) SYSTEM MARKET BY SALES CHANNEL 2020-2030,($MILLION)
    TABLE 56. GERMANY GASOLINE DIRECT INJECTION (GDI) SYSTEM MARKET BY BY COMPONENT 2020-2030,($MILLION)
    TABLE 57. GERMANY GASOLINE DIRECT INJECTION (GDI) SYSTEM MARKET BY ENGINE TYPE 2020-2030,($MILLION)
    TABLE 58. GERMANY GASOLINE DIRECT INJECTION (GDI) SYSTEM MARKET BY VEHICLE TYPE 2020-2030,($MILLION)
    TABLE 59. GERMANY GASOLINE DIRECT INJECTION (GDI) SYSTEM MARKET BY SALES CHANNEL 2020-2030,($MILLION)
    TABLE 60. FRANCE GASOLINE DIRECT INJECTION (GDI) SYSTEM MARKET BY BY COMPONENT 2020-2030,($MILLION)
    TABLE 61. FRANCE GASOLINE DIRECT INJECTION (GDI) SYSTEM MARKET BY ENGINE TYPE 2020-2030,($MILLION)
    TABLE 62. FRANCE GASOLINE DIRECT INJECTION (GDI) SYSTEM MARKET BY VEHICLE TYPE 2020-2030,($MILLION)
    TABLE 63. FRANCE GASOLINE DIRECT INJECTION (GDI) SYSTEM MARKET BY SALES CHANNEL 2020-2030,($MILLION)
    TABLE 64. RUSSIA GASOLINE DIRECT INJECTION (GDI) SYSTEM MARKET BY BY COMPONENT 2020-2030,($MILLION)
    TABLE 65. RUSSIA GASOLINE DIRECT INJECTION (GDI) SYSTEM MARKET BY ENGINE TYPE 2020-2030,($MILLION)
    TABLE 66. RUSSIA GASOLINE DIRECT INJECTION (GDI) SYSTEM MARKET BY VEHICLE TYPE 2020-2030,($MILLION)
    TABLE 67. RUSSIA GASOLINE DIRECT INJECTION (GDI) SYSTEM MARKET BY SALES CHANNEL 2020-2030,($MILLION)
    TABLE 68. REST OF EUROPE GASOLINE DIRECT INJECTION (GDI) SYSTEM MARKET BY BY COMPONENT 2020-2030,($MILLION)
    TABLE 69. REST OF EUROPE GASOLINE DIRECT INJECTION (GDI) SYSTEM MARKET BY ENGINE TYPE 2020-2030,($MILLION)
    TABLE 70. REST OF EUROPE GASOLINE DIRECT INJECTION (GDI) SYSTEM MARKET BY VEHICLE TYPE 2020-2030,($MILLION)
    TABLE 71. REST OF EUROPE GASOLINE DIRECT INJECTION (GDI) SYSTEM MARKET BY SALES CHANNEL 2020-2030,($MILLION)
    TABLE 72. ASIA-PACIFIC GASOLINE DIRECT INJECTION (GDI) SYSTEM MARKET, BY BY COMPONENT, 2020-2030,($MILLION)
    TABLE 73. ASIA-PACIFIC GASOLINE DIRECT INJECTION (GDI) SYSTEM MARKET, BY ENGINE TYPE, 2020-2030,($MILLION)
    TABLE 74. ASIA-PACIFIC GASOLINE DIRECT INJECTION (GDI) SYSTEM MARKET, BY VEHICLE TYPE, 2020-2030,($MILLION)
    TABLE 75. ASIA-PACIFIC GASOLINE DIRECT INJECTION (GDI) SYSTEM MARKET, BY SALES CHANNEL, 2020-2030,($MILLION)
    TABLE 76. ASIA-PACIFIC GASOLINE DIRECT INJECTION (GDI) SYSTEM MARKET, BY COUNTRY, 2020-2030,($MILLION)
    TABLE 77. CHINA GASOLINE DIRECT INJECTION (GDI) SYSTEM MARKET BY BY COMPONENT 2020-2030,($MILLION)
    TABLE 78. CHINA GASOLINE DIRECT INJECTION (GDI) SYSTEM MARKET BY ENGINE TYPE 2020-2030,($MILLION)
    TABLE 79. CHINA GASOLINE DIRECT INJECTION (GDI) SYSTEM MARKET BY VEHICLE TYPE 2020-2030,($MILLION)
    TABLE 80. CHINA GASOLINE DIRECT INJECTION (GDI) SYSTEM MARKET BY SALES CHANNEL 2020-2030,($MILLION)
    TABLE 81. JAPAN GASOLINE DIRECT INJECTION (GDI) SYSTEM MARKET BY BY COMPONENT 2020-2030,($MILLION)
    TABLE 82. JAPAN GASOLINE DIRECT INJECTION (GDI) SYSTEM MARKET BY ENGINE TYPE 2020-2030,($MILLION)
    TABLE 83. JAPAN GASOLINE DIRECT INJECTION (GDI) SYSTEM MARKET BY VEHICLE TYPE 2020-2030,($MILLION)
    TABLE 84. JAPAN GASOLINE DIRECT INJECTION (GDI) SYSTEM MARKET BY SALES CHANNEL 2020-2030,($MILLION)
    TABLE 85. INDIA GASOLINE DIRECT INJECTION (GDI) SYSTEM MARKET BY BY COMPONENT 2020-2030,($MILLION)
    TABLE 86. INDIA GASOLINE DIRECT INJECTION (GDI) SYSTEM MARKET BY ENGINE TYPE 2020-2030,($MILLION)
    TABLE 87. INDIA GASOLINE DIRECT INJECTION (GDI) SYSTEM MARKET BY VEHICLE TYPE 2020-2030,($MILLION)
    TABLE 88. INDIA GASOLINE DIRECT INJECTION (GDI) SYSTEM MARKET BY SALES CHANNEL 2020-2030,($MILLION)
    TABLE 89. SOUTH KOREA GASOLINE DIRECT INJECTION (GDI) SYSTEM MARKET BY BY COMPONENT 2020-2030,($MILLION)
    TABLE 90. SOUTH KOREA GASOLINE DIRECT INJECTION (GDI) SYSTEM MARKET BY ENGINE TYPE 2020-2030,($MILLION)
    TABLE 91. SOUTH KOREA GASOLINE DIRECT INJECTION (GDI) SYSTEM MARKET BY VEHICLE TYPE 2020-2030,($MILLION)
    TABLE 92. SOUTH KOREA GASOLINE DIRECT INJECTION (GDI) SYSTEM MARKET BY SALES CHANNEL 2020-2030,($MILLION)
    TABLE 93. REST OF ASIA PACIFIC GASOLINE DIRECT INJECTION (GDI) SYSTEM MARKET BY BY COMPONENT 2020-2030,($MILLION)
    TABLE 94. REST OF ASIA PACIFIC GASOLINE DIRECT INJECTION (GDI) SYSTEM MARKET BY ENGINE TYPE 2020-2030,($MILLION)
    TABLE 95. REST OF ASIA PACIFIC GASOLINE DIRECT INJECTION (GDI) SYSTEM MARKET BY VEHICLE TYPE 2020-2030,($MILLION)
    TABLE 96. REST OF ASIA PACIFIC GASOLINE DIRECT INJECTION (GDI) SYSTEM MARKET BY SALES CHANNEL 2020-2030,($MILLION)
    TABLE 97. LAMEA GASOLINE DIRECT INJECTION (GDI) SYSTEM MARKET, BY BY COMPONENT, 2020-2030,($MILLION)
    TABLE 98. LAMEA GASOLINE DIRECT INJECTION (GDI) SYSTEM MARKET, BY ENGINE TYPE, 2020-2030,($MILLION)
    TABLE 99. LAMEA GASOLINE DIRECT INJECTION (GDI) SYSTEM MARKET, BY VEHICLE TYPE, 2020-2030,($MILLION)
    TABLE 100. LAMEA GASOLINE DIRECT INJECTION (GDI) SYSTEM MARKET, BY SALES CHANNEL, 2020-2030,($MILLION)
    TABLE 101. LAMEA GASOLINE DIRECT INJECTION (GDI) SYSTEM MARKET, BY COUNTRY, 2020-2030,($MILLION)
    TABLE 102. LATIN AMERICA GASOLINE DIRECT INJECTION (GDI) SYSTEM MARKET BY BY COMPONENT 2020-2030,($MILLION)
    TABLE 103. LATIN AMERICA GASOLINE DIRECT INJECTION (GDI) SYSTEM MARKET BY ENGINE TYPE 2020-2030,($MILLION)
    TABLE 104. LATIN AMERICA GASOLINE DIRECT INJECTION (GDI) SYSTEM MARKET BY VEHICLE TYPE 2020-2030,($MILLION)
    TABLE 105. LATIN AMERICA GASOLINE DIRECT INJECTION (GDI) SYSTEM MARKET BY SALES CHANNEL 2020-2030,($MILLION)
    TABLE 106. MIDDLE EAST GASOLINE DIRECT INJECTION (GDI) SYSTEM MARKET BY BY COMPONENT 2020-2030,($MILLION)
    TABLE 107. MIDDLE EAST GASOLINE DIRECT INJECTION (GDI) SYSTEM MARKET BY ENGINE TYPE 2020-2030,($MILLION)
    TABLE 108. MIDDLE EAST GASOLINE DIRECT INJECTION (GDI) SYSTEM MARKET BY VEHICLE TYPE 2020-2030,($MILLION)
    TABLE 109. MIDDLE EAST GASOLINE DIRECT INJECTION (GDI) SYSTEM MARKET BY SALES CHANNEL 2020-2030,($MILLION)
    TABLE 110. AFRICA GASOLINE DIRECT INJECTION (GDI) SYSTEM MARKET BY BY COMPONENT 2020-2030,($MILLION)
    TABLE 111. AFRICA GASOLINE DIRECT INJECTION (GDI) SYSTEM MARKET BY ENGINE TYPE 2020-2030,($MILLION)
    TABLE 112. AFRICA GASOLINE DIRECT INJECTION (GDI) SYSTEM MARKET BY VEHICLE TYPE 2020-2030,($MILLION)
    TABLE 113. AFRICA GASOLINE DIRECT INJECTION (GDI) SYSTEM MARKET BY SALES CHANNEL 2020-2030,($MILLION)
    TABLE 114. LTD.: COMPANY SNAPSHOT
    TABLE 115. LTD.: OPERATING SEGMENTS
    TABLE 116. LTD.: PRODUCT PORTFOLIO
    TABLE 117. LTD.: NET SALES,
    TABLE 118. LTD.: KEY STRATERGIES
    TABLE 119.DENSO CORPORATION: COMPANY SNAPSHOT
    TABLE 120.DENSO CORPORATION: OPERATING SEGMENTS
    TABLE 121.DENSO CORPORATION: PRODUCT PORTFOLIO
    TABLE 122.DENSO CORPORATION: NET SALES,
    TABLE 123.DENSO CORPORATION: KEY STRATERGIES
    TABLE 124.HITACHI, LTD.: COMPANY SNAPSHOT
    TABLE 125.HITACHI, LTD.: OPERATING SEGMENTS
    TABLE 126.HITACHI, LTD.: PRODUCT PORTFOLIO
    TABLE 127.HITACHI, LTD.: NET SALES,
    TABLE 128.HITACHI, LTD.: KEY STRATERGIES
    TABLE 129.MARELLI HOLDINGS CO., LTD.: COMPANY SNAPSHOT
    TABLE 130.MARELLI HOLDINGS CO., LTD.: OPERATING SEGMENTS
    TABLE 131.MARELLI HOLDINGS CO., LTD.: PRODUCT PORTFOLIO
    TABLE 132.MARELLI HOLDINGS CO., LTD.: NET SALES,
    TABLE 133.MARELLI HOLDINGS CO., LTD.: KEY STRATERGIES
    TABLE 134.MITSUBISHI ELECTRIC CORPORATION: COMPANY SNAPSHOT
    TABLE 135.MITSUBISHI ELECTRIC CORPORATION: OPERATING SEGMENTS
    TABLE 136.MITSUBISHI ELECTRIC CORPORATION: PRODUCT PORTFOLIO
    TABLE 137.MITSUBISHI ELECTRIC CORPORATION: NET SALES,
    TABLE 138.MITSUBISHI ELECTRIC CORPORATION: KEY STRATERGIES
    TABLE 139.MOTONIC CORPORATION: COMPANY SNAPSHOT
    TABLE 140.MOTONIC CORPORATION: OPERATING SEGMENTS
    TABLE 141.MOTONIC CORPORATION: PRODUCT PORTFOLIO
    TABLE 142.MOTONIC CORPORATION: NET SALES,
    TABLE 143.MOTONIC CORPORATION: KEY STRATERGIES
    TABLE 144.PARK-OHIO HOLDINGS CORPORATION: COMPANY SNAPSHOT
    TABLE 145.PARK-OHIO HOLDINGS CORPORATION: OPERATING SEGMENTS
    TABLE 146.PARK-OHIO HOLDINGS CORPORATION: PRODUCT PORTFOLIO
    TABLE 147.PARK-OHIO HOLDINGS CORPORATION: NET SALES,
    TABLE 148.PARK-OHIO HOLDINGS CORPORATION: KEY STRATERGIES
    TABLE 149.ROBERT BOSCH GMBH: COMPANY SNAPSHOT
    TABLE 150.ROBERT BOSCH GMBH: OPERATING SEGMENTS
    TABLE 151.ROBERT BOSCH GMBH: PRODUCT PORTFOLIO
    TABLE 152.ROBERT BOSCH GMBH: NET SALES,
    TABLE 153.ROBERT BOSCH GMBH: KEY STRATERGIES
    TABLE 154.STANADYNE LLC: COMPANY SNAPSHOT
    TABLE 155.STANADYNE LLC: OPERATING SEGMENTS
    TABLE 156.STANADYNE LLC: PRODUCT PORTFOLIO
    TABLE 157.STANADYNE LLC: NET SALES,
    TABLE 158.STANADYNE LLC: KEY STRATERGIES
    TABLE 159.CONTINENTAL AG: COMPANY SNAPSHOT
    TABLE 160.CONTINENTAL AG: OPERATING SEGMENTS
    TABLE 161.CONTINENTAL AG: PRODUCT PORTFOLIO
    TABLE 162.CONTINENTAL AG: NET SALES,
    TABLE 163.CONTINENTAL AG: KEY STRATERGIES
    TABLE 164.BORGWARNER INC.: COMPANY SNAPSHOT
    TABLE 165.BORGWARNER INC.: OPERATING SEGMENTS
    TABLE 166.BORGWARNER INC.: PRODUCT PORTFOLIO
    TABLE 167.BORGWARNER INC.: NET SALES,
    TABLE 168.BORGWARNER INC.: KEY STRATERGIES
  • LIST OF FIGURES

  • FIGURE 1.GASOLINE DIRECT INJECTION (GDI) SYSTEM MARKET SEGMENTATION
    FIGURE 2.GASOLINE DIRECT INJECTION (GDI) SYSTEM MARKET,2020-2030
    FIGURE 3.GASOLINE DIRECT INJECTION (GDI) SYSTEM MARKET,2020-2030
    FIGURE 4. TOP INVESTMENT POCKETS, BY REGION
    FIGURE 5.PORTER FIVE-1
    FIGURE 6.PORTER FIVE-2
    FIGURE 7.PORTER FIVE-3
    FIGURE 8.PORTER FIVE-4
    FIGURE 9.PORTER FIVE-5
    FIGURE 10.TOP PLAYER POSITIONING
    FIGURE 11.GASOLINE DIRECT INJECTION (GDI) SYSTEM MARKET:DRIVERS, RESTRAINTS AND OPPORTUNITIES
    FIGURE 11.GASOLINE DIRECT INJECTION (GDI) SYSTEM MARKET,BY BY COMPONENT,2020(%)
    FIGURE 12.COMPARATIVE SHARE ANALYSIS OF FUEL INJECTORS GASOLINE DIRECT INJECTION (GDI) SYSTEM MARKET,2020-2030(%)
    FIGURE 13.COMPARATIVE SHARE ANALYSIS OF FUEL PUMPS GASOLINE DIRECT INJECTION (GDI) SYSTEM MARKET,2020-2030(%)
    FIGURE 14.COMPARATIVE SHARE ANALYSIS OF ELECTRONIC CONTROL UNITS GASOLINE DIRECT INJECTION (GDI) SYSTEM MARKET,2020-2030(%)
    FIGURE 15.COMPARATIVE SHARE ANALYSIS OF OTHERS GASOLINE DIRECT INJECTION (GDI) SYSTEM MARKET,2020-2030(%)
    FIGURE 16.GASOLINE DIRECT INJECTION (GDI) SYSTEM MARKET,BY ENGINE TYPE,2020(%)
    FIGURE 17.COMPARATIVE SHARE ANALYSIS OF 4 CYLINDER GASOLINE DIRECT INJECTION (GDI) SYSTEM MARKET,2020-2030(%)
    FIGURE 18.COMPARATIVE SHARE ANALYSIS OF 6 CYLINDER GASOLINE DIRECT INJECTION (GDI) SYSTEM MARKET,2020-2030(%)
    FIGURE 19.COMPARATIVE SHARE ANALYSIS OF 8 CYLINDER GASOLINE DIRECT INJECTION (GDI) SYSTEM MARKET,2020-2030(%)
    FIGURE 20.COMPARATIVE SHARE ANALYSIS OF OTHERS GASOLINE DIRECT INJECTION (GDI) SYSTEM MARKET,2020-2030(%)
    FIGURE 21.GASOLINE DIRECT INJECTION (GDI) SYSTEM MARKET,BY VEHICLE TYPE,2020(%)
    FIGURE 22.COMPARATIVE SHARE ANALYSIS OF PASSENGER CARS GASOLINE DIRECT INJECTION (GDI) SYSTEM MARKET,2020-2030(%)
    FIGURE 23.COMPARATIVE SHARE ANALYSIS OF COMMERCIAL VEHICLES GASOLINE DIRECT INJECTION (GDI) SYSTEM MARKET,2020-2030(%)
    FIGURE 24.GASOLINE DIRECT INJECTION (GDI) SYSTEM MARKET,BY SALES CHANNEL,2020(%)
    FIGURE 25.COMPARATIVE SHARE ANALYSIS OF ORIGINAL EQUIPMENT MANUFACTURER GASOLINE DIRECT INJECTION (GDI) SYSTEM MARKET,2020-2030(%)
    FIGURE 26.COMPARATIVE SHARE ANALYSIS OF AFTERMARKET GASOLINE DIRECT INJECTION (GDI) SYSTEM MARKET,2020-2030(%)
    FIGURE 27.GASOLINE DIRECT INJECTION (GDI) SYSTEM MARKET BY REGION,2020
    FIGURE 28.U.S. GASOLINE DIRECT INJECTION (GDI) SYSTEM MARKET,2020-2030($MILLION)
    FIGURE 29.CANADA GASOLINE DIRECT INJECTION (GDI) SYSTEM MARKET,2020-2030($MILLION)
    FIGURE 30.MEXICO GASOLINE DIRECT INJECTION (GDI) SYSTEM MARKET,2020-2030($MILLION)
    FIGURE 31.UNITED KINGDOM GASOLINE DIRECT INJECTION (GDI) SYSTEM MARKET,2020-2030($MILLION)
    FIGURE 32.GERMANY GASOLINE DIRECT INJECTION (GDI) SYSTEM MARKET,2020-2030($MILLION)
    FIGURE 33.FRANCE GASOLINE DIRECT INJECTION (GDI) SYSTEM MARKET,2020-2030($MILLION)
    FIGURE 34.RUSSIA GASOLINE DIRECT INJECTION (GDI) SYSTEM MARKET,2020-2030($MILLION)
    FIGURE 35.REST OF EUROPE GASOLINE DIRECT INJECTION (GDI) SYSTEM MARKET,2020-2030($MILLION)
    FIGURE 36.CHINA GASOLINE DIRECT INJECTION (GDI) SYSTEM MARKET,2020-2030($MILLION)
    FIGURE 37.JAPAN GASOLINE DIRECT INJECTION (GDI) SYSTEM MARKET,2020-2030($MILLION)
    FIGURE 38.INDIA GASOLINE DIRECT INJECTION (GDI) SYSTEM MARKET,2020-2030($MILLION)
    FIGURE 39.SOUTH KOREA GASOLINE DIRECT INJECTION (GDI) SYSTEM MARKET,2020-2030($MILLION)
    FIGURE 40.REST OF ASIA PACIFIC GASOLINE DIRECT INJECTION (GDI) SYSTEM MARKET,2020-2030($MILLION)
    FIGURE 41.LATIN AMERICA GASOLINE DIRECT INJECTION (GDI) SYSTEM MARKET,2020-2030($MILLION)
    FIGURE 42.MIDDLE EAST GASOLINE DIRECT INJECTION (GDI) SYSTEM MARKET,2020-2030($MILLION)
    FIGURE 43.AFRICA GASOLINE DIRECT INJECTION (GDI) SYSTEM MARKET,2020-2030($MILLION)
    FIGURE 44. TOP WINNING STRATEGIES, BY YEAR
    FIGURE 45. TOP WINNING STRATEGIES, BY DEVELOPMENT
    FIGURE 46. TOP WINNING STRATEGIES, BY COMPANY
    FIGURE 47.PRODUCT MAPPING OF TOP 10 PLAYERS
    FIGURE 48.COMPETITIVE DASHBOARD
    FIGURE 49.COMPETITIVE HEATMAP OF TOP 10 KEY PLAYERS
    FIGURE 50. LTD..: NET SALES ,($MILLION)
    FIGURE 51.DENSO CORPORATION.: NET SALES ,($MILLION)
    FIGURE 52.HITACHI, LTD..: NET SALES ,($MILLION)
    FIGURE 53.MARELLI HOLDINGS CO., LTD..: NET SALES ,($MILLION)
    FIGURE 54.MITSUBISHI ELECTRIC CORPORATION.: NET SALES ,($MILLION)
    FIGURE 55.MOTONIC CORPORATION.: NET SALES ,($MILLION)
    FIGURE 56.PARK-OHIO HOLDINGS CORPORATION.: NET SALES ,($MILLION)
    FIGURE 57.ROBERT BOSCH GMBH.: NET SALES ,($MILLION)
    FIGURE 58.STANADYNE LLC.: NET SALES ,($MILLION)
    FIGURE 59.CONTINENTAL AG.: NET SALES ,($MILLION)
    FIGURE 60.BORGWARNER INC..: NET SALES ,($MILLION)


including introduction of stringent regulations associated with emissions and technological advancements, including turbo GDI system. Increase in focus on development of turbo GDI engines is observed to comply with emission norms introduced by several governments in their region. For instance, in April 2020, the Indian government mandated vehicle engines to be upgraded to BS stage VI to reduce emissions across the nation. To comply with BS-VI emission norms, automobile manufacturers, including Hyundai, Kia Motors, and Tata Motors introduced turbo GDI engines in their vehicles across India.

Several developments have been carried out by key players operating in the GDI system industry. In November 2021, Bosch launched Bosch HDEV6 high pressure injection valve for GDI engines to expand its product offerings in the market. Moreover, in May 2019, Delphi Technologies, a subsidiary of BorgWarner Inc., unveiled a new 500-bar GDI system, which reduces gasoline particulate emissions up to 50%.

Rise in demand for GDI system from developing countries, including Asia-Pacific along with increase in consumer preference toward fuel-efficient vehicles and government measures, including engine upgrades to reduce emissions supplement the market growth. Collaborations and acquisitions are expected to enable the leading players to enhance their product portfolios and expand into different regions.

PURCHASE OPTIONS

Call or Email us

U.S.-Canada Toll-free: +1-800-792-5285
Int'l : +1-503-894-6022
Europe : +44-845-528-1300
Email : help@alliedmarketresearch.com
 
FREQUENTLY ASKED QUESTIONS?

A. The global gasoline direct injection (GDI) system market was valued at $7.6 billion in 2020, and is projected to reach $20.4 billion by 2030, growing at a CAGR of 10.8% from 2021 to 2030.

A. GDI system directly injects fuel in combustion chamber. Gasoline gets highly compressed until being injected into the combustion chamber of each cylinder of the engine through a common rail fuel line. The main components of GDI system include fuel injectors, fuel pumps, sensors, and electronic control units.

A. The sample/company profiles for global gasoline direct injection (GDI) system market report can be obtained on demand from the AMR website. Also, the 24*7 chat support and direct call services are provided to procure the sample report.

A. The drivers for the gasoline direct injection system include rise in demand for fuel efficiency, increase in thermal efficiency & greater engine performance, surge in introduction of stringent regulations associated with emissions, and growth in inclination toward engine downsizing & reduced weight of vehicles.

A. The different engine types using GDI system include 4 Cylinder, 6 Cylinder, 8 Cylinder, and others.

A. The company profiles of the top market players of GDI system industry can be obtained from the company profile section mentioned in the report. This section includes analysis of top ten player’s operating in the GDI system industry.

A. Incorporation of GDI system in hybrid vehicles, technological advancements, and rise in demand for passenger vehicles in developing countries are the factors expected to offer lucrative growth opportunities during the forecast period.

A. In November 2021, Bosch has launched Bosch HDEV6 high pressure injection valve for gasoline direct injection engines in order to expand its aftermarket range. In October 2021, Marelli Holdings Co., Ltd. developed a fuel injector for internal combustion engines with capabilities of reaching 1,000 bar pressure level and also won 2021 PACE Award for developing this injector.

A. The upcoming trends of gasoline direct injection system include increasing adoption of turbo GDI system, and engine upgrades to reduce emissions.

A. Some leading companies profiled in the gasoline direct injection system market report comprises BorgWarner Inc., Continental AG, Denso Corporation, Hitachi Ltd., Marelli Holdings Co., Ltd., Mitsubishi Electric Corporation, Motonic Corporation, Park-Ohio Holdings Corporation, Robert Bosch GmbH, and Stanadyne LLC.

Looking for Customization?

 Customization Request

Have a Question?

 Speak with Analyst

Any Confusion?

 Inquire Before Buying

Have a glance of the Report

  Request Sample
RELATED TAGS

Purchase Full Report of
Gasoline Direct Injection (gdi) System Market

Start reading instantly.
This Report and over 66,983+ more Reports, Available with Avenue Library. T&C*.

  • Online Only
  • $3,456
  • Online cloud access only
  • Restricted print, copy, paste & download
  • Read only
  • Free industry update
    (Within 180 days)
  • Free report update in next update cycle
    (Mar 2023 - Mar 2024)
  • Data Pack
  • $3,840
  • Restricted to one authorized user
  • One print only
  • Available in
    Excel
  • Free industry update
    (Within 180 days)
  •   Free report update in next update cycle
    (Mar 2023 - Mar 2024)
  • Single User
  • $5,769
  • Restricted to one authorized user
  • One print only
  • Available in
    PDF
  • Free industry update
    (Within 180 days)
  •   Free report update in next update cycle
    (Mar 2023 - Mar 2024)
  • Five Users
  • $6,450
  • Limited to five authorized users
  • Print upto five copies
  • Available in
    PDF
  • Free industry update
    (Within 180 days)
  •   Free report update in next update cycle
    (Mar 2023 - Mar 2024)
  • Enterprise
    License/PDF

  • $10,995
  • Unlimited
    within
    company/enterprise
  • Available in Excel & PDF
  • Free industry update
    (Within 180 days)
  •   Free report update in next update cycle
    (Mar 2023 - Mar 2024)
  • Library
    Membership

  • $999 $ 1,175
    Per User/ Per month/ Billed annually
  • Published Content
    E-access
  • Company Profiles
    E-access
  • Newly Added Content Access
  • 10 PDF
    Downloads
  • 5 Excel Data
    Pack Downloads
  • 250 Company Profiles PDF Downloads
  • Buy Now

*Taxes/Fees, if applicable will be added during checkout. All prices in USD

RELATED REPORTS
 

Why Allied Market Research?


Infallible Methodology

To ensure high-level data integrity, accurate analysis, and impeccable forecasts

Analyst Support

For complete satisfaction

Customization

On-demand customization of scope of the report to exactly meet your needs

TARGETED MARKET VIEW

Targeted market view to provide pertinent information and save time of readers

Get fresh content delivered

Get insights on topics that are crucial for your business. Stay abreast of your interest areas.

Get Industry Data Alerts

Why Allied Market Research?

Infallible Methodology

To ensure high-level data integrity, accurate analysis, and impeccable forecasts

Analyst Support

For complete satisfaction

Customization

On-demand customization of scope of the report to exactly meet your needs

TARGETED MARKET VIEW

Targeted market view to provide pertinent information and save time of readers