0
2022
Glass Like Carbon Market

Glass Like Carbon Market

by Synthesis (Low Temperature Synthesis, High Temperature Synthesis), by By Application (Electrode Material, Surgical Implants, Semiconductors and Electronics, Temperature Management, Others): Global Opportunity Analysis and Industry Forecast, 2021-2031

Report Code: A13660
Jul 2022 | Pages: 222
Tables: 185
Charts: 49
  • Formats*:

  • pdf

    Single User License, Five User
    License & Enterprise User License

  • xls

    Data Pack Excel License

  • ppt

    It comes with the additional cost
    of $2500.00 contact sales.


Glass Like Carbon Market Research, 2031

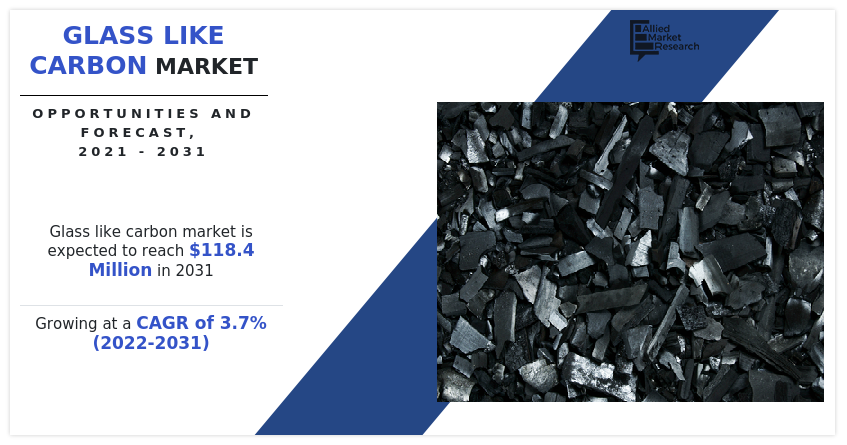
The global glass like carbon market was valued at $82.3 million in 2021, and is projected to reach $118.4 million by 2031, growing at a CAGR of 3.7% from 2022 to 2031.

Glass-like Carbon is a brittle form of carbon with exceptional properties which has paved new application areas for the carbon element. The material is very stable at high temperatures and continuous high-level heating or cooling does not cause any prominent effects on the material. These properties have made Glass-like Carbon desirable for applications where performance development has greater importance than cost.
The epoxy coating market has been negatively impacted due to the wake of the COVID-19 pandemic, owing to its dependence on electronics, automotive, aerospace, and other sectors. According to an article published by The Economic Times, the exports of electronic devices such as computers, smartphones, and others have dipped due to supply chain issues.

Glass Like Carbon Market, Glass Like Carbon Industry, Glass Like Carbon Market Size, Glass Like Carbon Market Share, Glass Like Carbon Market Growth, Glass Like Carbon Market Forecast, Glass Like Carbon Market Trend

The increase in demand for consumer electronics has surged the popularity of electrochemical coating applications where glass-like carbon is widely used as electrodes. For instance, according to a report published by National Investment Promotion and Facilitation Agency, India’s export of electronic devices is set to increase from $10 billion in 2021 to $120 billion by 2026. This is projected to enhance the demand for glass-like carbon in the growing electronics sector; thus fuelling the market growth. Furthermore, the rise in disposable income, rapid growth in population, and increase in urbanization has created a massive demand for regular and advanced electronic devices such as washing machines, smartphones, televisions, computers, and others where glass-like carbon-based semiconductors is widely used in integrated circuits. For instance, according to data published by International Data Corporation (IDC), the worldwide shipments for smart home devices have reached 801.5 million units in 2020 which is a 4.5% increase over 2019. This is projected to propel the growth of the glass-like carbon market during the forecast period.

However, the production of glass-like carbon requires highly sophisticated equipment. Also, the isolated chambers used during heat treatment are much costlier. This restrains the manufacturers with low investment potential to enter into the glass-like carbon production; thus, hampering the growth of the glass-like carbon market.

On the contrary, the emergence of compressed form of glassy carbon opens possibilities for aerospace applications where low weight and high strength materials are required. Furthermore, glassy carbon is ultra-strong, lightweight, elastic and electrically conductive that makes it best suited for use in integrated circuits, sensors, semiconductors, and other electronic devices of aircrafts. This factor is predicted to create remunerative opportunities for the expansion of the glass-like carbon market in the future.

The The glass like carbon market is segmented into synthesis, application and region. On the basis of synthesis, the market is bifurcated into low temperature synthesis and high temperature synthesis. Depending on application, it is fragmented into electrode material, surgical implants, semiconductors and electronics, temperature management, and others. Region-wise, the market is studied across North America, Europe, Asia-Pacific, and LAMEA.

The major companies profiled in this report include ALS Co., Ltd, Bioanalytical Systems, Inc, Final, Advanced Materials, Merck KGaA, Metrohm AG, PalmSens BV, Redoxme AB, Structure Probe, Inc., Tokai Carbon, and XRD Graphite Manufacturing Co., Ltd.
Glass Like Carbon Market

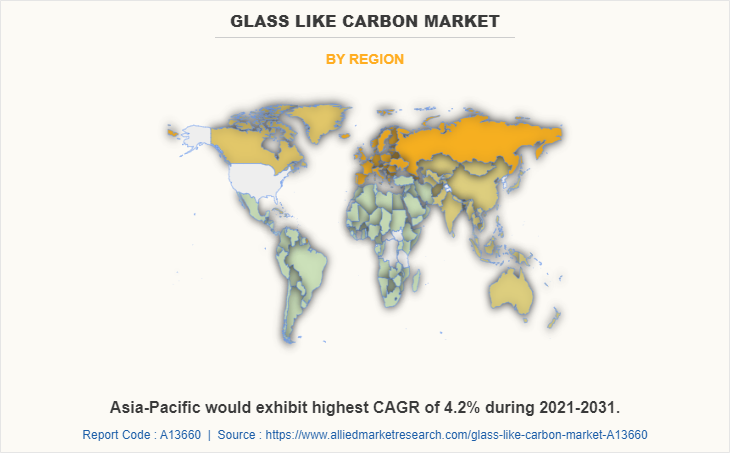
The Asia-Pacific glass-like carbon market size is projected to grow at the highest CAGR of 4.2% during the forecast period and accounted for 20.53% of glass-like carbon market share in 2021. This is attributed to the proliferating demand for glass-like carbon from various end-use sectors such as consumer electronics, aerospace, and others which in turn have led the glass-like carbon manufacturers to increase their production capacities. Furthermore, China's electronic sector which has forced the glass-like carbons manufacturers to produce more efficient glassy carbons used in used manufacturing diodes, integrated circuits, sensors, and others. Furthermore, countries such as Japan and Taiwan have a large electronics industry base and consumer electronics appliances industry which in turn has enhanced the performance of glass-like carbon market in the Asia-Pacific region.
Glass Like Carbon Market

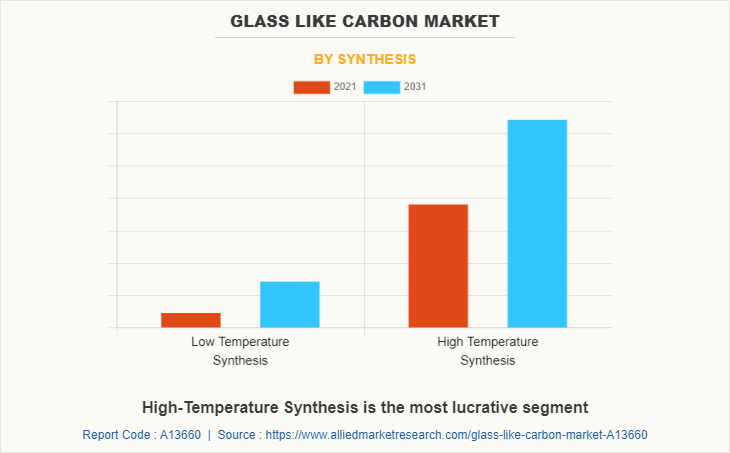
In 2021, the high temperature synthesis segment was the largest revenue generator, and is anticipated to grow at a CAGR of 3.8 during the forecast period. This is attributed to the fact that high temperature synthesis offers several advantages to the physical behavior of glassy carbon such as higher elastic modulus, greater polarity and wettability, better resistance to oxidation, and lower permeability to gases. Furthermore, the glassy carbon produced from high temperature synthesis has fewer impurities and is more electrically conductive as compared to glassy carbon produced from low temperature synthesis. These factors have made manufacturers become more linear towards adopting high temperature synthesis.

Glass Like Carbon Market
By Application

Your browser does not support the canvas element.

Surgical implants is projected as the fastest growing segment

Get more information on this report : Request Sample Pages

By application, the electrode material segment dominated the global market in 2021, and is anticipated to grow at a CAGR of 3.9% during forecast period. This is attributed to the fact that Rapid technological advancements coupled with rise in R&D activities has surged the development of fuel cell, batteries, and other materials where glassy carbon-based electrodes are widely used for electrochemical applications. For instance, according to a report published by National Institution for Transforming India (NITI) Aayog, India’s expected demand for advance batteries till 2030 is about 1100 GWh across different use cases. These factors are augmenting the growth of the electrode material segment in the global glass-like carbon market.

IMPACT OF COVID-19 ON THE GLOBAL GLASS-LIKE CARBON MARKET

  • The novel coronavirus is an incomparable global pandemic that has spread to over 180 countries and caused huge losses of lives and the economy around the globe.
  • The glass-like carbon market has been negatively impacted due to the wake of COVID-19 pandemic owing to its dependence on electronics, automotive, aerospace, and other sectors. According to an article published by The Economic Times, the exports of electronic devices such as computers, smartphones, and others have dipped due to supply chain issues.
  • Also, several electronics companies have either shutdown or shrank their operations due to the risk of infections among the workforce where glass-like carbon is used as semiconductors. This has temporarily hampered the demand for glass-like carbon market amid the COVID-19 period.  
  • In addition, the falling income of customers has led to contraction in demand for glass-like carbon based brake pad systems among the automotive sectors. For instance, according to a report published by Auto News, the sales of passenger cars saw a 30% decline in March 2020 as compared to March 2019, owing to lockdowns and shutdowns of auto plants.    
  • In addition, the travel restrictions imposed by the governments of various countries have led the aerospace & aviation sectors to witness temporary downfall.
  • In addition, the travel restrictions imposed by the governments of various countries have led the aerospace & aviation sectors to witness temporary downfall.
  • However, the rising sale of smartphones, laptops, tablets, and other consumer electronic devices have reported a rise in sales during the first quarter of 2021. This is anticipated to enhance the performance of glass-like carbon market for consumer electronics segments post COVID-19 scenario.

Key Benefits For Stakeholders

  • This report provides a quantitative analysis of the market segments, current trends, estimations, and dynamics of the glass-like carbon market analysis from 2021 to 2031 to identify the prevailing glass-like carbon market opportunities.
  • Market research is offered along with information related to key drivers, restraints, and opportunities.
  • Porter's five forces analysis highlights the potency of buyers and suppliers to enable stakeholders to make profit-oriented business decisions and strengthen their supplier-buyer network.
  • An in-depth analysis of the glass-like carbon market segmentation assists to determine the prevailing market opportunities.
  • Major countries in each region are mapped according to their revenue contribution to the global market.
  • Market player positioning facilitates benchmarking and provides a clear understanding of the present position of the market players.
  • The report includes the analysis of the regional as well as global glass-like carbon market trends, key players, market segments, application areas, and market growth strategies.

Glass Like Carbon Market Report Highlights

Aspects Details
By Synthesis
  • Low Temperature Synthesis
  • High Temperature Synthesis
By Application
  • Electrode Material
  • Surgical Implants
  • Semiconductors and Electronics
  • Temperature Management
  • Others
By Region
  • North America  (U.S., Canada, Mexico)
  • Europe  (Germany, United Kingdom, France, Spain, Italy, Rest of Europe)
  • Asia-Pacific  (China, India, Japan, South Korea, Australia, Rest of Asia-Pacific)
  • LAMEA  (Brazil, Saudi Arabia, South Afrfica, Rest of LAMEA)
Key Market Players XRD Graphite Manufacturing Co., Ltd, Redoxme AB, Structure Probe, Inc, Merck KGaA, Bioanalytical Systems, Inc., PalmSens BV, Tokai Carbon, Final Advanced Materials, Metrohm AG, ALS Co., Ltd
Others
 
  • CHAPTER 1:INTRODUCTION

    • 1.1.Report description

    • 1.2.Key market segments

    • 1.3.Key benefits to the stakeholders

    • 1.4.Research Methodology

      • 1.4.1.Secondary research

      • 1.4.2.Primary research

      • 1.4.3.Analyst tools and models

  • CHAPTER 2:EXECUTIVE SUMMARY

    • 2.1.Key findings of the study

    • 2.2.CXO Perspective

  • CHAPTER 3:MARKET OVERVIEW

    • 3.1.Market definition and scope

    • 3.2.Key findings

      • 3.2.1.Top investment pockets

    • 3.3.Porter’s five forces analysis

    • 3.4.Top player positioning

    • 3.5.Market dynamics

      • 3.5.1.Drivers

      • 3.5.2.Restraints

      • 3.5.3.Opportunities

    • 3.6.COVID-19 Impact Analysis on the market

    • 3.7.Pricing Analysis

    • 3.8.Value Chain Analysis

    • 3.9.Key Regulation Analysis

    • 3.10.Patent Landscape

  • CHAPTER 4: GLASS LIKE CARBON MARKET, BY SYNTHESIS

    • 4.1 Overview

      • 4.1.1 Market size and forecast

    • 4.2 Low Temperature Synthesis

      • 4.2.1 Key market trends, growth factors and opportunities

      • 4.2.2 Market size and forecast, by region

      • 4.2.3 Market analysis by country

    • 4.3 High Temperature Synthesis

      • 4.3.1 Key market trends, growth factors and opportunities

      • 4.3.2 Market size and forecast, by region

      • 4.3.3 Market analysis by country

  • CHAPTER 5: GLASS LIKE CARBON MARKET, BY BY APPLICATION

    • 5.1 Overview

      • 5.1.1 Market size and forecast

    • 5.2 Electrode Material

      • 5.2.1 Key market trends, growth factors and opportunities

      • 5.2.2 Market size and forecast, by region

      • 5.2.3 Market analysis by country

    • 5.3 Surgical Implants

      • 5.3.1 Key market trends, growth factors and opportunities

      • 5.3.2 Market size and forecast, by region

      • 5.3.3 Market analysis by country

    • 5.4 Semiconductors and Electronics

      • 5.4.1 Key market trends, growth factors and opportunities

      • 5.4.2 Market size and forecast, by region

      • 5.4.3 Market analysis by country

    • 5.5 Temperature Management

      • 5.5.1 Key market trends, growth factors and opportunities

      • 5.5.2 Market size and forecast, by region

      • 5.5.3 Market analysis by country

    • 5.6 Others

      • 5.6.1 Key market trends, growth factors and opportunities

      • 5.6.2 Market size and forecast, by region

      • 5.6.3 Market analysis by country

  • CHAPTER 6: GLASS LIKE CARBON MARKET, BY REGION

    • 6.1 Overview

      • 6.1.1 Market size and forecast

    • 6.2 North America

      • 6.2.1 Key trends and opportunities

      • 6.2.2 North America Market size and forecast, by Synthesis

      • 6.2.3 North America Market size and forecast, by By Application

      • 6.2.4 North America Market size and forecast, by country

        • 6.2.4.1 U.S.
          • 6.2.4.1.1 Market size and forecast, by Synthesis
          • 6.2.4.1.2 Market size and forecast, by By Application
        • 6.2.4.2 Canada
          • 6.2.4.2.1 Market size and forecast, by Synthesis
          • 6.2.4.2.2 Market size and forecast, by By Application
        • 6.2.4.3 Mexico
          • 6.2.4.3.1 Market size and forecast, by Synthesis
          • 6.2.4.3.2 Market size and forecast, by By Application
    • 6.3 Europe

      • 6.3.1 Key trends and opportunities

      • 6.3.2 Europe Market size and forecast, by Synthesis

      • 6.3.3 Europe Market size and forecast, by By Application

      • 6.3.4 Europe Market size and forecast, by country

        • 6.3.4.1 Germany
          • 6.3.4.1.1 Market size and forecast, by Synthesis
          • 6.3.4.1.2 Market size and forecast, by By Application
        • 6.3.4.2 United Kingdom
          • 6.3.4.2.1 Market size and forecast, by Synthesis
          • 6.3.4.2.2 Market size and forecast, by By Application
        • 6.3.4.3 France
          • 6.3.4.3.1 Market size and forecast, by Synthesis
          • 6.3.4.3.2 Market size and forecast, by By Application
        • 6.3.4.4 Spain
          • 6.3.4.4.1 Market size and forecast, by Synthesis
          • 6.3.4.4.2 Market size and forecast, by By Application
        • 6.3.4.5 Italy
          • 6.3.4.5.1 Market size and forecast, by Synthesis
          • 6.3.4.5.2 Market size and forecast, by By Application
        • 6.3.4.6 Rest of Europe
          • 6.3.4.6.1 Market size and forecast, by Synthesis
          • 6.3.4.6.2 Market size and forecast, by By Application
    • 6.4 Asia-Pacific

      • 6.4.1 Key trends and opportunities

      • 6.4.2 Asia-Pacific Market size and forecast, by Synthesis

      • 6.4.3 Asia-Pacific Market size and forecast, by By Application

      • 6.4.4 Asia-Pacific Market size and forecast, by country

        • 6.4.4.1 China
          • 6.4.4.1.1 Market size and forecast, by Synthesis
          • 6.4.4.1.2 Market size and forecast, by By Application
        • 6.4.4.2 India
          • 6.4.4.2.1 Market size and forecast, by Synthesis
          • 6.4.4.2.2 Market size and forecast, by By Application
        • 6.4.4.3 Japan
          • 6.4.4.3.1 Market size and forecast, by Synthesis
          • 6.4.4.3.2 Market size and forecast, by By Application
        • 6.4.4.4 South Korea
          • 6.4.4.4.1 Market size and forecast, by Synthesis
          • 6.4.4.4.2 Market size and forecast, by By Application
        • 6.4.4.5 Australia
          • 6.4.4.5.1 Market size and forecast, by Synthesis
          • 6.4.4.5.2 Market size and forecast, by By Application
        • 6.4.4.6 Rest of Asia-Pacific
          • 6.4.4.6.1 Market size and forecast, by Synthesis
          • 6.4.4.6.2 Market size and forecast, by By Application
    • 6.5 LAMEA

      • 6.5.1 Key trends and opportunities

      • 6.5.2 LAMEA Market size and forecast, by Synthesis

      • 6.5.3 LAMEA Market size and forecast, by By Application

      • 6.5.4 LAMEA Market size and forecast, by country

        • 6.5.4.1 Brazil
          • 6.5.4.1.1 Market size and forecast, by Synthesis
          • 6.5.4.1.2 Market size and forecast, by By Application
        • 6.5.4.2 Saudi Arabia
          • 6.5.4.2.1 Market size and forecast, by Synthesis
          • 6.5.4.2.2 Market size and forecast, by By Application
        • 6.5.4.3 South Afrfica
          • 6.5.4.3.1 Market size and forecast, by Synthesis
          • 6.5.4.3.2 Market size and forecast, by By Application
        • 6.5.4.4 Rest of LAMEA
          • 6.5.4.4.1 Market size and forecast, by Synthesis
          • 6.5.4.4.2 Market size and forecast, by By Application
  • CHAPTER 7: COMPANY LANDSCAPE

    • 7.1. Introduction

    • 7.2. Top winning strategies

    • 7.3. Product Mapping of Top 10 Player

    • 7.4. Competitive Dashboard

    • 7.5. Competitive Heatmap

    • 7.6. Key developments

  • CHAPTER 8: COMPANY PROFILES

    • 8.1 Bioanalytical Systems, Inc.

      • 8.1.1 Company overview

      • 8.1.2 Company snapshot

      • 8.1.3 Operating business segments

      • 8.1.4 Product portfolio

      • 8.1.5 Business performance

      • 8.1.6 Key strategic moves and developments

    • 8.2 ALS Co., Ltd

      • 8.2.1 Company overview

      • 8.2.2 Company snapshot

      • 8.2.3 Operating business segments

      • 8.2.4 Product portfolio

      • 8.2.5 Business performance

      • 8.2.6 Key strategic moves and developments

    • 8.3 Final Advanced Materials

      • 8.3.1 Company overview

      • 8.3.2 Company snapshot

      • 8.3.3 Operating business segments

      • 8.3.4 Product portfolio

      • 8.3.5 Business performance

      • 8.3.6 Key strategic moves and developments

    • 8.4 Merck KGaA

      • 8.4.1 Company overview

      • 8.4.2 Company snapshot

      • 8.4.3 Operating business segments

      • 8.4.4 Product portfolio

      • 8.4.5 Business performance

      • 8.4.6 Key strategic moves and developments

    • 8.5 Metrohm AG

      • 8.5.1 Company overview

      • 8.5.2 Company snapshot

      • 8.5.3 Operating business segments

      • 8.5.4 Product portfolio

      • 8.5.5 Business performance

      • 8.5.6 Key strategic moves and developments

    • 8.6 PalmSens BV

      • 8.6.1 Company overview

      • 8.6.2 Company snapshot

      • 8.6.3 Operating business segments

      • 8.6.4 Product portfolio

      • 8.6.5 Business performance

      • 8.6.6 Key strategic moves and developments

    • 8.7 Redoxme AB

      • 8.7.1 Company overview

      • 8.7.2 Company snapshot

      • 8.7.3 Operating business segments

      • 8.7.4 Product portfolio

      • 8.7.5 Business performance

      • 8.7.6 Key strategic moves and developments

    • 8.8 Structure Probe, Inc

      • 8.8.1 Company overview

      • 8.8.2 Company snapshot

      • 8.8.3 Operating business segments

      • 8.8.4 Product portfolio

      • 8.8.5 Business performance

      • 8.8.6 Key strategic moves and developments

    • 8.9 Tokai Carbon

      • 8.9.1 Company overview

      • 8.9.2 Company snapshot

      • 8.9.3 Operating business segments

      • 8.9.4 Product portfolio

      • 8.9.5 Business performance

      • 8.9.6 Key strategic moves and developments

    • 8.10 XRD Graphite Manufacturing Co., Ltd

      • 8.10.1 Company overview

      • 8.10.2 Company snapshot

      • 8.10.3 Operating business segments

      • 8.10.4 Product portfolio

      • 8.10.5 Business performance

      • 8.10.6 Key strategic moves and developments

  • LIST OF TABLES

  • TABLE 01. GLASS-LIKE CARBON MARKET, BY SYNTHESIS, 2021–2031 ($MILLION)
    TABLE 02. GLASS-LIKE CARBON MARKET, BY SYNTHESIS, 2021–2031 (TONS)
    TABLE 03. GLASS-LIKE CARBON MARKET FOR LOW-TEMPERATURE SYNTHESIS, BY REGION, 2021–2031 ($MILLION)
    TABLE 04. GLASS-LIKE CARBON MARKET FOR LOW-TEMPERATURE SYNTHESIS, BY REGION, 2021–2031 (TONS)
    TABLE 05. GLASS-LIKE CARBON MARKET FOR HIGH-TEMPERATURE SYNTHESIS, BY REGION, 2021–2031 ($MILLION)
    TABLE 06. GLASS-LIKE CARBON MARKET FOR HIGH-TEMPERATURE SYNTHESIS, BY REGION, 2021–2031 (TONS)
    TABLE 07. GLASS-LIKE CARBON MARKET, BY APPLICATION, 2021–2031 ($MILLION)
    TABLE 08. GLASS-LIKE CARBON MARKET, BY APPLICATION, 2021–2031 (TONS)
    TABLE 09. GLASS-LIKE CARBON MARKET FOR ELECTRODE MATERIAL, BY REGION, 2021–2031 ($MILLION)
    TABLE 10. GLASS-LIKE CARBON MARKET FOR ELECTRODE MATERIAL, BY REGION, 2021–2031 (TONS)
    TABLE 11. GLASS-LIKE CARBON MARKET FOR SURGICAL IMPLANTS, BY REGION, 2021–2031 ($MILLION)
    TABLE 12. GLASS-LIKE CARBON MARKET FOR SURGICAL IMPLANTS, BY REGION, 2021–2031 (TONS)
    TABLE 13. GLASS-LIKE CARBON MARKET FOR SEMICONDUCTORS AND ELECTRONICS, BY REGION, 2021–2031 ($MILLION)
    TABLE 14. GLASS-LIKE CARBON MARKET FOR SEMICONDUCTORS AND ELECTRONICS, BY REGION, 2021–2031 (TONS)
    TABLE 15. GLASS-LIKE CARBON MARKET FOR TEMPERATURE MANAGEMENT, BY REGION, 2021–2031 ($MILLION)
    TABLE 16. GLASS-LIKE CARBON MARKET FOR TEMPERATURE MANAGEMENT, BY REGION, 2021–2031 (TONS)
    TABLE 17. GLASS-LIKE CARBON MARKET FOR OTHERS, BY REGION, 2021–2031 ($MILLION)
    TABLE 18. GLASS-LIKE CARBON MARKET FOR OTHERS, BY REGION, 2021–2031 (TONS)
    TABLE 19. GLASS-LIKE CARBON MARKET, BY REGION, 2021–2031 ($MILLION)
    TABLE 20. GLASS-LIKE CARBON MARKET, BY REGION, 2021–2031 (TONS)
    TABLE 21. NORTH AMERICA GLASS-LIKE CARBON MARKET, BY SYNTHESIS, 2021–2031 ($MILLION)
    TABLE 22. NORTH AMERICA GLASS-LIKE CARBON MARKET, BY SYNTHESIS, 2021–2031 (TONS)
    TABLE 23. NORTH AMERICA GLASS-LIKE CARBON MARKET, BY APPLICATION, 2021–2031 ($MILLION)
    TABLE 24. NORTH AMERICA GLASS-LIKE CARBON MARKET, BY APPLICATION, 2021–2031 (TONS)
    TABLE 25. NORTH AMERICA GLASS-LIKE CARBON MARKET, BY COUNTRY, 2021–2031 ($MILLION)
    TABLE 26. NORTH AMERICA GLASS-LIKE CARBON MARKET, BY COUNTRY, 2021–2031 (TONS)
    TABLE 27. U.S. GLASS-LIKE CARBON MARKET, BY SYNTHESIS, 2021–2031 ($MILLION)
    TABLE 28. U.S. GLASS-LIKE CARBON MARKET, BY SYNTHESIS, 2021–2031 (TONS)
    TABLE 29. U.S. GLASS-LIKE CARBON MARKET, BY APPLICATION, 2021–2031 ($MILLION)
    TABLE 30. U.S. GLASS-LIKE CARBON MARKET, BY APPLICATION, 2021–2031 (TONS)
    TABLE 31. CANADA GLASS-LIKE CARBON MARKET, BY SYNTHESIS, 2021–2031 ($MILLION)
    TABLE 32. CANADA GLASS-LIKE CARBON MARKET, BY SYNTHESIS, 2021–2031 (TONS)
    TABLE 33. CANADA GLASS-LIKE CARBON MARKET, BY APPLICATION, 2021–2031 ($MILLION)
    TABLE 34. CANADA GLASS-LIKE CARBON MARKET, BY APPLICATION, 2021–2031 (TONS)
    TABLE 35. MEXICO GLASS-LIKE CARBON MARKET, BY SYNTHESIS, 2021–2031 ($MILLION)
    TABLE 36. MEXICO GLASS-LIKE CARBON MARKET, BY SYNTHESIS, 2021–2031 (TONS)
    TABLE 37. MEXICO GLASS-LIKE CARBON MARKET, BY APPLICATION, 2021–2031 ($MILLION)
    TABLE 38. MEXICO GLASS-LIKE CARBON MARKET, BY APPLICATION, 2021–2031 (TONS)
    TABLE 39. EUROPE GLASS-LIKE CARBON MARKET, BY SYNTHESIS, 2021–2031 ($MILLION)
    TABLE 40. EUROPE GLASS-LIKE CARBON MARKET, BY SYNTHESIS, 2021–2031 (TONS)
    TABLE 41. EUROPE GLASS-LIKE CARBON MARKET, BY APPLICATION, 2021–2031 ($MILLION)
    TABLE 42. EUROPE GLASS-LIKE CARBON MARKET, BY APPLICATION, 2021–2031 (TONS)
    TABLE 43. EUROPE GLASS-LIKE CARBON MARKET, BY COUNTRY, 2021–2031 ($MILLION)
    TABLE 44. EUROPE GLASS-LIKE CARBON MARKET, BY COUNTRY, 2021–2031 (TONS)
    TABLE 45. GERMANY GLASS-LIKE CARBON MARKET, BY SYNTHESIS, 2021–2031 ($MILLION)
    TABLE 46. GERMANY GLASS-LIKE CARBON MARKET, BY SYNTHESIS, 2021–2031 (TONS)
    TABLE 47. GERMANY GLASS-LIKE CARBON MARKET, BY APPLICATION, 2021–2031 ($MILLION)
    TABLE 48. GERMANY GLASS-LIKE CARBON MARKET, BY APPLICATION, 2021–2031 (TONS)
    TABLE 49. FRANCE GLASS-LIKE CARBON MARKET, BY SYNTHESIS, 2021–2031 ($MILLION)
    TABLE 50. FRANCE GLASS-LIKE CARBON MARKET, BY SYNTHESIS, 2021–2031 (TONS)
    TABLE 51. FRANCE GLASS-LIKE CARBON MARKET, BY APPLICATION, 2021–2031 ($MILLION)
    TABLE 52. FRANCE GLASS-LIKE CARBON MARKET, BY APPLICATION, 2021–2031 (TONS)
    TABLE 53. UK GLASS-LIKE CARBON MARKET, BY SYNTHESIS, 2021–2031 ($MILLION)
    TABLE 54. UK GLASS-LIKE CARBON MARKET, BY SYNTHESIS, 2021–2031 (TONS)
    TABLE 55. UK GLASS-LIKE CARBON MARKET, BY APPLICATION, 2021–2031 ($MILLION)
    TABLE 56. UK GLASS-LIKE CARBON MARKET, BY APPLICATION, 2021–2031 (TONS)
    TABLE 57. ITALY GLASS-LIKE CARBON MARKET, BY SYNTHESIS, 2021–2031 ($MILLION)
    TABLE 58. ITALY GLASS-LIKE CARBON MARKET, BY SYNTHESIS, 2021–2031 (TONS)
    TABLE 59. ITALY GLASS-LIKE CARBON MARKET, BY APPLICATION, 2021–2031 ($MILLION)
    TABLE 60. ITALY GLASS-LIKE CARBON MARKET, BY APPLICATION, 2021–2031 (TONS)
    TABLE 61. SPAIN GLASS-LIKE CARBON MARKET, BY SYNTHESIS, 2021–2031 ($MILLION)
    TABLE 62. SPAIN GLASS-LIKE CARBON MARKET, BY SYNTHESIS, 2021–2031 (TONS)
    TABLE 63. SPAIN GLASS-LIKE CARBON MARKET, BY APPLICATION, 2021–2031 ($MILLION)
    TABLE 64. SPAIN GLASS-LIKE CARBON MARKET, BY APPLICATION, 2021–2031 (TONS)
    TABLE 65. REST OF EUROPE GLASS-LIKE CARBON MARKET, BY SYNTHESIS, 2021–2031 ($MILLION)
    TABLE 66. REST OF EUROPE GLASS-LIKE CARBON MARKET, BY SYNTHESIS, 2021–2031 (TONS)
    TABLE 67. REST OF EUROPE GLASS-LIKE CARBON MARKET, BY APPLICATION, 2021–2031 ($MILLION)
    TABLE 68. REST OF EUROPE GLASS-LIKE CARBON MARKET, BY APPLICATION, 2021–2031 (TONS)
    TABLE 69. ASIA-PACIFIC GLASS-LIKE CARBON MARKET, BY SYNTHESIS, 2021–2031 ($MILLION)
    TABLE 70. ASIA-PACIFIC GLASS-LIKE CARBON MARKET, BY SYNTHESIS, 2021–2031 (TONS)
    TABLE 71. ASIA-PACIFIC GLASS-LIKE CARBON MARKET, BY APPLICATION, 2021–2031 ($MILLION)
    TABLE 72. ASIA-PACIFIC GLASS-LIKE CARBON MARKET, BY APPLICATION, 2021–2031 (TONS)
    TABLE 73. ASIA-PACIFIC GLASS-LIKE CARBON MARKET, BY COUNTRY, 2021–2031 ($MILLION)
    TABLE 74. ASIA-PACIFIC GLASS-LIKE CARBON MARKET, BY COUNTRY, 2021–2031 (TONS)
    TABLE 75. CHINA GLASS-LIKE CARBON MARKET, BY SYNTHESIS, 2021–2031 ($MILLION)
    TABLE 76. CHINA GLASS-LIKE CARBON MARKET, BY SYNTHESIS, 2021–2031 (TONS)
    TABLE 77. CHINA GLASS-LIKE CARBON MARKET, BY APPLICATION, 2021–2031 ($MILLION)
    TABLE 78. CHINA GLASS-LIKE CARBON MARKET, BY APPLICATION, 2021–2031 (TONS)
    TABLE 79. JAPAN GLASS-LIKE CARBON MARKET, BY SYNTHESIS, 2021–2031 ($MILLION)
    TABLE 80. JAPAN GLASS-LIKE CARBON MARKET, BY SYNTHESIS, 2021–2031 (TONS)
    TABLE 81. JAPAN GLASS-LIKE CARBON MARKET, BY APPLICATION, 2021–2031 ($MILLION)
    TABLE 82. JAPAN GLASS-LIKE CARBON MARKET, BY APPLICATION, 2021–2031 (TONS)
    TABLE 83. INDIA GLASS-LIKE CARBON MARKET, BY SYNTHESIS, 2021–2031 ($MILLION)
    TABLE 84. INDIA GLASS-LIKE CARBON MARKET, BY SYNTHESIS, 2021–2031 (TONS)
    TABLE 85. INDIA GLASS-LIKE CARBON MARKET, BY APPLICATION, 2021–2031 ($MILLION)
    TABLE 86. INDIA GLASS-LIKE CARBON MARKET, BY APPLICATION, 2021–2031 (TONS)
    TABLE 87. AUSTRALIA GLASS-LIKE CARBON MARKET, BY SYNTHESIS, 2021–2031 ($MILLION)
    TABLE 88. AUSTRALIA GLASS-LIKE CARBON MARKET, BY SYNTHESIS, 2021–2031 (TONS)
    TABLE 89. AUSTRALIA GLASS-LIKE CARBON MARKET, BY APPLICATION, 2021–2031 ($MILLION)
    TABLE 90. AUSTRALIA GLASS-LIKE CARBON MARKET, BY APPLICATION, 2021–2031 (TONS)
    TABLE 91. SOUTH KOREA GLASS-LIKE CARBON MARKET, BY SYNTHESIS, 2021–2031 ($MILLION)
    TABLE 92. SOUTH KOREA GLASS-LIKE CARBON MARKET, BY SYNTHESIS, 2021–2031 (TONS)
    TABLE 93. SOUTH KOREA GLASS-LIKE CARBON MARKET, BY APPLICATION, 2021–2031 ($MILLION)
    TABLE 94. SOUTH KOREA GLASS-LIKE CARBON MARKET, BY APPLICATION, 2021–2031 (TONS)
    TABLE 95. REST OF ASIA-PACIFIC GLASS-LIKE CARBON MARKET, BY SYNTHESIS, 2021–2031 ($MILLION)
    TABLE 96. REST OF ASIA-PACIFIC GLASS-LIKE CARBON MARKET, BY SYNTHESIS, 2021–2031 (TONS)
    TABLE 97. REST OF ASIA-PACIFIC GLASS-LIKE CARBON MARKET, BY APPLICATION, 2021–2031 ($MILLION)
    TABLE 98. REST OF ASIA-PACIFIC GLASS-LIKE CARBON MARKET, BY APPLICATION, 2021–2031 (TONS)
    TABLE 99. LAMEA GLASS-LIKE CARBON MARKET, BY SYNTHESIS, 2021–2031 ($MILLION)
    TABLE 100. LAMEA GLASS-LIKE CARBON MARKET, BY SYNTHESIS, 2021–2031 (TONS)
    TABLE 101. LAMEA GLASS-LIKE CARBON MARKET, BY APPLICATION, 2021–2031 ($MILLION)
    TABLE 102. LAMEA GLASS-LIKE CARBON MARKET, BY APPLICATION, 2021–2031 (TONS)
    TABLE 103. LAMEA GLASS-LIKE CARBON MARKET, BY COUNTRY, 2021–2031 ($MILLION)
    TABLE 104. LAMEA GLASS-LIKE CARBON MARKET, BY COUNTRY, 2021–2031 (TONS)
    TABLE 105. BRAZIL GLASS-LIKE CARBON MARKET, BY SYNTHESIS, 2021–2031 ($MILLION)
    TABLE 106. BRAZIL GLASS-LIKE CARBON MARKET, BY SYNTHESIS, 2021–2031 (TONS)
    TABLE 107. BRAZIL GLASS-LIKE CARBON MARKET, BY APPLICATION, 2021–2031 ($MILLION)
    TABLE 108. BRAZIL GLASS-LIKE CARBON MARKET, BY APPLICATION, 2021–2031 (TONS)
    TABLE 109. SAUDI ARABIA GLASS-LIKE CARBON MARKET, BY SYNTHESIS, 2021–2031 ($MILLION)
    TABLE 110. SAUDI ARABIA GLASS-LIKE CARBON MARKET, BY SYNTHESIS, 2021–2031 (TONS)
    TABLE 111. SAUDI ARABIA GLASS-LIKE CARBON MARKET, BY APPLICATION, 2021–2031 ($MILLION)
    TABLE 112. SAUDI ARABIA GLASS-LIKE CARBON MARKET, BY APPLICATION, 2021–2031 (TONS)
    TABLE 113. SOUTH AFRICA GLASS-LIKE CARBON MARKET, BY SYNTHESIS, 2021–2031 ($MILLION)
    TABLE 114. SOUTH AFRICA GLASS-LIKE CARBON MARKET, BY SYNTHESIS, 2021–2031 (TONS)
    TABLE 115. SOUTH AFRICA GLASS-LIKE CARBON MARKET, BY APPLICATION, 2021–2031 ($MILLION)
    TABLE 116. SOUTH AFRICA GLASS-LIKE CARBON MARKET, BY APPLICATION, 2021–2031 (TONS)
    TABLE 117. REST OF LAMEA GLASS-LIKE CARBON MARKET, BY SYNTHESIS, 2021–2031 ($MILLION)
    TABLE 118. REST OF LAMEA GLASS-LIKE CARBON MARKET, BY SYNTHESIS, 2021–2031 (TONS)
    TABLE 119. REST OF LAMEA GLASS-LIKE CARBON MARKET, BY APPLICATION, 2021–2031 ($MILLION)
    TABLE 120. REST OF LAMEA GLASS-LIKE CARBON MARKET, BY APPLICATION, 2021–2031 (TONS)
    TABLE 121. ALS CO., LTD: COMPANY SNAPSHOT
    TABLE 122. ALS CO., LTD: PRODUCT PORTFOLIO
    TABLE 123. BIOANALYTICAL SYSTEMS, INC: COMPANY SNAPSHOT
    TABLE 124. BIOANALYTICAL SYSTEMS, INC: PRODUCT PORTFOLIO
    TABLE 125. FINAL ADVANCED MATERIALS: COMPANY SNAPSHOT
    TABLE 126. FINAL ADVANCED MATERIALS: PRODUCT PORTFOLIO
    TABLE 127. MERCK KGAA: COMPANY SNAPSHOT
    TABLE 128. MERCK KGAA.: OPERATING SEGMENTS
    TABLE 129. MERCK KGAA : PRODUCT PORTFOLIO
    TABLE 130. OVERALL FINANCIAL STATUS ($MILLION)
    TABLE 131. MERCK KGAA: REVENUE SHARE BY REGION, 2021 (%)
    TABLE 132. METROHM AG: COMPANY SNAPSHOT
    TABLE 133. METROHM AG: PRODUCT PORTFOLIO
    TABLE 134. PALMSENS BV: COMPANY SNAPSHOT
    TABLE 135. PALMSENS BV: PRODUCT PORTFOLIO
    TABLE 136. REDOXME AB: COMPANY SNAPSHOT
    TABLE 137. REDOXME AB: PRODUCT PORTFOLIO
    TABLE 138. STRUCTURE PROBE, INC: COMPANY SNAPSHOT
    TABLE 139. STRUCTURE PROBE, INC:PRODUCT PORTFOLIO
    TABLE 140. TOKAI CARBON: COMPANY SNAPSHOT
    TABLE 141. TOKAI CARBON: PRODUCT PORTFOLIO
    TABLE 142. XRD GRAPHITE MANUFACTURING CO., LTD: COMPANY SNAPSHOT
    TABLE 143. XRD GRAPHITE MANUFACTURING CO., LTD: PRODUCT PORTFOLIO
  • LIST OF FIGURES

  • FIGURE 01. GLASS-LIKE CARBON MARKET SNAPSHOT
    FIGURE 02. GLASS-LIKE CARBON MARKET SEGMENTATION
    FIGURE 03. TOP INVESTMENT POCKETS
    FIGURE 04. MODERATE BARGAINING POWER OF SUPPLIERS
    FIGURE 05. HIGH BARGAINING POWER OF BUYERS
    FIGURE 06. HIGH THREAT OF NEW ENTRANTS
    FIGURE 07. MODERATE THREAT OF SUBSTITUTES
    FIGURE 08. MODERATE COMPETITIVE RIVALRY
    FIGURE 09. GLASS-LIKE CARBON MARKET DYNAMICS
    FIGURE 10. VALUE CHAIN ANALYSIS
    FIGURE 11. GLASS-LIKE CARBON MARKET, PRICING ANALYSIS, BY PRODUCT TYPE, USD/TONS
    FIGURE 12. PATENT ANALYSIS, BY COUNTRY, 2022
    FIGURE 13. PATENT ANALYSIS, BY APPLICANT, 2022
    FIGURE 14. PATENT ANALYSIS, BY PUBLICATION DATE, 2013–2022
    FIGURE 15. GLASS-LIKE CARBON MARKET, BY SYNTHESIS, 2021–2031 ($MILLION)
    FIGURE 16. COMPARATIVE SHARE ANALYSIS OF GLASS-LIKE CARBON MARKET FOR LOW-TEMPERATURE SYNTHESIS, BY COUNTRY, 2021 & 2031 (%)
    FIGURE 17. COMPARATIVE SHARE ANALYSIS OF GLASS-LIKE CARBON MARKET FOR HIGH-TEMPERATURE SYNTHESIS, BY COUNTRY, 2021 & 2031 (%)
    FIGURE 18. GLASS-LIKE CARBON MARKET, BY APPLICATION, 2021–2031 ($MILLION)
    FIGURE 19. COMPARATIVE SHARE ANALYSIS OF GLASS-LIKE CARBON MARKET FOR ELECTRODE MATERIAL, BY COUNTRY, 2021& 2031 (%)
    FIGURE 20. COMPARATIVE SHARE ANALYSIS OF GLASS-LIKE CARBON MARKET FOR SURGICAL IMPLANTS, BY COUNTRY, 2021 & 2031 (%)
    FIGURE 21. COMPARATIVE SHARE ANALYSIS OF GLASS-LIKE CARBON MARKET FOR SEMICONDUCTORS AND ELECTRONICS, BY COUNTRY, 2021 & 2031 (%)
    FIGURE 22. COMPARATIVE SHARE ANALYSIS OF GLASS-LIKE CARBON MARKET FOR TEMPERATURE MANAGEMENT, BY COUNTRY, 2021& 2031 (%)
    FIGURE 23. COMPARATIVE SHARE ANALYSIS OF GLASS-LIKE CARBON MARKET FOR OTHERS, BY COUNTRY, 2021& 2031 (%)
    FIGURE 24. GLASS-LIKE CARBON MARKET, BY REGION, 2021–2031 ($MILLION)
    FIGURE 25. U.S. GLASS-LIKE CARBON MARKET REVENUE, 2021–2031($MILLION)
    FIGURE 26. CANADA GLASS-LIKE CARBON MARKET REVENUE, 2021–2031($MILLION)
    FIGURE 27. MEXICO GLASS-LIKE CARBON MARKET REVENUE, 2021–2031($MILLION)
    FIGURE 28. GERMANY GLASS-LIKE CARBON MARKET REVENUE, 2021–2031($MILLION)
    FIGURE 29. FRANCE GLASS-LIKE CARBON MARKET REVENUE, 2021–2031($MILLION)
    FIGURE 30. UK GLASS-LIKE CARBON MARKET REVENUE, 2021–2031($MILLION)
    FIGURE 31. ITALY GLASS-LIKE CARBON MARKET REVENUE, 2021–2031($MILLION)
    FIGURE 32. SPAIN GLASS-LIKE CARBON MARKET REVENUE, 2021–2031($MILLION)
    FIGURE 33. REST OF EUROPE GLASS-LIKE CARBON MARKET REVENUE, 2021–2031($MILLION)
    FIGURE 34. CHINA GLASS-LIKE CARBON MARKET REVENUE, 2021–2031($MILLION)
    FIGURE 35. JAPAN GLASS-LIKE CARBON MARKET REVENUE, 2021–2031($MILLION)
    FIGURE 36. INDIA GLASS-LIKE CARBON MARKET REVENUE, 2021–2031($MILLION)
    FIGURE 37. AUSTRALIA GLASS-LIKE CARBON MARKET REVENUE, 2021–2031($MILLION)
    FIGURE 38. SOUTH KOREA GLASS-LIKE CARBON MARKET REVENUE, 2021–2031($MILLION)
    FIGURE 39. REST OF ASIA-PACIFIC GLASS-LIKE CARBON MARKET REVENUE, 2021–2031($MILLION)
    FIGURE 40. BRAZIL GLASS-LIKE CARBON MARKET REVENUE, 2021–2031($MILLION)
    FIGURE 41. SAUDI ARABIA GLASS-LIKE CARBON MARKET REVENUE, 2021–2031($MILLION)
    FIGURE 42. SOUTH AFRICA GLASS-LIKE CARBON MARKET REVENUE, 2021–2031($MILLION)
    FIGURE 43. REST OF LAMEA GLASS-LIKE CARBON MARKET REVENUE, 2021–2031($MILLION)
    FIGURE 44. MARKET PLAYER POSITIONING, 2021
    FIGURE 45. PRODUCT MAPPING OF TOP 10 PLAYERS
    FIGURE 46. COMPETITIVE DASHBOARD
    FIGURE 47. COMPETITIVE HEATMAP OF KEY PLAYERS
    FIGURE 48. MERCK KGAA: REVENUE, 2019–2021 ($MILLION)
    FIGURE 49. MERCK KGAA: REVENUE SHARE BY SEGMENT, 2021 (%)


According to CXOs of leading companies, the global glass-like carbon market is expected to exhibit high growth potential during the forecast period. The drastic growth in adoption rate of smart phones, tablets, and introduction of highly advanced consumer electronic devices have surged the growth of the glass-like carbon market. In addition, the increase in trend for fuel cells and advanced battery systems where glass-like carbon-based electrode plays a significant role in electrochemical applications is expected to positively impact the growth of this market.

According to some CXOs, due to the considerable growth in the automotive industry, there is an increase in the demand for glassy-carbon based efficient brake pad systems, and this is expected to open new growth opportunities for the market. Emergence of modern aircraft with advanced avionics where glassy like carbon is used for manufacturing sensors, semiconductors, and other electronic components are projected to widen the growth trajectory of this market. As there is a rise in the adoption rate of consumer electronics devices, the assessment period from 2021 to 2031 is anticipated to be a transformational phase for the growth of this market.

PURCHASE OPTIONS

Call or Email us

U.S.-Canada Toll-free: +1-800-792-5285
Int'l : +1-503-894-6022
Europe : +44-845-528-1300
Email : help@alliedmarketresearch.com
 
FREQUENTLY ASKED QUESTIONS?

A. The emergence of the compressed form of glassy carbon opens possibilities for aerospace applications where light-weight and high-strength materials are required.

A. The electrode material segment dominated the global market in 2021 and is anticipated to grow at a CAGR of 3.9% during the forecast period.

A. Europe accounted for the largest revenue share in the global glass like carbon market, growing at a CAGR of 4.0% during the forecast period.

A. The global glass-like carbon market is projected to reach $118.4 million by 2031, growing at a CAGR of 3.7% from 2022 to 2031.

A. The major companies profiled in this report include ALS Co., Ltd, Bioanalytical Systems, Inc, Final, Advanced Materials, Merck KGaA, Metrohm AG, PalmSens BV, Redoxme AB, Structure Probe, Inc., Tokai Carbon, and XRD Graphite Manufacturing Co., Ltd.

Looking for Customization?

 Customization Request

Have a Question?

 Speak with Analyst

Any Confusion?

 Inquire Before Buying

Have a glance of the Report

  Request Sample
RELATED TAGS

Purchase Full Report of
Glass Like Carbon Market

Start reading instantly.
This Report and over 67,068+ more Reports, Available with Avenue Library. T&C*.

  • Online Only
  • $3,570
  • Online cloud access only
  • Restricted print, copy, paste & download
  • Read only
  • Free industry update
    (Within 180 days)
  • Free report update in next update cycle
    (Jul 2023 - Jul 2024)
  • Data Pack
  • $3,840
  • Restricted to one authorized user
  • One print only
  • Available in
    Excel
  • Free industry update
    (Within 180 days)
  •   Free report update in next update cycle
    (Jul 2023 - Jul 2024)
  • Single User
  • $5,730
  • Restricted to one authorized user
  • One print only
  • Available in
    PDF
  • Free industry update
    (Within 180 days)
  •   Free report update in next update cycle
    (Jul 2023 - Jul 2024)
  • Five Users
  • $6,450
  • Limited to five authorized users
  • Print upto five copies
  • Available in
    PDF
  • Free industry update
    (Within 180 days)
  •   Free report update in next update cycle
    (Jul 2023 - Jul 2024)
  • Enterprise
    License/PDF

  • $9,600
  • Unlimited
    within
    company/enterprise
  • Available in Excel & PDF
  • Free industry update
    (Within 180 days)
  •   Free report update in next update cycle
    (Jul 2023 - Jul 2024)
  • Library
    Membership

  • $999 $ 1,175
    Per User/ Per month/ Billed annually
  • Published Content
    E-access
  • Company Profiles
    E-access
  • Newly Added Content Access
  • 10 PDF
    Downloads
  • 5 Excel Data
    Pack Downloads
  • 250 Company Profiles PDF Downloads
  • Buy Now

*Taxes/Fees, if applicable will be added during checkout. All prices in USD

RELATED REPORTS
 

Why Allied Market Research?


Infallible Methodology

To ensure high-level data integrity, accurate analysis, and impeccable forecasts

Analyst Support

For complete satisfaction

Customization

On-demand customization of scope of the report to exactly meet your needs

TARGETED MARKET VIEW

Targeted market view to provide pertinent information and save time of readers

Get fresh content delivered

Get insights on topics that are crucial for your business. Stay abreast of your interest areas.

Get Industry Data Alerts

Why Allied Market Research?

Infallible Methodology

To ensure high-level data integrity, accurate analysis, and impeccable forecasts

Analyst Support

For complete satisfaction

Customization

On-demand customization of scope of the report to exactly meet your needs

TARGETED MARKET VIEW

Targeted market view to provide pertinent information and save time of readers